Exercise or exercise and diet for preventing type 2 diabetes mellitus
Referencias
References to studies included in this review
References to studies excluded from this review
References to studies awaiting assessment
References to ongoing studies
Additional references
Characteristics of studies
Characteristics of included studies [ordered by study ID]
| Methods | Follow‐up: 1 year. | |
| Participants | Randomised number: I2:187, CG: 188 Sex (% female): I2: 58.6; C1: 57.8 Baseline BMI: I2: 29.7(4.1); C1: 29.8(4.6) Inclusion criteria: age: 45‐64 years Exclusion criteria: Diseases which require specific diet and exercise recommendations: diabetes, cardiovascular diseases, chronic liver or kidney disease and advanced cancer Ethnic group: NR. | |
| Interventions | Duration of intervention: 1 year. | |
| Outcomes | Primary outcomes: IDM | |
| Notes | Stated aim of study: To know wether a program of moderate intervention might effectively reduce metabolic abnormalities in the general population. Randomization procedure: performed by using an SAS program stratifying participants according to sex, education level, general practitioner, area of residence, and number of metabolic syndrome components. | |
| Risk of bias | ||
| Bias | Authors' judgement | Support for judgement |
| Adequate sequence generation? | Low risk | Quote: "Participants were stratified according to age, sex, education level..." "the randomisation procedure was automatically performed by a statistician using a SAS programme developed to minimize the differences between the two groups for all stratifying variables." |
| Allocation concealment? | Low risk | Quote: "Random allocation with a minimization algorithm was centrally performed in a single step. The researchers then received the two lists of nominative data." |
| Blinding? | Low risk | Quote: "Because of the nature of the intervention, blinding participants and health professionals was not possible. Family physicians, the physicians who collected data, the dietician, and the laboratory personnel were blinded to the group assignment." |
| Incomplete outcome data addressed? | Low risk | Quote: "Written informed consent to participate was not given by 18 of 187 (9.6%) and 22 of 188 (11.7%) subjects from the intervention group and the control group, respectively." |
| Free of selective reporting? | Unclear risk | Comment: Insufficient information provided. |
| Free of other bias? | Low risk | |
| Methods | Follow‐up: 6 years. | |
| Participants | Randomised number: 577. | |
| Interventions | Duration of intervention: 6 years. | |
| Outcomes | Primary outcomes: IDM | |
| Notes | Stated aim of study: to determine whether diet and exercise interventions in those with IGT may delay the development of DM. | |
| Risk of bias | ||
| Bias | Authors' judgement | Support for judgement |
| Adequate sequence generation? | Unclear risk | Quote: "subjects were randomised by clinic" |
| Allocation concealment? | Unclear risk | Comment: no information |
| Blinding? | Unclear risk | Comment: no information |
| Incomplete outcome data addressed? | Unclear risk | Quote: "7 people refused follow‐up, 29 left Da Qing..., and 11 died... No deaths... occurred in the exercise... Three deaths occurred in the control..." "Those who left in 1988 very early in the study and before the first follow‐up for reasons unrelated to their randomisation group were not included in the analysis. The 11 who died were retained, although none had developed diabetes before death." |
| Free of selective reporting? | Unclear risk | Comment: insufficient information provided. |
| Free of other bias? | High risk | Quote: "Physical exercise, expressed in units per day, was significantly higher at baseline in the diet‐plus exercise group than in the control group." |
| Methods | Follow‐up: average 2.8 years; range 1.8‐4.6. | |
| Participants | Randomised number: 3234 | |
| Interventions | Duration: Average 2.8 years, range 1.8‐4.6 | |
| Outcomes | Primary outcomes: IDM, CVD | |
| Notes | Stated aim of study: to evaluate whether a lifestyle‐intervention program or the administration of metformin would prevent or delay the development of diabetes. | |
| Risk of bias | ||
| Bias | Authors' judgement | Support for judgement |
| Adequate sequence generation? | Unclear risk | Quote: "adaptative randomisation is stratified by clinical centre" |
| Allocation concealment? | Low risk | Quote: "The urn method was used" |
| Blinding? | Low risk | Quote: "Investigators and participants remain masked to primary outcome data until progression to diabetes is confirmed." "Assignments to metformin and placebo were double‐blinded" |
| Incomplete outcome data addressed? | Low risk | Quote: "Participants who prematurely discontinue their follow‐up visits before confirmed development of diabetes will be censored as of their last follow‐up visit." |
| Free of selective reporting? | Unclear risk | Comment: Outcomes published in many different publications. Many outcomes are reported incompletely so that they cannot be entered in a meta‐analysis. |
| Free of other bias? | Low risk | |
| Methods | Follow‐up: 3.2 years. | |
| Participants | Randomised number: 522. | |
| Interventions | Duration of intervention: mean 3.2 years. | |
| Outcomes | Primary outcomes: IDM | |
| Notes | Stated aim of study: to assess the efficacy of an intensive diet‐exercise programme in preventing or delaying Type II DM in individuals with IGT. | |
| Risk of bias | ||
| Bias | Authors' judgement | Support for judgement |
| Adequate sequence generation? | Unclear risk | Quote: "randomization list, with stratification according to center, sex and mean 2hPG. |
| Allocation concealment? | High risk | Quote: "randomly assigned to the intervention group or the control group by the study physician, with the use of a randomization list" |
| Blinding? | Low risk | Quote: "The nurses who scheduled the study visits did not have access to the randomization list... Laboratory staff did not know the subjects' group assignments, and the subjects were not informed of their plasma glucose concentrations during follow‐up unless diabetes was diagnosted." |
| Incomplete outcome data addressed? | Low risk | Quote: "...were defined as dropouts... data from their earlier visits were included in the analyses." "40 subjects (8 percent) withdrew ‐ 23 in the intervention group and 17 in the control group... 9 could no tbe contacted, 3 withdrew due to severe ilness, 1 died, and 27 withdrew for personal reasons." |
| Free of selective reporting? | Unclear risk | Comment: Insufficient information provided. |
| Free of other bias? | Low risk | |
| Methods | Follow‐up: mean 30 months. | |
| Participants | Randomised number: 531. | |
| Interventions | Duration of intervention: 3 years. | |
| Outcomes | Primary outcomes: IDM | |
| Notes | Stated aim of study: tested whether the progression to diabetes could be influenced by interventions in native Asia Indians with IGT. | |
| Risk of bias | ||
| Bias | Authors' judgement | Support for judgement |
| Adequate sequence generation? | Unclear risk | Quote: "were consecutively randomised in the four groups" |
| Allocation concealment? | Unclear risk | Comment: no information |
| Blinding? | Low risk | Quote: "The principal investigators were blinded to the interim results." |
| Incomplete outcome data addressed? | Low risk | Comment: Lost to follow‐up and drop outs described in a flow chart. |
| Free of selective reporting? | Unclear risk | Comment: Insufficient information provided. |
| Free of other bias? | Low risk | |
| Methods | Follow‐up: 4 years. | |
| Participants | Randomised number: 484. | |
| Interventions | Duration of intervention: 4 years. | |
| Outcomes | Primary outcomes: | |
| Notes | Stated aim of study: to assess the effect of lifestyle intervention on the incidence of diabetes in males with IGT. Randomization procedure: one of every five persons was randomly selected for allocating to the I2, and the others were assigned to the CG. | |
| Risk of bias | ||
| Bias | Authors' judgement | Support for judgement |
| Adequate sequence generation? | Unclear risk | Quote: "One of every five subjects was randomly selected for allocation the intensive intervention group, and the others were assigned to the standard intervention (control) group." |
| Allocation concealment? | Unclear risk | Comment: no information |
| Blinding? | Unclear risk | Comment: no information |
| Incomplete outcome data addressed? | Unclear risk | Comment: no reasons for missing data provided. |
| Free of selective reporting? | Unclear risk | Comment: insufficient information provided. |
| Free of other bias? | Low risk | |
| Methods | Follow‐up: 24 months. | |
| Participants | Randomised number: 78 | |
| Interventions | Duration: 24 month. | |
| Outcomes | Primary outcomes: IDM | |
| Notes | Stated aim of study: To evaluate the efficacy of interventions to promote a healthy diet and physical activity in people with impaired glucose tolerance. | |
| Risk of bias | ||
| Bias | Authors' judgement | Support for judgement |
| Adequate sequence generation? | Low risk | Quote: "...using a random number table to the intervention or control group at the first appointment." |
| Allocation concealment? | Low risk | Quote: "Researchers performing the randomisation were blinded to the group allocation." |
| Blinding? | Unclear risk | Comment: no information. |
| Incomplete outcome data addressed? | High risk | Comment: there was a high attrition rate, not balanced between treatment groups. Attrition rate was 23% in the treatment group and 38% in the control group after 24 month of follow‐up. |
| Free of selective reporting? | Unclear risk | Comment: insufficient information. |
| Free of other bias? | High risk | Quote: "...a significantly larger proportion of control participants reported engaging in regular physical activity sufficient to get their heart thumping at least once a week compared with intervention participant (53% versus 24%)" "There were fewer women (10/32 (32%)) than men (22/32 (69%)) in the control group compared with the intervention group..." |
| Methods | Follow‐up: 2 years. | |
| Participants | Randomised number: 154. | |
| Interventions | Duration of intervention: 2 years. | |
| Outcomes | Primary outcomes: IDM | |
| Notes | Stated aim of study: to determine the effectiveness over 2 years of diet, exercise, or the combination of diet + exercise on changes in eating and exercise behavior, body weight, cardiovascular risk factors, and the incidence of diabetes in overweight individuals with a parental history of DM. | |
| Risk of bias | ||
| Bias | Authors' judgement | Support for judgement |
| Adequate sequence generation? | Unclear risk | Quote: "...were randomly assigned to one of the four treatment conditions." |
| Allocation concealment? | Unclear risk | Comment: no information. |
| Blinding? | Low risk | Quote: "All scoring of the 3‐day records was done blinded to treatment condition and phase" |
| Incomplete outcome data addressed? | Unclear risk | Comment: no information on reasons for missing data provided. |
| Free of selective reporting? | Unclear risk | Comment: insufficient information provided. |
| Free of other bias? | Low risk | |
FPG: fasting plasma glucose, IFG: impaired fasting glucose, IGT: impaired glucose tolerance, 2h PG: 2h plasma glucose, 2h OGTT: 2h 75‐g after oral glucose tolerance test, I1: exercise group, I2: exercise+diet group, I3: diet group, CG: Control Group, DM: Type II diabetes mellitus, IDM: incidence of diabetes mellitus, DCM: diabetes and cardiovascular related morbidity, CHD: coronary heart disease, TG: triglycerides, HDL: HDL‐cholesterol, LDL: LDL‐cholesterol, Chol: total cholesterol, W: weight, BMI: body mass index, WHR: waist‐to‐hip‐ratio, SBP: systolic blood pressure, DBP: diastolic blood pressure, QL: quality of life, AE: adverse effects, M: mortality, BL: base line, AHA: American Heart Association, NR: not reported.
Characteristics of excluded studies [ordered by study ID]
| Study | Reason for exclusion |
| Principal findings are based on a post‐hoc sub‐group analysis. | |
| Not a randomised trial. | |
| None of the primary or secondary objectives assessed the incidence of diabetes. | |
| Inadequate randomisation, the control group was not randomised. | |
| Included diabetic participants at baseline. | |
| Not a randomised controlled trial. | |
| Both experimental and control groups received the same nutritional education and physical activity training. | |
| Follow‐up time was less than six months. | |
| The control group received an intervention that differed to the standard recommendation. | |
| Non of the primary or secondary objectives assessed the incidence of diabetes. | |
| Non of the primary or secondary objectives was to asses the incidence of diabetes. | |
| Not a randomised controlled trial. | |
| Inadequate randomisation: quasi‐randomised patients. | |
| Duration of intervention less than six months. | |
| None of the primary or secondary objectives assessed the incidence of diabetes. |
Characteristics of studies awaiting assessment [ordered by study ID]
| Methods | Randomised controlled trial |
| Participants | 365 sedentary adults who had a parental history of type 2 diabetes. |
| Interventions | Intervention 1: behavioural change programme delivered by a facilitator over the telephone(distance). Intervention 2: same programme, but delivered in the home (face to face). Control: comparison group (advice). Participants in the two intervention groups were taught to maximise personal advantages and opportunities,and to minimise disadvantages and obstacles to becoming more physically active. |
| Outcomes | Maximal cardiorespiratory fitness(VO2max), and self‐reported physical activity, Weight, ;body‐fat percentage; and blood pressure, glycosylated haemoglobin, fasting plasma glucose, lipids, and insulin. |
| Notes | Diabetes incidence was not reported, might be included in further updates. |
| Methods | Randomised controlled trial. |
| Participants | 102 participants with mean 2‐h glucose concentration of two OGTTs of 7.8‐12.5 mmol/L and FPG <7.8 mmol/L. |
| Interventions | Intervention group: dietary and exercise intervention. Control group: general information. |
| Outcomes | change in glucose tolerance (2‐h PG), FPG, plasma insulin concentration, insulin resistance, glycated haemoglobin, and changes in body weight, body composition and VO2max. CHanges in cardiovascular risk factors are assessed (blood pressure and blood lipid profile). |
| Notes | Final 3 year results not published. |
| Methods | Randomised controlled trial. |
| Participants | 209 overweight children, ages 8‐16 years. |
| Interventions | Intervention group: weight management intervention: intensive family‐based program including exercise, nutrition, and behaviour modification. Control group: diet and exercise counseling. |
| Outcomes | Changes in weight, BMI, body fat, and homeostasis model assessment of insulin resistance, blood pressure, FPG, lipid profile. |
| Notes | Incidence of diabetes part of a paper that the authors are preparing for publication. |
Characteristics of ongoing studies [ordered by study ID]
| Trial name or title | The European Diabetes Prevention Study (EDPS) |
| Methods | Multicentre, parallel design, randomised controlled study. |
| Participants | 104 people aged 40 to 75, with IGT and overweight. |
| Interventions | Intervention group: regular and intensive diet and physical activity advice complemented by a number of small group educational activities. Control group: will receive routinely available lifestyle advice |
| Outcomes | The primary outcome measure will be incidence of Type 2 diabetes. |
| Starting date | 20/07/2000 |
| Contact information | University of Newcastle upon Tyne Public Health Research Group Faculty of Medical Sciences School of Population and Health Sciences Newcastle upon Tyne NE2 4HH United Kingdom Tel: +44 (0)191 222 6275 Fax: +44 (0)191 222 6461 Email: [email protected] |
| Notes |
Data and analyses
| Outcome or subgroup title | No. of studies | No. of participants | Statistical method | Effect size |
| 1 Diabetes incidence ‐ ITT (RR/HR) Show forest plot | 8 | risk/hazard ratio (Random, 95% CI) | 0.63 [0.49, 0.79] | |
| Analysis 1.1  Comparison 1 Exercise+diet vs standard recommendations (overall analysis), Outcome 1 Diabetes incidence ‐ ITT (RR/HR). | ||||
| 2 Diabetes incidence ‐ ITT (OR/HR) Show forest plot | 8 | odds/hazard ratio (Random, 95% CI) | 0.51 [0.40, 0.65] | |
| Analysis 1.2  Comparison 1 Exercise+diet vs standard recommendations (overall analysis), Outcome 2 Diabetes incidence ‐ ITT (OR/HR). | ||||
| 3 Mean differences between groups in fasting plasma glucose (mmol/L) Show forest plot | 6 | 3315 | Mean Difference (IV, Random, 95% CI) | ‐0.19 [‐0.32, ‐0.05] |
| Analysis 1.3  Comparison 1 Exercise+diet vs standard recommendations (overall analysis), Outcome 3 Mean differences between groups in fasting plasma glucose (mmol/L). | ||||
| 4 Mean differences between groups in 2‐h plasma glucose (mmol/L) Show forest plot | 3 | 756 | Mean Difference (IV, Random, 95% CI) | ‐0.23 [‐1.08, 0.61] |
| Analysis 1.4  Comparison 1 Exercise+diet vs standard recommendations (overall analysis), Outcome 4 Mean differences between groups in 2‐h plasma glucose (mmol/L). | ||||
| 5 Mean differences between groups in body mass index (BMI ‐ kg/m2) Show forest plot | 6 | 3315 | Mean Difference (IV, Random, 95% CI) | ‐1.11 [‐2.01, ‐0.21] |
| Analysis 1.5  Comparison 1 Exercise+diet vs standard recommendations (overall analysis), Outcome 5 Mean differences between groups in body mass index (BMI ‐ kg/m2). | ||||
| 6 Mean differences between groups in weight (kg) Show forest plot | 7 | 3773 | Mean Difference (IV, Random, 95% CI) | ‐2.72 [‐4.72, ‐0.72] |
| Analysis 1.6  Comparison 1 Exercise+diet vs standard recommendations (overall analysis), Outcome 6 Mean differences between groups in weight (kg). | ||||
| 7 Mean differences between groups in waist‐to‐hip ratio (WHR) Show forest plot | 4 | 2546 | Mean Difference (IV, Random, 95% CI) | ‐0.01 [‐0.02, 0.01] |
| Analysis 1.7  Comparison 1 Exercise+diet vs standard recommendations (overall analysis), Outcome 7 Mean differences between groups in waist‐to‐hip ratio (WHR). | ||||
| 8 Mean differences between groups in waist circumference (cm) Show forest plot | 4 | 2983 | Mean Difference (IV, Random, 95% CI) | ‐3.90 [‐5.90, ‐1.91] |
| Analysis 1.8  Comparison 1 Exercise+diet vs standard recommendations (overall analysis), Outcome 8 Mean differences between groups in waist circumference (cm). | ||||
| 9 Mean differences between groups in total cholesterol (mmol/L) Show forest plot | 5 | 1154 | Mean Difference (IV, Random, 95% CI) | ‐0.09 [‐0.19, 0.01] |
| Analysis 1.9  Comparison 1 Exercise+diet vs standard recommendations (overall analysis), Outcome 9 Mean differences between groups in total cholesterol (mmol/L). | ||||
| 10 Mean differences between groups in HDL cholesterol (mmol/L) Show forest plot | 5 | 1154 | Mean Difference (IV, Random, 95% CI) | 0.04 [‐0.00, 0.09] |
| Analysis 1.10  Comparison 1 Exercise+diet vs standard recommendations (overall analysis), Outcome 10 Mean differences between groups in HDL cholesterol (mmol/L). | ||||
| 11 Mean differences between groups in LDL cholesterol (mmol/L) Show forest plot | 3 | 385 | Mean Difference (IV, Random, 95% CI) | 0.03 [‐0.11, 0.17] |
| Analysis 1.11  Comparison 1 Exercise+diet vs standard recommendations (overall analysis), Outcome 11 Mean differences between groups in LDL cholesterol (mmol/L). | ||||
| 12 Mean differences between groups in triglycerides (mmol/L) Show forest plot | 4 | 1091 | Mean Difference (IV, Random, 95% CI) | ‐0.14 [‐0.22, ‐0.05] |
| Analysis 1.12  Comparison 1 Exercise+diet vs standard recommendations (overall analysis), Outcome 12 Mean differences between groups in triglycerides (mmol/L). | ||||
| 13 Mean differences between groups in systolic blood pressure (mmHg) Show forest plot | 5 | 2268 | Mean Difference (IV, Random, 95% CI) | ‐3.54 [‐4.83, ‐2.24] |
| Analysis 1.13  Comparison 1 Exercise+diet vs standard recommendations (overall analysis), Outcome 13 Mean differences between groups in systolic blood pressure (mmHg). | ||||
| 14 Mean differences between groups in diastolic blood pressure (mmHg) Show forest plot | 6 | 2521 | Mean Difference (IV, Random, 95% CI) | ‐1.79 [‐2.45, ‐1.14] |
| Analysis 1.14  Comparison 1 Exercise+diet vs standard recommendations (overall analysis), Outcome 14 Mean differences between groups in diastolic blood pressure (mmHg). | ||||
| Outcome or subgroup title | No. of studies | No. of participants | Statistical method | Effect size |
| 1 Diabetes incidence ‐ ITT (RR/HR) Show forest plot | 2 | risk/hazard ratio (Random, 95% CI) | 0.69 [0.29, 1.65] | |
| Analysis 2.1  Comparison 2 Exercise vs standard recommendations (overall analysis), Outcome 1 Diabetes incidence ‐ ITT (RR/HR). | ||||
| 2 Diabetes incidence ‐ ITT (OR/HR) Show forest plot | 2 | odds/hazard ratio (Random, 95% CI) | 0.67 [0.29, 1.57] | |
| Analysis 2.2  Comparison 2 Exercise vs standard recommendations (overall analysis), Outcome 2 Diabetes incidence ‐ ITT (OR/HR). | ||||
| Outcome or subgroup title | No. of studies | No. of participants | Statistical method | Effect size |
| 1 Diabetes incidence ‐ ITT (RR/HR) Show forest plot | 2 | risk/hazard ratio (Random, 95% CI) | 0.69 [0.37, 1.29] | |
| Analysis 3.1  Comparison 3 Exercise vs diet (overall analysis), Outcome 1 Diabetes incidence ‐ ITT (RR/HR). | ||||
| 2 Diabetes incidence ‐ ITT (OR/HR) Show forest plot | 2 | odds/hazard ratio (Random, 95% CI) | 0.65 [0.29, 1.44] | |
| Analysis 3.2  Comparison 3 Exercise vs diet (overall analysis), Outcome 2 Diabetes incidence ‐ ITT (OR/HR). | ||||
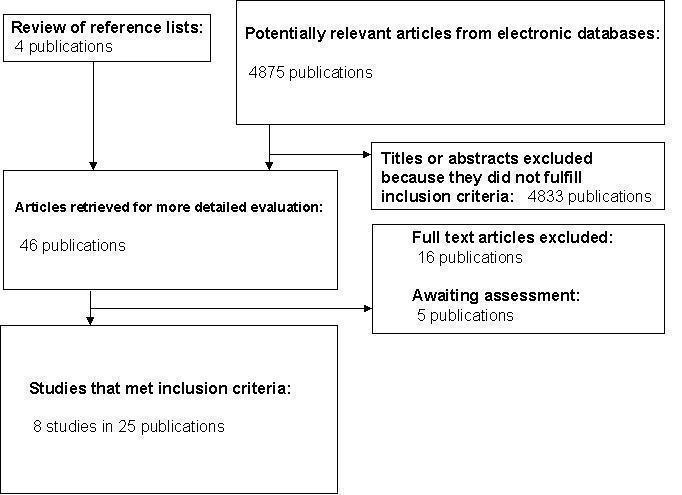
QUOROM (quality of reporting of meta‐analyses) flow‐chart of study selection.

Risk of bias summary: review authors' judgments about each risk of bias item for each included study.
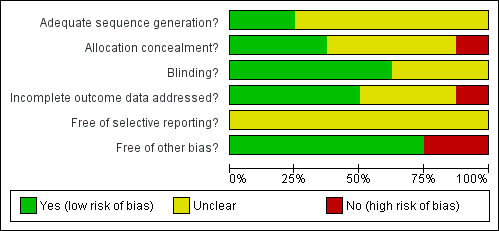
Risk of bias graph: review authors' judgments about each risk of bias item presented as percentages across all included studies.

Comparison 1 Exercise+diet vs standard recommendations (overall analysis), Outcome 1 Diabetes incidence ‐ ITT (RR/HR).
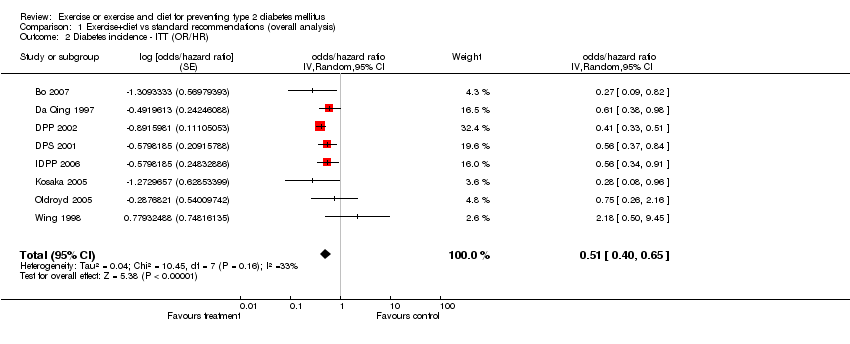
Comparison 1 Exercise+diet vs standard recommendations (overall analysis), Outcome 2 Diabetes incidence ‐ ITT (OR/HR).
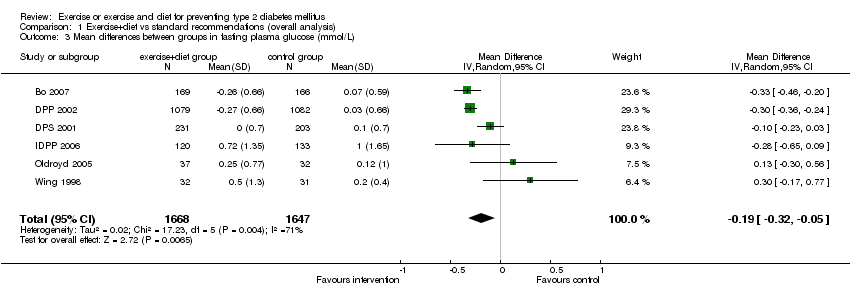
Comparison 1 Exercise+diet vs standard recommendations (overall analysis), Outcome 3 Mean differences between groups in fasting plasma glucose (mmol/L).

Comparison 1 Exercise+diet vs standard recommendations (overall analysis), Outcome 4 Mean differences between groups in 2‐h plasma glucose (mmol/L).
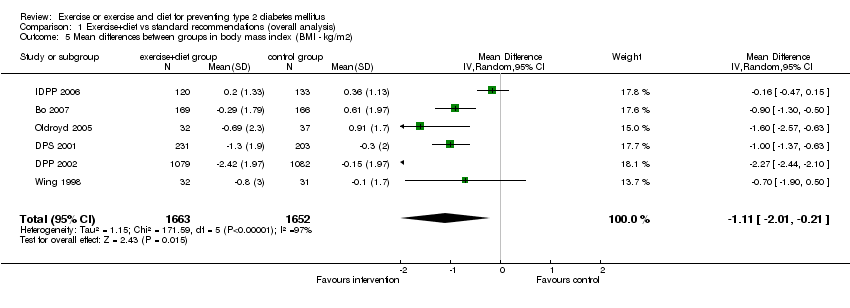
Comparison 1 Exercise+diet vs standard recommendations (overall analysis), Outcome 5 Mean differences between groups in body mass index (BMI ‐ kg/m2).

Comparison 1 Exercise+diet vs standard recommendations (overall analysis), Outcome 6 Mean differences between groups in weight (kg).

Comparison 1 Exercise+diet vs standard recommendations (overall analysis), Outcome 7 Mean differences between groups in waist‐to‐hip ratio (WHR).
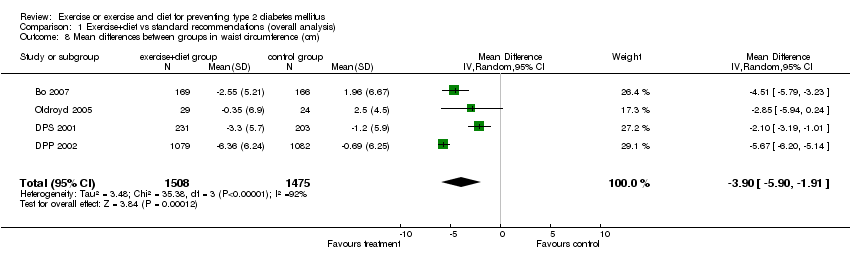
Comparison 1 Exercise+diet vs standard recommendations (overall analysis), Outcome 8 Mean differences between groups in waist circumference (cm).

Comparison 1 Exercise+diet vs standard recommendations (overall analysis), Outcome 9 Mean differences between groups in total cholesterol (mmol/L).

Comparison 1 Exercise+diet vs standard recommendations (overall analysis), Outcome 10 Mean differences between groups in HDL cholesterol (mmol/L).
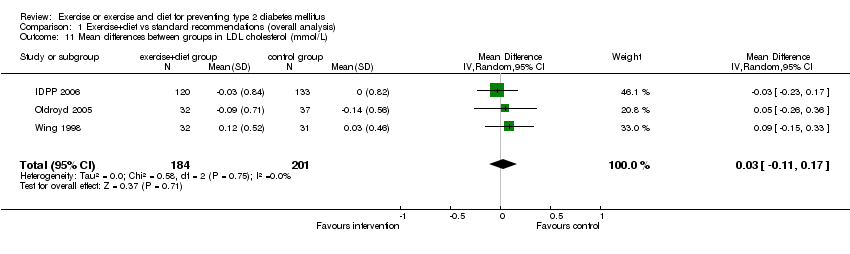
Comparison 1 Exercise+diet vs standard recommendations (overall analysis), Outcome 11 Mean differences between groups in LDL cholesterol (mmol/L).
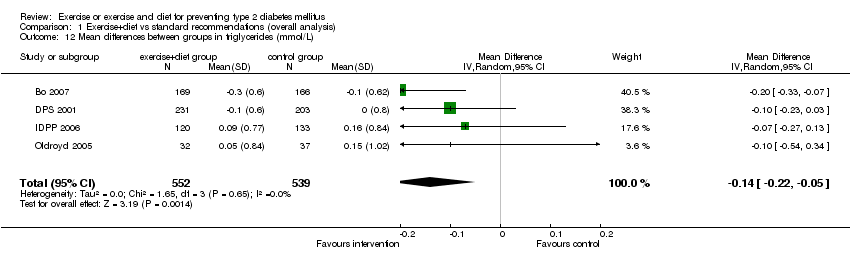
Comparison 1 Exercise+diet vs standard recommendations (overall analysis), Outcome 12 Mean differences between groups in triglycerides (mmol/L).

Comparison 1 Exercise+diet vs standard recommendations (overall analysis), Outcome 13 Mean differences between groups in systolic blood pressure (mmHg).

Comparison 1 Exercise+diet vs standard recommendations (overall analysis), Outcome 14 Mean differences between groups in diastolic blood pressure (mmHg).

Comparison 2 Exercise vs standard recommendations (overall analysis), Outcome 1 Diabetes incidence ‐ ITT (RR/HR).
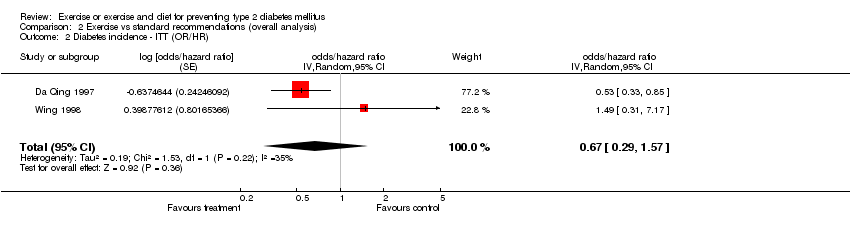
Comparison 2 Exercise vs standard recommendations (overall analysis), Outcome 2 Diabetes incidence ‐ ITT (OR/HR).

Comparison 3 Exercise vs diet (overall analysis), Outcome 1 Diabetes incidence ‐ ITT (RR/HR).
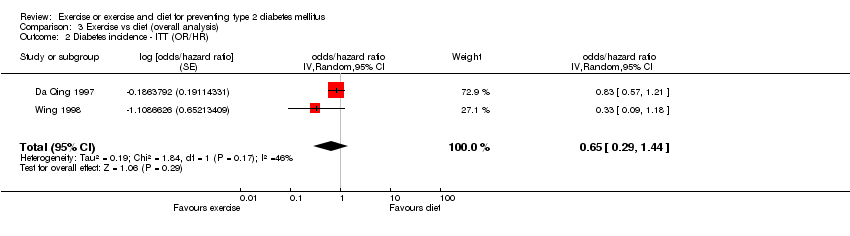
Comparison 3 Exercise vs diet (overall analysis), Outcome 2 Diabetes incidence ‐ ITT (OR/HR).
| Risk/hazard ratio IV, Random, 95% CI | Duration of intervention | Inclusion criteria | Diabetes diagnostic criteria | Compliance measure | |
| Wing 1998 | 2.00 [0.54, 7.43] | 2 years | ‐ Age 40‐50 years ‐ Overweight (30‐100% of ideal body weight) ‐ 1 or 2 biological parents with type 2 diabetes. | FPG >7.78; 5 additional diabetes cases were found; when using new diagnostic criteria: FPG >7.0 | Exercise: Paffenbarger Physical Activity Questionaire and half‐mile walk test (time to completion) VO2max predicted using regression formulas. Diet: Black Food Frequency measure (6 month interval) and three day food diaries. |
| Oldroyd 2005 | 0.80 [0.35, 1.82] | 2 years | ‐ Age 24‐75 years ‐ IGT (1985): 2hPG ≥7.8 mmol/L <11.1 mmol/L | FPG ≥7.8 mmol/L or 2hPG ≥11.1 mmol/L | Exercise: Resting pulse, shuttle walking test and self reported physical activity. |
| DPS 2001 | 0.74 [0.54, 1.01] | Mean 3.2 years | ‐ Age 40‐64 years ‐ BMI >25 Kg/m2 ‐ IGT (WHO 1985) 2hPG: 7.8‐11.0 mmol/L FPG <7.8 mmol/L | WHO 1985
| Monitored by individual interviews at each linial visit. Three day food records. |
| IDPP 2006 | 0.74 [0.57, 0.96] | 3 years | ‐ IGT (WHO 1999) 2hPG= 7.8‐11.0 mmol/L (140‐199 mg/dl) FPG <7.0 mmol/L (<126 mg/dl) | WHO 1999: FPG ≥7.0 mmol/L (≥26 mg/dl) 2hPG ≥11.1 mmol/L (≥200 mg/dl) | Adherence self reported, based on weekly pattern. |
| Da Qing 1997 | 0.61 [0.38, 0.98] | 6 years | ‐ IGT (WHO 1985): 2hPG ≥120 mg/dl and <200 mg/dl | FPG ≥140 mg/dl (≥7.8 mmol/L) or 2hPG ≥200 mg/dl (≥11.1 mmol/L) | Exercise and diet: quantified using standardized forms and interviews. Three day food record. |
| DPP 2002 | 0.50 [0.42, 0.59] | Mean 2.8 years | ‐ Age ≥25y ‐ BMI ≥24 (=22 in asians) ‐ FPG: 95‐125 mg/dl (5.3‐6.9 mmol/L) 2hPG: 140‐199 mg/dl (7.8‐11.0 mmol/l) ADA 1997 | ADA 1997: FPG ≥126 mg/dl (≥7.0 mmol/L) or 2hPG ≥200 mg/dl (≥11.1 mmol/L) | Measuring % of participants achieveing the goal of weight loss of 7%. Physical activity: assessed on the basis of logs kept by the participants. |
| Kosaka 2005 | 0.30 [0.09, 0.98] | 4 years | ‐ IGT (WHO 1980) FPG <140mg/dl 2hPG (100g OGTT): 160‐239 mg/dl ≈ 140‐199 mg/dl on 75g OGTT | FPG ≥140 mg/dl | Changes in body weight and achievement of desirable body weight. |
| Bo 2007 | 0.29 [0.10, 0.85] | 1 year | ‐ Age 45‐64 years ‐ Metabolic Syndrome | WHO 1985 | Evaluating questionnaires and meeting attendance: ‐ Validated semiquantitative food frequency questionnaire. ‐ Minnesota‐Leisure‐Time‐Physical‐Activity questionnaire. |
| IGT: Impaired glucose tolerance; FPG: Fasting plasma glucose; 2hPG: 2 hours plasma glucose; OGTT: Oral glucose tolerance test; BMI: Body mass index | |||||
| Study ID | [n] randomised | [n] safety | [n] ITT | [n] finished study | comments |
| Bo 2007 | 375 | 335 | 335 | 335 | |
| Da Qing | 577 | 541 | 530 | 530 | Randomised numbers in each group not specified. Safety population reflects participants who were followed‐up + deaths |
| DPP 2002 | 3234 | 3234 | 3234 | 2979 | |
| DPS 2001 | 523 | NR | 475 | 475 | Authors state that ITT analysis was performed but data are presented as a per protocol analysis |
| IDPP 2006 | 531 | 531 | 502 | 502 | |
| Kosaka 2005 | 484 | NR | 458 | 458 | ITT performed after the first year |
| Oldroyd 2005 | 78 | 77 | 54 | 54 | Authors state that ITT analysis was performed but data are presented as a per protocol analysis |
| Wing 1998 | 154 | NR | 129 | 129 | Analyses were completed only on the participants who attended the specific assessment |
| ITT: intention‐to‐treat; NR: not reported | |||||
| Outcome or subgroup title | No. of studies | No. of participants | Statistical method | Effect size |
| 1 Diabetes incidence ‐ ITT (RR/HR) Show forest plot | 8 | risk/hazard ratio (Random, 95% CI) | 0.63 [0.49, 0.79] | |
| 2 Diabetes incidence ‐ ITT (OR/HR) Show forest plot | 8 | odds/hazard ratio (Random, 95% CI) | 0.51 [0.40, 0.65] | |
| 3 Mean differences between groups in fasting plasma glucose (mmol/L) Show forest plot | 6 | 3315 | Mean Difference (IV, Random, 95% CI) | ‐0.19 [‐0.32, ‐0.05] |
| 4 Mean differences between groups in 2‐h plasma glucose (mmol/L) Show forest plot | 3 | 756 | Mean Difference (IV, Random, 95% CI) | ‐0.23 [‐1.08, 0.61] |
| 5 Mean differences between groups in body mass index (BMI ‐ kg/m2) Show forest plot | 6 | 3315 | Mean Difference (IV, Random, 95% CI) | ‐1.11 [‐2.01, ‐0.21] |
| 6 Mean differences between groups in weight (kg) Show forest plot | 7 | 3773 | Mean Difference (IV, Random, 95% CI) | ‐2.72 [‐4.72, ‐0.72] |
| 7 Mean differences between groups in waist‐to‐hip ratio (WHR) Show forest plot | 4 | 2546 | Mean Difference (IV, Random, 95% CI) | ‐0.01 [‐0.02, 0.01] |
| 8 Mean differences between groups in waist circumference (cm) Show forest plot | 4 | 2983 | Mean Difference (IV, Random, 95% CI) | ‐3.90 [‐5.90, ‐1.91] |
| 9 Mean differences between groups in total cholesterol (mmol/L) Show forest plot | 5 | 1154 | Mean Difference (IV, Random, 95% CI) | ‐0.09 [‐0.19, 0.01] |
| 10 Mean differences between groups in HDL cholesterol (mmol/L) Show forest plot | 5 | 1154 | Mean Difference (IV, Random, 95% CI) | 0.04 [‐0.00, 0.09] |
| 11 Mean differences between groups in LDL cholesterol (mmol/L) Show forest plot | 3 | 385 | Mean Difference (IV, Random, 95% CI) | 0.03 [‐0.11, 0.17] |
| 12 Mean differences between groups in triglycerides (mmol/L) Show forest plot | 4 | 1091 | Mean Difference (IV, Random, 95% CI) | ‐0.14 [‐0.22, ‐0.05] |
| 13 Mean differences between groups in systolic blood pressure (mmHg) Show forest plot | 5 | 2268 | Mean Difference (IV, Random, 95% CI) | ‐3.54 [‐4.83, ‐2.24] |
| 14 Mean differences between groups in diastolic blood pressure (mmHg) Show forest plot | 6 | 2521 | Mean Difference (IV, Random, 95% CI) | ‐1.79 [‐2.45, ‐1.14] |
| Outcome or subgroup title | No. of studies | No. of participants | Statistical method | Effect size |
| 1 Diabetes incidence ‐ ITT (RR/HR) Show forest plot | 2 | risk/hazard ratio (Random, 95% CI) | 0.69 [0.29, 1.65] | |
| 2 Diabetes incidence ‐ ITT (OR/HR) Show forest plot | 2 | odds/hazard ratio (Random, 95% CI) | 0.67 [0.29, 1.57] | |
| Outcome or subgroup title | No. of studies | No. of participants | Statistical method | Effect size |
| 1 Diabetes incidence ‐ ITT (RR/HR) Show forest plot | 2 | risk/hazard ratio (Random, 95% CI) | 0.69 [0.37, 1.29] | |
| 2 Diabetes incidence ‐ ITT (OR/HR) Show forest plot | 2 | odds/hazard ratio (Random, 95% CI) | 0.65 [0.29, 1.44] | |