胰岛素增敏药物(二甲双胍、罗格列酮、吡格列酮、D‐手性肌醇)治疗患有多囊卵巢综合征、少发性闭经和不孕症的女性
Referencias
References to studies included in this review
References to studies excluded from this review
Additional references
References to other published versions of this review
Characteristics of studies
Characteristics of included studies [ordered by study ID]
Ir a:
| Methods | RCT Setting: Saudi Arabia Method of randomisation: unclear Blinding: double Number randomised: 42 | |
| Participants | Summary: metformin and CC versus CC alone Inclusion criteria: PCOS (Rotterdam criteria) Exclusion criteria: other endocrine disorders, male factor infertility, recent PID, tubal infertility Baseline characteristics of each group: metformin and CC versus CC alone Free thyroxin nmol/L (SD) 4.81 (1.6), 5.2 (1.8) Sex hormone‐binding globulin: nmol/L (SD) 21.7 (3.7), 18.9 (4.3) Dropouts: none | |
| Interventions | Main intervention: metformin 500 mg 3/d Duration: 6 months until 8 weeks of a confirmed pregnancy Co‐interventions: CC 50 mg from day 2 until day 6 of cycle | |
| Outcomes | Ovulation: follicle tracking on transvaginal US Others: menstrual pattern, pregnancy rate, multiple pregnancy rate | |
| Notes | Endocrine and metabolic outcomes not recorded | |
| Risk of bias | ||
| Bias | Authors' judgement | Support for judgement |
| Random sequence generation (selection bias) | Unclear risk | Not stated |
| Allocation concealment (selection bias) | Low risk | Sealed envelopes used |
| Blinding (performance bias and detection bias) | Unclear risk | Not stated |
| Incomplete outcome data (attrition bias) | Low risk | No women were lost to follow‐up |
| Selective reporting (reporting bias) | Unclear risk | Insufficient information in the study |
| Other bias | Unclear risk | Unclear |
| Methods | RCT Setting: Venezuela Method of randomisation: fixed block of 8 randomisation which was performed by the investigational pharmacist. Blinding: double Number randomised: 128 | |
| Participants | Summary: non‐obese PCOS Inclusion criteria: PCOS (oligomenorrhoea < 8 periods/year, hyperandrogenism total testosterone > 2.43 nmol/L Exclusion criteria: late onset adrenal hyperplasia, hypertension. Previous insulin‐sensitiser users Baseline characteristics of each group:
Dropouts: 4 (12.5%) in the metformin arm, 10 (31.3%) in the rosiglitazone group and 2 (6.3%) in the placebo group | |
| Interventions | Main intervention: metformin 850 mg, rosiglitazone 4 mg or placebo tablets twice daily Duration: 6 months Co‐interventions: none | |
| Outcomes | Ovulation: weekly progesterone measurement with a level > 4 ng/mL was considered to be ovulation Anthropometric: weight, BMI, WHR, BP Hormones: testosterone, SHBG, free testosterone, DHEAS Metabolic markers: fasting glucose, AUC glucose and fasting glucose:insulin ratio Others: menstrual pattern | |
| Notes | This study randomised 128 women into 4 groups (metformin alone, rosiglitazone alone, combined metformin and rosiglitazone, placebo alone). We included the combined group in our analysis. We analysed the metformin and rosiglitazone groups separately and compared the results from these 2 groups with the same group of women who took placebo. | |
| Risk of bias | ||
| Bias | Authors' judgement | Support for judgement |
| Random sequence generation (selection bias) | Low risk | Fixed block of 8 randomisation which was performed by the investigational pharmacist |
| Allocation concealment (selection bias) | Low risk | Trial drugs packed in coded boxes allocated by the research nurse. Trial drugs were similar in appearance |
| Blinding (performance bias and detection bias) | Low risk | "Double blinded" |
| Incomplete outcome data (attrition bias) | High risk | Dropouts: 4 (12.5%) in the metformin arm, 10 (31.3%) in the rosiglitazone group and 2 (6.3%) in the placebo group. Details not provided |
| Selective reporting (reporting bias) | Unclear risk | Insufficient information in the study |
| Other bias | Unclear risk | Unclear |
| Methods | RCT Setting: Bangladesh (Infertility Department of women and children's hospital) Method of randomisation: envelopes used, but no other information Blinding: unclear Number randomised: 71 | |
| Participants | Summary: PCOS meeting the Rotterdam criteria for diagnosis Inclusion criteria: subfertile women between 20‐35 years with a diagnosis of PCOS according to Rotterdam criteria Exclusion criteria: Age > 35 years, hypo‐ or hyperthyroidism, hyperprolactinaemia, diabetes mellitus and male factor infertility Baseline characteristics of each group:
Dropouts: none stated | |
| Interventions | Main intervention: Group 1: metformin 1500 mg/d. Group 2: CC 100 mg/d for 5 d Duration: 6 months Co‐interventions: none | |
| Outcomes | Ovulation rate Pregnancy rate | |
| Notes | We have contacted study authors for further information regarding methodology | |
| Risk of bias | ||
| Bias | Authors' judgement | Support for judgement |
| Random sequence generation (selection bias) | Unclear risk | Method of generating random sequence for distribution in envelopes is not stated. |
| Allocation concealment (selection bias) | High risk | Allocation to each group revealed in envelopes but not stated if opaque and sealed. Due to high risk of allocation concealment bias, Begum 2014 is excluded from subgroup analysis by study quality. |
| Blinding (performance bias and detection bias) | Unclear risk | No information given |
| Incomplete outcome data (attrition bias) | Unclear risk | None stated |
| Selective reporting (reporting bias) | Unclear risk | Insufficient information in the study |
| Other bias | Unclear risk | None stated |
| Methods | RCT Setting: Tunisia Method of randomisation: not stated Blinding: not stated Number randomised: 32 | |
| Participants | Summary: non‐obese PCOS Inclusion criteria: Rotterdam criteria Exclusion criteria: late onset adrenal hyperplasia, Cushing's Syndrome, abnormal TFT, hyperprolactinaemia, androgen‐secreting tumour Baseline characteristics of each group:
| |
| Interventions | Main intervention: metformin 1700 mg/d or placebo Duration: unclear Co‐interventions: CC 100 mg from day 3 to day 7 of the cycle. Lifestyle advice on the obese subjects | |
| Outcomes | Ovulation: USS follicular tracking with follicular size > 16 mm | |
| Notes | Inadequate information in the protocol to assess the quality of the trial No reply from study author | |
| Risk of bias | ||
| Bias | Authors' judgement | Support for judgement |
| Random sequence generation (selection bias) | Unclear risk | Inadequate information |
| Allocation concealment (selection bias) | Unclear risk | Inadequate information |
| Blinding (performance bias and detection bias) | Unclear risk | Inadequate information |
| Incomplete outcome data (attrition bias) | Unclear risk | Inadequate information |
| Selective reporting (reporting bias) | Unclear risk | Insufficient information in the study |
| Other bias | Unclear risk | Inadequate information |
| Methods | RCT Setting: Tunisia Method of randomisation: not stated* Blinding: unblinded Number randomised: 63 | |
| Participants | Summary: PCOS non‐obese Inclusion criteria: unclear. ? diagnostic criteria of PCOS used Exclusion criteria: male factor infertility, tubal disease Baseline characteristics of each group:
Dropouts: none | |
| Interventions | Main intervention: metformin 850 mg Duration: not stated Co‐interventions: recommendations on healthy diet. 5 d 100 mg CC treatment | |
| Outcomes | Ovulation: method to confirm ovulation not stated Live birth | |
| Notes | Study protocol is too brief. Inadequate information to assess the quality of the study. No reply from study author* | |
| Risk of bias | ||
| Bias | Authors' judgement | Support for judgement |
| Random sequence generation (selection bias) | Unclear risk | Inadequate information |
| Allocation concealment (selection bias) | Unclear risk | Inadequate information |
| Blinding (performance bias and detection bias) | Unclear risk | Inadequate information |
| Incomplete outcome data (attrition bias) | Unclear risk | Inadequate information |
| Selective reporting (reporting bias) | Unclear risk | Insufficient information in the study |
| Other bias | Unclear risk | Inadequate information |
| Methods | RCT Setting: Switzertland Method of randomisation: unclear* Blinding: double Number randomised: 40 | |
| Participants | Summary: PCOS non‐obese Inclusion criteria: menstrual dysfunction (oligo‐ or amenorrhoea), hirsutism with Ferriman‐Gallwey score > 7 or serum total testosterone > 2.5 nmol/L and SHBG < 50 nmol/L Exclusion criteria: adrenal disease, thyroid dysfunction, diabetes, hyperprolactinaemia Pregnancy or desire for pregnancy, basal FSH > 20 IU/L Medication known to affect reproductive or metabolic functions Previous hysterectomy History of liver disease or alcohol abuse Abnormal liver function tests. Baseline characteristics of each group:
Dropouts: 3 in the treatment group and 2 in the placebo group. The details were not given (lost in follow‐up and protocol violation)
| |
| Interventions | Main intervention: pioglitazone 30 mg or placebo tablet once daily Duration: 3 months Co‐interventions: recommendations on healthy diet and physical activity for weight maintenance 4 weeks prior to the study | |
| Outcomes | Ovulation: progesterone > 9 nmol/L Anthropometric: BMI, WHR Hormones: testosterone, SHBG, DHEAS Metabolic markers: insulin, glucose, AUC insulin, AUC glucose, cholesterol, triglyceride Others: hirsutism | |
| Notes | Participants in this study were very heterogeneous (65% European, 30% Turkish and 5% Asian) No serious side effects or abnormal liver function tests were reported. Nevertheless, women who took pioglitazone experienced more side effects compared with those who took placebo; mild peripheral oedema (18% vs 0%), mastopathy (11.7% vs 5%), sleeping disorders (23% vs 5%), headache (23% vs 5%) and stomach arch (23% vs %%) *No reply from the study author | |
| Risk of bias | ||
| Bias | Authors' judgement | Support for judgement |
| Random sequence generation (selection bias) | Unclear risk | Inadequate information |
| Allocation concealment (selection bias) | Unclear risk | Inadequate information |
| Blinding (performance bias and detection bias) | Unclear risk | Identical trial and placebo tablets. Inadequate information to assess the methodology |
| Incomplete outcome data (attrition bias) | High risk | Missing data not reported |
| Selective reporting (reporting bias) | Unclear risk | Insufficient information in the study |
| Other bias | Unclear risk | Participants in this study were very heterogeneous (65% European, 30% Turkish and 5% Asian). Inadequate information to assess. No reply from study author |
| Methods | RCT Setting: USA Method of randomisation: random table Blinding: not stated Number randomised: 24 | |
| Participants | Summary: non‐obese PCOS Inclusion criteria: chronic anovulation with serum progesterone < 2 ng/mL on day 22 of cycle, in 2 consecutive cycles Normal TFT No clinical and biochemical features of hyperandrogenism Exclusion criteria: Baseline characteristics of each group:
Dropouts: none | |
| Interventions | Main intervention: metformin 500 mg 3/d, placebo Duration: 3 months Co‐interventions: | |
| Outcomes | Ovulation: method to confirm ovulation not stated | |
| Notes | This study evaluated the efficacy of metformin in women with anovulation who do not have evidence of hyperandrogenism; although > 79% of included women had USS evidence of PCO; hence, met the Rotterdam diagnostic criteria of PCOS. | |
| Risk of bias | ||
| Bias | Authors' judgement | Support for judgement |
| Random sequence generation (selection bias) | Unclear risk | Inadequate information |
| Allocation concealment (selection bias) | Unclear risk | Inadequate information |
| Blinding (performance bias and detection bias) | Unclear risk | Inadequate information |
| Incomplete outcome data (attrition bias) | Unclear risk | Limited information to assess |
| Selective reporting (reporting bias) | Unclear risk | Insufficient information in the study |
| Other bias | Unclear risk | Only 79% of the subjects were PCOS |
| Methods | RCT Setting: Brazil Method of randomisation: participants were randomised by a 3rd party by using a table with random numbers (odd number assigned for the metformin group, even number assigned for the placebo group)* Blinding: double Number randomised: 32 | |
| Participants | Summary: obese PCOS Inclusion criteria: oligomenorrhoea (< 6 menstrual cycles), clinical or biochemical hyperandrogenism Baseline characteristics of each group:
Dropouts: 1 in each arm (protocol violation) | |
| Interventions | Main intervention: metformin 500 mg or placebo tablet 3/d Duration: 3 months Co‐interventions: | |
| Outcomes | Anthropometric: BMI, WHR, BP* Hormones: testosterone, SHBG* Metabolic markers: insulin, glucose, cholesterol, LDL, HDL and triglyceride* Others: menstrual pattern | |
| Notes | This study was designed to evaluate the benefit of using metformin in obese women (BMI > 30) with PCOS. 3 participants in each arm were found to have glucose intolerance according to WHO criteria The results of the women who dropped out from the study were excluded from the analysis. *Information kindly provided by the study author that was not in the original paper | |
| Risk of bias | ||
| Bias | Authors' judgement | Support for judgement |
| Random sequence generation (selection bias) | Low risk | Participants were randomised by a 3rd party by using a table with random numbers. Odd number assigned for the metformin group, even number assigned for the placebo group |
| Allocation concealment (selection bias) | Low risk | Trial drugs were similar in appearance. Randomisation carried out by a 3rd party who kept the code until the end of the study. |
| Blinding (performance bias and detection bias) | Low risk | Double‐blinded |
| Incomplete outcome data (attrition bias) | High risk | The results of the women who dropped out from the study were excluded from the analysis. Details of the excluded women were not given |
| Selective reporting (reporting bias) | Unclear risk | Insufficient information in the study |
| Other bias | Unclear risk | Inadequate information |
| Methods | RCT Setting: Germany Method of randomisation: computer‐generated random numbers with randomisation in block of 6. The code was sealed by a 3rd party until the end of the study period. Blinding: double Number randomised: 45 | |
| Participants | Summary: obese PCOS Inclusion criteria: oligomenorrhoea (cycle length > 35days or < 9 periods/year) or amenorrhoea (cycle length > 12 weeks), PCO on USS (Rotterdam consensus 2003), clinical or biochemical hyperandrogenism (testosterone > 2.1 nmol/L or androstenedione > 10.1 nmol/L) Exclusion criteria: hyperprolactinaemia, diabetes, thyroid disease, CAH, Cushings's syndrome Baseline characteristics of each group:*
Dropouts: 1 in the metformin arm, 3 in the placebo arm. Details were not given. Furthermore, 1 in the metformin group and 2 in the placebo became pregnant and were also excluded from the analysis. | |
| Interventions | Main intervention: metformin 500 mg or placebo tablet 3/d Duration: 12 weeks Co‐interventions: none | |
| Outcomes | Anthropometric: BMI, weight* Hormones: testosterone, androstenedione, SHBG, oestradiol, DHEAS, LH, FSH* Metabolic markers: glucose, insulin, AUC glucose, AUC insulin* Others: hirsutism, menstrual pattern* | |
| Notes | The objective of this study was to evaluate the effects of metformin in women with PCOS according to the status of insulin resistance. Insulin resistance was defined as fasting glucose to insulin ratio < 4.5. 32 out of 45 women (71.1%) were classified as insulin‐resistant PCOS. Insulin‐resistant PCOS women responded better than non insulin‐resistant PCOS women in terms of improvement in menstrual cyclicity. The results were presented in median and range. Hence, we could not include these data in the meta‐analysis. We are currently still waiting for a reply from the study author for the converted results in a format of mean and standard deviation. *still awaiting for a reply from the study author | |
| Risk of bias | ||
| Bias | Authors' judgement | Support for judgement |
| Random sequence generation (selection bias) | Low risk | Computer‐generated random numbers with randomisation in block of 6 |
| Allocation concealment (selection bias) | Low risk | The code was sealed by a 3rd party until the end of the study period. Trial drugs were provided by a pharmaceutical company not involved in study design and data analysis |
| Blinding (performance bias and detection bias) | Low risk | Double‐blinded |
| Incomplete outcome data (attrition bias) | Unclear risk | Dropouts: 1 in the metformin arm, 2 in the placebo arm. Details not given |
| Selective reporting (reporting bias) | Low risk | All primary outcome measures (menstrual frequency and metabolic parameters) reported |
| Other bias | Unclear risk | Inadequate information |
| Methods | RCT Setting: Egypt Method of randomisation: computer‐based, blocked (block size not stated) Blinding: not stated; presumed to be unblinded Number randomised: 90 | |
| Participants | Summary: PCOS, obese Inclusion criteria: PCOS (oligomenorrhoea, US findings of ≥ 10 ovarian cysts measuring 2‐8 mm around a dense stroma), hyperinsulinaemia (fasting insulin > 30 mIU/L) Exclusion criteria: diabetes mellitus, thyroid dysfunction, raised prolactin Baseline characteristics of each group:
Dropouts: only as a result of pregnancy (13 from metformin group, 4 from no metformin) | |
| Interventions | Main intervention: 1 of: metformin 500 mg 3/d, no treatment Duration: 6 months Co‐interventions: CC 50 mg on days 5‐9, increased each cycle if not ovulated by 50 mg up to a maximum of 150 mg | |
| Outcomes | Ovulation: by serum progesterone (> 15.9 nmol/L) 9 d after hCG Metabolic markers: fasting insulin Others: pregnancy | |
| Notes | The inclusion criteria did not include previous response to CC. Overall, 65% of those receiving CC and placebo ovulated (compared to 85% of those receiving CC and metformin). This trial reported a significantly higher mean number of mature follicles in the metformin group (3.1 versus 1.9, P < 0.0001), but a significantly lower rate of ovarian hyperstimulation syndrome (4 versus 31, P < 0.001). | |
| Risk of bias | ||
| Bias | Authors' judgement | Support for judgement |
| Random sequence generation (selection bias) | Low risk | Computer randomised |
| Allocation concealment (selection bias) | Unclear risk | Not stated |
| Blinding (performance bias and detection bias) | Unclear risk | Not stated |
| Incomplete outcome data (attrition bias) | Unclear risk | Only as a result of pregnancy (13 from metformin group, 4 from no metformin) |
| Selective reporting (reporting bias) | Unclear risk | Insufficient information in the study |
| Other bias | Unclear risk | The inclusion criteria did not include previous response to CC. Overall, 65% of those receiving CC and placebo ovulated (compared to 85% of those receiving CC and metformin). |
| Methods | RCT Setting: UK Method of randomisation: computer‐generated randomisation by pharmacy in blocks of 4 Blinding: double‐blind Number randomised: 94 | |
| Participants | Summary: obese PCOS Inclusion criteria: PCOS (oligomenorrhoea < 8 cycles/year, exclusion of other endocrinopathy, US finding of PCO) Exclusion criteria: diabetes mellitus, adrenal hyperplasia, thyroid dysfunction, hyperprolactinaemia, medication likely to influence hormonal profiles Baseline characteristics of each group:
Dropouts: 30 (32%), with 22 in the treatment arm and 8 in the placebo, mainly due to gastrointestinal side effects in metformin group. Overall, 58% of the metformin arm completing the trial and 83% of the placebo arm. Included in ITT analysis | |
| Interventions | Main intervention: 1 of metformin 850 mg 2/d, placebo Duration: 12‐16 weeks Co‐interventions: 1st week of treatment at 850 mg 1/d | |
| Outcomes | Ovulation: by twice‐weekly serum oestradiol. Where oestradiol > 300 pmol/L, LH and progesterone (> 8 nmol/L in ≥ 2 successive samples defined ovulation*) were determined Anthropometric: BMI, WHR Reproductive hormones: total testosterone, free testosterone, androstenedione, estradiol, SHBG, FSH, LH Metabolic markers: fasting glucose, fasting insulin, AUC insulin during GTT, leptin, inhibin‐B, cholesterol (HDL, LDL, VLDL), triglycerides Others: ovarian US, pregnancy, adverse effects | |
| Notes | Diagnostic criteria different to other trials ‐ using US not hyperandrogaenemia (although 90% did have raised androgens, and mean entry‐FAI 10 with 5% CI 8.6). Subgroup analysis showed that those who ovulated in response to metformin had significantly lower androgens. High rate of background ovulation (64% on placebo ovulated at some stage) *Information not in the original paper kindly provided by the study author | |
| Risk of bias | ||
| Bias | Authors' judgement | Support for judgement |
| Random sequence generation (selection bias) | Low risk | Computer‐generated randomisation by pharmacy in blocks of 4 |
| Allocation concealment (selection bias) | Low risk | Remote allocation. Identical metformin and placebo tablets. Randomisation code kept in the pharmacy department until the end of the trial |
| Blinding (performance bias and detection bias) | Low risk | Double‐blinded |
| Incomplete outcome data (attrition bias) | High risk | Dropouts: 30 (32%), with 22 in the treatment arm and 8 in the placebo, mainly due to gastrointestinal side effects in metformin group. Overall, 58% of the metformin arm completed the trial and 83% of the placebo arm. |
| Selective reporting (reporting bias) | Unclear risk | Insufficient information in the study |
| Other bias | Unclear risk | Inadequate information |
| Methods | RCT Setting: Italy Method of randomisation: computer‐generated random number table* Blinding: double Number randomised: 283 | |
| Participants | Summary: obese PCOS Inclusion criteria: PCO on USS, oligomenorrhoea (cycle length > 40 d or < 8 cycles/year) or amenorrhoea, clinical and biochemical hyperandrogenism Baseline characteristics of each group:
Dropouts: significantly more women withdrew in the treatment group (n = 15) compared with the placebo group (n = 5). Reasons not given | |
| Interventions | Main intervention: inositol 100 mg or placebo tablet twice daily Duration: 16 weeks Co‐interventions: none | |
| Outcomes | Ovulation: progesterone > 6 nmol/L Anthropometric: BMI, WHR* Hormones: Metabolic markers: insulin, glucose, AUC insulin, leptin, VLDL, LDL, HDL, triglyceride* Others: menstrual pattern, pregnancy* | |
| Notes | This is the largest study published so far on the effects of inositol on ovarian function and metabolic factors in women with PCOS. Women were recruited from gynaecology, endocrine and infertility outpatient clinics in the study centre. Nearly half of the participants presented with history of infertility. However, only 42 women declared a wish to conceive before the start of the trial. Therefore, it would be difficult to interpret the pregnancy rate accurately.
*No further information from the study author | |
| Risk of bias | ||
| Bias | Authors' judgement | Support for judgement |
| Random sequence generation (selection bias) | Low risk | Computer‐generated random number table |
| Allocation concealment (selection bias) | Unclear risk | Not stated |
| Blinding (performance bias and detection bias) | Unclear risk | Not stated |
| Incomplete outcome data (attrition bias) | High risk | Dropouts: significantly more women withdrew in the treatment group (n = 15) compared with the placebo group (n = 5). Reasons not given |
| Selective reporting (reporting bias) | Unclear risk | Insufficient information in the study |
| Other bias | Unclear risk | Inadequate information |
| Methods | RCT Setting: Denmark Method of randomisation: computer‐generated numbers. Randomisation was conducted in the local pharmacist. The code was kept in the pharmacist department until the end of the trial* Blinding: double* Number randomised: 30 | |
| Participants | Summary: obese PCOS Inclusion criteria: oligomenorrhoea (cycle length > 35 days), free testosterone > 0.035 nmol/L or clinical evidence of hirsutism Fasting insulin level > 50 pmol/L and/or BMI > 30 Normal TFT and prolactin levels Exclusion criteria: diabetes, hypertension, renal dysfunction, heart disease or abnormal liver function tests Baseline characteristics of each group:
Dropouts: 2 in total. 1 in the placebo group due to pregnancy. Another subject in the treatment group experienced side effects from pioglitazone (ankle oedema, anxiety, dizziness). No serious side effects were reported in this study and all women had normal liver function tests at the end of the trial. | |
| Interventions | Main intervention: pioglitazone 30 mg or placebo once daily Duration: 16 weeks Co‐interventions: | |
| Outcomes | Anthropometric: BMI, WHR, waist circumference Hormones: testosterone, SHBG, free testosterone Metabolic markers: fasting insulin Others: menstrual pattern, hirsutism | |
| Notes | The main objective of this study was to investigate the effect of pioglitazone on growth hormone levels in women with PCOS. The secondary endpoint measures included changes in anthropometric and hormonal parameters. The participants were recruited from the local endocrine and infertility clinics. All the women were instructed to use barrier contraception combined with spermatocidal cream provided by the department throughout the trial period due to the potential risks in pregnancy. No serious side effects were reported. All participants had normal liver functions at the end of the trial period. *Information not in the original paper kindly provided by the study author | |
| Risk of bias | ||
| Bias | Authors' judgement | Support for judgement |
| Random sequence generation (selection bias) | Low risk | Computer‐generated numbers. Randomisation was conducted by the local pharmacist |
| Allocation concealment (selection bias) | Low risk | The code was kept in the pharmacist department until the end of the trial |
| Blinding (performance bias and detection bias) | Low risk | Double‐blinded |
| Incomplete outcome data (attrition bias) | Low risk | Dropouts: 2 in total, 1 in each group |
| Selective reporting (reporting bias) | Low risk | All primary measures reported |
| Other bias | Low risk | Primary objective investigated the effect of pioglitazone on growth hormone levels in women with PCOS. All women were instructed to use contraception |
| Methods | RCT Setting: USA Method of randomisation: computer‐generated random number, randomisation conducted by the pharmacy department* Blinding: double Number randomised: 38 | |
| Participants | Metformin vs placebo Inclusion criteria: PCOS (oligomenorrhoea with < 6 menses/year and evidence of hyperandrogenism), BMI > 25, normal TSH, prolactin and FSH concentrations No hormonal treatment within 2 months before the trial commenced. Exclusion criteria: adrenal disease Baseline characteristics of each group:
Dropouts: 3 (33.3%) in the metformin arm and 2 (22.2%)in the placebo arm at 24 months of the trial Lifestyle advice + metformin vs lifestyle advice alone Summary: PCOS, obese Inclusion criteria: PCOS (oligomenorrhoea with < 6 menses/year and evidence of hyperandrogenism), BMI > 25, normal TSH, prolactin and FSH concentrations No hormonal treatment within 2 months before the trial commenced Exclusion criteria: adrenal disease Baseline characteristics of each group:
Dropouts: 4 (44.4%) in the metformin/lifestyle arm and 2 (18.2%)in the placebo/lifestyle arm at 24 months of the trial | |
| Interventions | Main intervention: metformin 850 mg 2/d or placebo Duration: 24 months Co‐interventions: lifestyle modification programme to reduce calorie intake by 500‐1000 kcal/d. All women were provided with an individual, healthy, balanced meal plan. The lifestyle team consisted of a dietitian and exercise physiology. No lifestyle modification for the non‐obese group | |
| Outcomes | Anthropometric: weight, BMI, hirsutism Hormones: total testosterone, SHBG, FAI, AUC glucose, AUC insulin, fasting glucose, fasting insulin* Metabolic markers: Others: menstrual pattern* | |
| Notes | This trial was designed to investigate the combined effects of metformin and intensive lifestyle modification in overweight women with PCOS. The women were recruited through a direct advertisement, referral from physician and reproductive endocrinology outpatient clinic in the same study centre. The women were randomised into 4 groups (metformin alone, placebo alone, combined lifestyle changes and metformin, and lifestyle changes alone). We decided to separate the analysis into 2 groups; metformin versus placebo and combined lifestyle and metformin versus lifestyle We also decided to analyse the results for those who completed the trial at 24 weeks as there were too many dropouts at the end of the trial period at 48 weeks. *Information not in the original paper kindly provided by the study author | |
| Risk of bias | ||
| Bias | Authors' judgement | Support for judgement |
| Random sequence generation (selection bias) | Low risk | Computer‐generated random number |
| Allocation concealment (selection bias) | Low risk | Randomisation conducted by the pharmacy department |
| Blinding (performance bias and detection bias) | Low risk | Double. Drug and placebo packaged and labelled according to participant number by the pharmacy |
| Incomplete outcome data (attrition bias) | Low risk | Dropouts: 3 (33.3%) in the metformin arm and 2 (22.2%)in the placebo arm at 24 months of the trial. Further 4 (44.4%) in the metformin/lifestyle arm and 2 (18.2%) in the placebo/lifestyle arm at 24 months of the trial. Baseline characteristics between the subjects completed and the drop outs were similar |
| Selective reporting (reporting bias) | Low risk | Study protocol available. Pre‐specified outcome measures (ovulation and testosterone levels) were reported |
| Other bias | Low risk | |
| Methods | RCT Setting: Taiwan Method of randomisation: computer‐generated random numbers, block of 2 randomisation process* Blinding: no* Number randomised: 80 | |
| Participants | Summary: CC‐resistant PCOS CC resistance was defined as no follicular development after 2 cycles up to 150 mg CC treatment for 5 d Exclusion criteria: not mentioned Baseline characteristics of each group:
Dropouts: none | |
| Interventions | Main intervention: metformin 500 mg 3/d versus no treatment. Metformin was commenced on day 1 after induced menstruation followed by a 5‐d course of CC 150 mg treatment from day 13 of the cycle. When there was evidence of follicles > 12 mm in diameter 3 days after the last dose of CC, metformin was continued until the dominant follicles reached 20 mm. Intramuscular hCG 5000 IU was then administrated and the participants were instructed to have intercourse in the following 2 days Duration: 1 cycle Co‐interventions: CC 150 mg, hCG 5000 IU (Pregnyl; Organon, Holland) | |
| Outcomes | Ovulation: confirmed by USS and serum progesterone > 5 ng/mL on day 7 after hCG injection Anthropometric: Hormones: Metabolic markers: Others: pregnancy and miscarriage rates | |
| Notes | This study was to evaluate the effect of a short course of metformin as a co‐therapy in ovulation induction with CC 150 mg in women with PCOS who developed CC resistance in the previous treatment cycles. Compared with the other included studies, CC treatment was commenced at day 13 of the menstrual cycle rather than at early follicular phase. Intramuscular hCG (5000 IU) was used to trigger ovulation when a dominant follicle reached a diameter of 20 mm. The sequence of allocation was not concealed and this study was unblinded. Therefore, bias cannot be excluded. *Information not in the original paper kindly provided by the study author | |
| Risk of bias | ||
| Bias | Authors' judgement | Support for judgement |
| Random sequence generation (selection bias) | Low risk | Computer‐generated random numbers, block of 2 randomisation process* |
| Allocation concealment (selection bias) | High risk | The sequence of allocation was not concealed and this study was unblinded. |
| Blinding (performance bias and detection bias) | High risk | Not blinded |
| Incomplete outcome data (attrition bias) | Low risk | No dropouts |
| Selective reporting (reporting bias) | Unclear risk | Insufficient information in the study |
| Other bias | High risk | Using hCG injection triggering ovulation rather than natural ovulation |
| Methods | RCT Setting: Venezuela (63% white, 31% Hispanic, 4% Arabic, 2% South American Indian) Method of randomisation: sequentially numbered, identical containers of identical drugs* Blinding: double‐blind Number randomised: 48 | |
| Participants | Summary: obese PCOS, CC‐sensitive Inclusion criteria: PCOS (oligomenorrhoea ≤ 8 cycles/year, elevated free testosterone, exclusion of other endocrinopathy, ultrasonographic finding of PCO), ovulation with CC 150 mg (demonstrated by serum progesterone > 12.7 pmol/L and US) Exclusion criteria: adrenal hyperplasia, thyroid dysfunction, hyperprolactinaemia, diabetes mellitus, failure to ovulate with CC as described above, medication that could affect insulin sensitivity* Baseline characteristics of each group:
Dropouts: after randomisation, 8 (14%), 2 in metformin arm and 6 in placebo. Not included in analysis | |
| Interventions | Main intervention: 1 of metformin 500 mg 3/d, placebo Duration: 4‐5 weeks prior to CC, then for a further 19 d after commencing CC Co‐interventions: CC 150 mg for 5 d | |
| Outcomes | Ovulation: by serum progesterone > 12.7 pmol/L and US. Ovulation checked on 2 occasions on day 23: once after metformin/placebo cycle and once after subsequent metformin/placebo with CC. Anthropometric: BMI, WHR Reproductive hormones: total testosterone, free testosterone, androstenedione, DHEAS, 17‐beta estradiol, SHBG Metabolic markers: fasting glucose, fasting insulin, AUC insulin and glucose during GTT Others: glycodelin, IGFBP‐1, endometrial thickness, endometrial vascular penetration, resistance index of uterine spiral arteries | |
| Notes | Women that were given metformin and ovulated received an extra week's course of treatment when compared with the placebo group. High dropout rate between recruitment and randomisation (24%) as only those who ovulated with CC prior to randomisation were included. The primary outcome measures are not relevant to this review, but the other parameters reported are. It is assumed that the units quoted for testosterone are mmol/dL and not mmol/L. *Information not in the original paper kindly provided by the study author | |
| Risk of bias | ||
| Bias | Authors' judgement | Support for judgement |
| Random sequence generation (selection bias) | Unclear risk | Not stated |
| Allocation concealment (selection bias) | Low risk | Sequentially numbered, identical containers of identical drugs |
| Blinding (performance bias and detection bias) | Low risk | Double‐blind |
| Incomplete outcome data (attrition bias) | High risk | Dropouts: after randomisation, 8 (14%), 2 in metformin arm and 6 in placebo. Not included in analysis. Missing data not reported. High dropout rate between recruitment and randomisation (24%) as only those who ovulated with CC prior to randomisation were included. |
| Selective reporting (reporting bias) | Unclear risk | The primary outcome measures are not relevant to this review, but the other parameters such as ovulation reported are. |
| Other bias | Low risk | Women that were given metformin and ovulated received an extra week's course of treatment when compared with the placebo group. |
| Methods | RCT Setting: India (private hospital) Method of randomisation: envelopes prepared by a nurse "naive to this study" Blinding: double‐blind Number randomised: 105 | |
| Participants | Summary: Asian Indian women with "treatment naive" PCOS Exclusion criteria: any major systemic illness Baseline characteristics of each group: no significant difference in age (years), duration of infertility (years), BMI, Ferriman‐Galloway score, waist circumference, hip circumference. No significant difference in biochemical parameters, such as FSH, LH, TSH, prolactin, insulin, fasting blood glucose, insulin resistance and metabolic syndrome Dropouts: 24 (81 women completed the study) | |
| Interventions | Main intervention: 3 equal groups. Group 1: CC 50‐150 mg/d. Group 2: metformin 1700 mg/d. Group 3: CC plus metformin, doses as above) Duration: 6 months, or until pregnant, or until resistant to CC Co‐interventions: not applicable | |
| Outcomes | Primary: live birth rate Secondary: ovulation rate, pregnancy rate, early pregnancy loss rate | |
| Notes | We have contacted the study authors for further information regarding methodology | |
| Risk of bias | ||
| Bias | Authors' judgement | Support for judgement |
| Random sequence generation (selection bias) | Unclear risk | Method of generating random sequence for distribution in envelopes not stated |
| Allocation concealment (selection bias) | Unclear risk | Allocation revealed in envelopes but not clear if opaque or sealed |
| Blinding (performance bias and detection bias) | Low risk | A member of staff separate to the investigators supplied the envelopes containing the allocation. |
| Incomplete outcome data (attrition bias) | High risk | 22.9% dropout rate, without reasons given Data analysis not performed as ITT |
| Selective reporting (reporting bias) | Unclear risk | Insufficient information in the study |
| Other bias | Low risk | None noted |
| Methods | RCT Setting: Iran Method of randomisation: computer‐generated sequences that was sealed in envelopes Blinding: double Number randomised: 200 | |
| Participants | Summary: non‐obese PCOS Inclusion criteria: Rotterdam criteria 2003 Exclusion criteria: hyperprolactinaemia, CSH, thyroid disease, Cushings syndrome, androgen‐secreting tumour Baseline characteristics of each group:
Dropouts: not mentioned | |
| Interventions | Main intervention: metformin 500 mg 3/d, placebo Duration: 3 months Co‐interventions: nil | |
| Outcomes | Ovulation: progesterone > 10 ng/mL Metabolic markers: cholesterol, triglycerides Others: pregnancy | |
| Notes | Women were recruited from a single centre. The primary objective of this study was to investigate the effect of metformin on lipid profile. The duration of the trial was relatively short. Therefore, it was difficult to ascertain the reliability on both of the ovulation rates and the improvement in menstrual patterns. | |
| Risk of bias | ||
| Bias | Authors' judgement | Support for judgement |
| Random sequence generation (selection bias) | Low risk | Computer‐generated sequences that were sealed in envelopes |
| Allocation concealment (selection bias) | Low risk | Sequences sealed in envelopes and code kept in the pharmacy department |
| Blinding (performance bias and detection bias) | Low risk | Double‐blinded |
| Incomplete outcome data (attrition bias) | Unclear risk | Not stated |
| Selective reporting (reporting bias) | Unclear risk | Insufficient information in the study |
| Other bias | Unclear risk | Inadequate information to assess other bias. Sample size calculation not mentioned. Unspecified recruitment period |
| Methods | RCT Setting: Iran Method of randomisation: not stated Blinding: not stated Number randomised: 343 | |
| Participants | Summary: non‐obese PCOS Inclusion criteria: Rotterdam criteria 2003. Age between 19 and 35, BMI 25‐29, primary infertility, normal prolactin levels, TFT, liver and renal functions Exclusion criteria: male factor infertility Baseline characteristics of each group:
Dropouts: none | |
| Interventions | Main intervention: metformin 500 mg 3/d, no placebo Duration: 3‐6 months Co‐interventions: CC 100 mg day 3‐7; lifestyle group were advised to increase daily exercise for 30 min along with high carbohydrate diet | |
| Outcomes | Ovulation: USS follicular tracking | |
| Notes | This study compared the effect of CC, metformin, combined CC and metformin, and lifestyle modification on subfertile women with PCOS. Very little information can be extracted from the study protocol. A large sample size without any dropouts Some of the women may have been included in the previous trial Karimzadeh 2007. No reply from study author | |
| Risk of bias | ||
| Bias | Authors' judgement | Support for judgement |
| Random sequence generation (selection bias) | Unclear risk | Inadequate information |
| Allocation concealment (selection bias) | Unclear risk | Inadequate information |
| Blinding (performance bias and detection bias) | Unclear risk | Inadequate information |
| Incomplete outcome data (attrition bias) | Unclear risk | Inadequate information |
| Selective reporting (reporting bias) | Low risk | Not all the primary outcome measures (endocrine parameters, lipid profile) data available |
| Other bias | Low risk | A large sample size without any dropouts Some of the women may have been included in the previous trial Karimzadeh 2007. No reply from study author |
| Methods | RCT Setting: USA Method of randomisation: picking a card out of a box Blinding: none Number randomised: 31 | |
| Participants | Summary: obese PCOS Inclusion criteria: oligomenorrhoea (< 8 cycles/year), PCO on USS, clinical (acne, hirsutism, alopecia) or biochemical hyperandrogenism (elevated testosterone level) BMI > 29 Exclusion criteria: pregnancy, hepatic or renal disease, heart disease, alcoholism, pulmonary disorder, abnormal TFT, hyperprolactinaemia, CAH or androgen‐secreting tumour Baseline characteristics of each group:
Dropouts: none | |
| Interventions | Main intervention: metformin 500 mg 3/d. Placebo was not used Duration: 2 weeks from the start of the menstrual cycle. 1 trial cycle only Co‐interventions: CC 100 mg for 5 d from day 5 of the cycle | |
| Outcomes | Ovulation: method to detect ovulation was not stated Hormones: free testosterone, testosterone, SHBG Metabolic markers: insulin, glucose | |
| Notes | This study was designed to evaluate the effect of a shot course of metformin treatment on the outcomes of CC ovulation induction therapy. All participants were Hispanic except 1 African American in the CC‐only group and 1 white woman in the combined group. None of the participants had taken CC before. The trial was unblinded. The method of randomisation and concealment were inadequate. Therefore, potential bias may have been introduced. | |
| Risk of bias | ||
| Bias | Authors' judgement | Support for judgement |
| Random sequence generation (selection bias) | Low risk | Picking a card out of a box |
| Allocation concealment (selection bias) | Unclear risk | Inadequate information |
| Blinding (performance bias and detection bias) | High risk | Unblinded |
| Incomplete outcome data (attrition bias) | Low risk | No missing data |
| Selective reporting (reporting bias) | Unclear risk | Insufficient information in the study |
| Other bias | Unclear risk | Insufficient information |
| Methods | RCT Setting: Hong Kong Method of randomisation: computer‐generated random number, block of 10 Blinding: double Number randomised: 70 | |
| Participants | Summary: non‐obese PCOS Inclusion criteria: Rotterdam criteria Exclusion criteria: CAH, Cushing's syndrome, endometrial hyperplasia, diabetes, cardiovascular, hepatic or renal disease Baseline characteristics of each group:
Dropouts: 11 in metformin, 5 in placebo | |
| Interventions | Main intervention: rosiglitazone 4 mg or placebo Duration: 6 months Co‐interventions: | |
| Outcomes | Menstrual cycle frequency Metabolic parameters: lipid profiles, testosterone, SHBG, glucose and insulin | |
| Notes | This study investigated the effect of using rosiglitazone on Chinese women with PCOS. It is unclear whether the subjects were infertile. | |
| Risk of bias | ||
| Bias | Authors' judgement | Support for judgement |
| Random sequence generation (selection bias) | Low risk | Computer‐generated random number |
| Allocation concealment (selection bias) | Low risk | Trial drug and placebo similar appearance, and packaged according to the trial number. The code kept in the local pharmaceutical company and concealed from the research team until the end of the trial. |
| Blinding (performance bias and detection bias) | Low risk | Double‐blind |
| Incomplete outcome data (attrition bias) | High risk | A much higher dropout rate in the rosiglitazone group than the placebo group. Missing data not reported |
| Selective reporting (reporting bias) | Low risk | A clear, detailed study protocol and all primary outcome measures reported |
| Other bias | Unclear risk | Inadequate information |
| Methods | RCT Setting: USA Method of randomisation: a large multi‐centre, randomised, placebo‐controlled study. (see Legro 2006b for detail) Blinding: double Number randomised: 626 | |
| Participants | Summary: obese PCOS Inclusion criteria: oligomenorrhoea (< 8 periods/year), biochemical hyperandrogenism (elevated testosterone level documented within the previous year on the basis of local laboratory results) Exclusion criteria: hyperprolactinaemia, CSH, thyroid disease, Cushings's syndrome, androgen‐secreting tumour Baseline characteristics of each group: Dropouts: 49 (23.7%) in the metformin and CC group, 55 (26.3%) in the placebo and CC group, 72 (34.6%) in the metformin group. The differences were not significant. | |
| Interventions | Main intervention: 2 extended‐release metformin 500 mg or 2 placebo tablets twice daily Duration: up to 6 cycles or 30 weeks Co‐interventions: CC 50 mg or second matching placebo tablet was commenced concurrently from day 3‐7 of the cycle. When women had no or poor response, the dose was increased by 50 mg or 1 additional placebo tablet with the maximum dose of 150 mg or 3 placebo tablets | |
| Outcomes | Ovulation: progesterone > 5 ng/mL Anthropometric: BMI, WHR Hormones: testosterone, SHBG Metabolic markers: insulin, proinsulin, glucose Others: pregnancy, live birth, miscarriage, side effects, serious adverse events in pregnancy | |
| Notes | This is the largest RCT published so far on the effects of metformin on women with PCOS. A total of 626 infertile women with PCOS were randomised into 3 groups (metformin and placebo, metformin and CC, CC and placebo). The sample size calculation was based on the live birth rates. The secondary outcomes included the rate of pregnancy loss, singleton birth and ovulation. Based on the initial sample size calculation, 678 was needed to detect a 15% absolute difference in live birth rates with a power of 80% and a type I error of 0.05. Due to limitations in the supplying metformin and the matching placebo tablets, the number of required women was reduced to 626. This was approved after the assessment by the data safety and monitoring board. Because the observed live birth rate was lower than projected, the number of recruited participants (626) was sufficient to detect a 15% difference with the same magnitude of power and type I error. The backgrounds of the participants were relatively heterogeneous. Two‐thirds of the participants were white and about one‐third was Hispanic or Latino origin. Only 40% of the women had no previous exposure to metformin or CC. Ovulation was confirmed when 2 consecutive measurements of progesterone levels > 5 ng/mL in 1‐2 weeks apart. US monitoring of ovarian response was not included in the study protocol. Ovulation triggering with hCG and intrauterine insemination were not employed in this study. Metformin combined with CC did not achieve a better live birth rate compared with CC therapy. The metformin group was found to have a significantly inferior pregnancy and live‐birth rate compared with the combined therapy (metformin and CC) and the CC groups. This study also demonstrated that BMI poses a significant negative impact on live births. In this most recent update, ITT analysis was used to determine ovulation rate per woman. This was calculated from the first 3 treatment cycles, taking into account the number of women who became pregnant. | |
| Risk of bias | ||
| Bias | Authors' judgement | Support for judgement |
| Random sequence generation (selection bias) | Low risk | Computer‐generated; participants were randomised by means of an interactive voice system and stratified based on study site and previous exposure to study drugs |
| Allocation concealment (selection bias) | Low risk | Each participant received a medication package on a monthly basis that consisted of a bottle M (metformin or placebo) and a bottle C (CC or placebo). Data co‐ordinating centre at the clinical research institute Legro 2006b |
| Blinding (performance bias and detection bias) | Low risk | Double‐blind |
| Incomplete outcome data (attrition bias) | Low risk | Dropouts: 49 (23.7%) in the metformin and CC group, 55 (26.3%) in the placebo and CC group, 72 (34.6%) in the metformin group. A much higher dropout rate at the metformin‐only group. The differences were not significant. Characteristics of the subjects who dropped out were not given. |
| Selective reporting (reporting bias) | Low risk | All primary and secondary outcome measures reported |
| Other bias | High risk | The original sample size was 678 to detect a 15% absolute difference in live birth rates. However, due to drug supply logistics, the sample size later reduced to 626 after the data safety and monitoring board review. |
| Methods | RCT Setting: UK Method of randomisation: randomisation was conducted centrally by computer at the hospital pharmacy department using a block with sequential numbers. The code was kept sealed until the trial was completed.* Blinding: double Number randomised: 44 | |
| Participants | Summary: obese PCOS Inclusion criteria: oligomenorrhoea (< 6 periods/year), biochemical hyperandrogenism (FAI > 5.0) Exclusion criteria: diabetes, thyroid disease, hyperprolactinaemia, CAH, the use of ovulation‐induction agents or drugs that could affect insulin metabolism within 2 months before the start of the trial Baseline characteristics of each group:
Dropouts: 3 women in the metformin group and 1 in the placebo were excluded after they were assigned to the group (did not meet the inclusion criteria). Furthermore, 3 (2 due to pregnancy and 1 lost to follow‐up) in the metformin arm and 5 (3 due to pregnancy and 2 lost to follow‐up) in the placebo arm did not complete the study. | |
| Interventions | Main intervention: metformin 500 mg or placebo tablet 3/d Duration: 12 weeks Co‐interventions: general advice on diet and exercise | |
| Outcomes | Ovulation: progesterone > 30 nmol/L Anthropometric: the distributions of subcutaneous and visceral fat were measured by areal planimetry (CT scan), weight, BMI, waist circumference, WHR, BP Hormones: testosterone, SHBG, DHEAS Metabolic markers: insulin, glucose, LDL, HDL, triglyceride Others: menstrual pattern, pregnancy | |
| Notes | This study was to ascertain the effects of metformin on metabolic parameters, visceral and subcutaneous fat distributions in women with PCOS. The fat distribution was measured with areal planimetry (CT scan). There were no significant changes in any of the measures of fat distribution between the metformin and the placebo groups. Although, metformin significantly reduced serum cholesterol concentrations, treatment effects on androgens, insulin, triglycerides, ovulation and pregnancy were not observed. *Information not in the original paper kindly provided by the study author | |
| Risk of bias | ||
| Bias | Authors' judgement | Support for judgement |
| Random sequence generation (selection bias) | Low risk | Randomisation was conducted centrally by computer at the hospital pharmacy department using a block with sequential numbers. |
| Allocation concealment (selection bias) | Low risk | The code was kept sealed until the trial was completed. |
| Blinding (performance bias and detection bias) | Low risk | Double‐blinded |
| Incomplete outcome data (attrition bias) | Unclear risk | Overall, 6 (27.2%) in the metformin group and 6 (27.2%) in the placebo group withdrew from the study after they had been randomised. Details of dropouts were not provided |
| Selective reporting (reporting bias) | Low risk | All outcome measures reported |
| Other bias | Unclear risk | Inadequate information |
| Methods | RCT Setting: Brazil Method of randomisation: numbered, sealed, opaque envelopes Number randomised: 36 | |
| Participants | Summary: CC‐resistant PCOS Inclusion criteria: oligomenorrhoea or amenorrhoea, Rotterdam criteria for PCOS, lack of response to previous ovulation induction with CC Exclusion criteria: male factor and tubal infertility, endocrinology and chronic health conditions, the use of hormonal treatments within 60 days of the trial commencing Baseline characteristics of each group: placebo, metformin
Dropouts*: 67 women were initially included in the study. 21 women did not respond to CC alone and 13 became pregnant. 36 women were then randomised to receive metformin or placebo. All 36 women completed the study, with no women dropping out | |
| Interventions | Main intervention: metformin 850 mg 2/d or placebo tablet 2/d Duration: 60 days Co‐interventions: CC 100 mg day 5‐9 with concurrent use of metformin or placebo | |
| Outcomes | Ovulation: visible follicular growth on USS with subsequent formation of the corpus luteum. Free fluid in the POD and change of endometrial thickness also. Plasma progesterone > 3000 pg/mL on day 21 Anthropometric: BMI, WHR Metabolic markers: insulin, glucose, glucose‐insulin ratio, LFTs, creatinine Others: pregnancy rate | |
| Notes | This study aimed to evaluate the efficacy of metformin with CC on ovulation in women previously resistant to CC alone. We did not perform a subgroup analysis by BMI in our analysis due to the small number of women in the study. *Additional information was provided by the study author on request. | |
| Risk of bias | ||
| Bias | Authors' judgement | Support for judgement |
| Random sequence generation (selection bias) | Low risk | Numbered envelopes used |
| Allocation concealment (selection bias) | Low risk | Sealed, opaque envelopes used |
| Blinding (performance bias and detection bias) | Low risk | The author has confirmed in private correspondence that women and healthcare providers were blinded for the duration of the study. |
| Incomplete outcome data (attrition bias) | Low risk | Data were available for all 36 women who participated in the study. |
| Selective reporting (reporting bias) | Unclear risk | Insufficient information in the study |
| Other bias | Low risk | No other potential bias detected |
| Methods | RCT Setting: Brazil Method of randomisation: computer‐generated random numbers Blinding: double Number randomised: 30 | |
| Participants | Summary: non‐obese PCOS Inclusion criteria: amenorrhoea or oligomenorrhoea (< 6 periods/year), clinical or biochemical hyperandrogenism. USS evident of PCO was not part of the diagnostic criteria. Exclusion criteria: other causes of amenorrhoea. Use of lipid‐lowering drugs, antidiabetic medications or hormonal contraception within 3 months of the recruitment; Cushing's syndrome, CAH, androgen‐secreting tumours, diabetes, renal or hepatic disease Baseline characteristics of each group:
Dropouts: details of the dropouts were not available Summary: obese PCOS Inclusion criteria: amenorrhoea or oligomenorrhoea (< 6 periods/year), clinical or biochemical hyperandrogenism. USS evident of PCO was not part of the diagnostic criteria. Age between 17‐32 years Exclusion criteria: other causes of amenorrhoea. Use of lipid‐lowering drugs, antidiabetic medications or hormonal contraception within 3 months of the recruitment; Cushing’s syndrome, CAH, androgen‐secreting tumours, diabetes, renal or hepatic disease. Baseline characteristics of each group: Mean age (SD) 20.5 (5.4), 21.1 (1.7) Mean BMI (SD) 37.2 (4.8), 35.8 (3.7) Mean fasting insulin mIU/L (SD) 22.6 (11.6) 20.9 (4.6) Mean total testosterone nmol/L (SD) 4.1 (0.8), 3.5 (2.4)) Dropouts: details of the dropouts were not available | |
| Interventions | Main intervention: metformin 500 mg or placebo tablet 3/d Duration: 6 months Co‐interventions: none | |
| Outcomes | Anthropometric: BMI, BP Hormones: testosterone, SHBG, free testosterone, androstenedione Metabolic markers: insulin, glucose, AUC insulin, AUC glucose, LDL, HDL and triglyceride Others: menstrual pattern, hirsutism | |
| Notes | The primary objective of this study was to compare the clinical, hormonal and biochemical effects of metformin therapy in the obese PCOS group (BMI > 30) with the non‐obese group (BMI < 30). We entered the results of the obese group separately in the analysis. The results indicated that non‐obese participants responded better than obese participants with PCOS to metformin 1.5 g/d. Non‐obese women experienced an improvement in menstrual cyclicity, decrease in serum androgen levels and fasting insulin concentrations; whilst, obese women showed a significant reduction of free testosterone levels. Caution is needed to interpret the results as 5 of the original 34 enrolled participants did not complete the trial and these findings were not included in the analysis. | |
| Risk of bias | ||
| Bias | Authors' judgement | Support for judgement |
| Random sequence generation (selection bias) | Low risk | Computer‐generated random numbers |
| Allocation concealment (selection bias) | Low risk | Participants received a sealed envelope that contained the study number. An independent clinician recorded side effects and clinical measurements |
| Blinding (performance bias and detection bias) | Low risk | Double‐blinded |
| Incomplete outcome data (attrition bias) | Low risk | 5 participants were not evaluated because of pregnancy. Details were not given |
| Selective reporting (reporting bias) | Unclear risk | All pre‐specified outcome measures (androgens and metabolic parameters) |
| Other bias | Unclear risk | Although USS evidence of PCO was not employed as part of the diagnostic criteria for PCOS, the diagnostic criteria used in this study would have met the Rotterdam criteria. |
| Methods | RCT Setting: Jordan Method of randomisation: centralised randomisation process with women receiving a sequential number* Blinding: double‐blind* Number randomised: 28 | |
| Participants | Summary: non‐obese PCOS, CC resistance Inclusion criteria: US findings of polycystic ovaries together with 3 of: oligomenorrhoea < 6 cycles in preceding year, Ferriman‐Gallwey score > 7, hyperandrogaenemia (free testosterone, androstenedione, DHEAS), elevated LH or LH:FSH > 2 CC resistance defined as failure to ovulate with 150 mg day 5‐9 for 3 months. Normal uterine cavity and patent tubes on hysterosalpingography. Normal semen analysis Exclusion criteria: raised prolactin, adrenal hyperplasia, thyroid dysfunction, Cushing's syndrome. Baseline characteristics of each group:
Dropouts: nil | |
| Interventions | Main intervention: 1 of metformin 850 mg 2/d, placebo Duration: 6 months Co‐interventions: CC 50 mg day 5‐9 in the first cycle, increasing by 50 mg up to 200 mg in each subsequent cycle until ovulation achieved | |
| Outcomes | Ovulation: serum progesterone on day 21 and 28 > 15.9 nmol/L Others: pregnancy | |
| Notes | Units of testosterone assumed to be ng/mL *Information kindly provided by the study author that was not in the original paper | |
| Risk of bias | ||
| Bias | Authors' judgement | Support for judgement |
| Random sequence generation (selection bias) | Unclear risk | Centralised randomisation process with women receiving a sequential number |
| Allocation concealment (selection bias) | Unclear risk | Centralised randomisation process with women receiving a sequential number |
| Blinding (performance bias and detection bias) | Unclear risk | Inadequate information |
| Incomplete outcome data (attrition bias) | Low risk | No dropouts |
| Selective reporting (reporting bias) | Unclear risk | Insufficient information in the study |
| Other bias | Unclear risk | Inadequate information |
| Methods | RCT Setting: Italy Method of randomisation: sequentially numbered, identical containers of identical drugs* Blinding: double‐blind Number randomised: 23 | |
| Participants | Summary: non‐obese PCOS Inclusion criteria: PCOS (oligomenorrhoea ≤ 6 cycles/year or anovulation confirmed with luteal‐phase progesterone, hyperandrogaenemia (either raised serum androgens, or clinical hyperandrogaenemia*). Exclusion of other endocrinopathy Exclusion criteria: adrenal hyperplasia, Cushing's syndrome, thyroid dysfunction, hyperprolactinaemia, androgen‐secreting tumour, Baseline characteristics of each group:
Dropouts: nil* | |
| Interventions | Main intervention: 1 of metformin 500 mg 3/d, placebo Duration: 26 weeks Co‐interventions: no modification in usual eating habits | |
| Outcomes | Anthropometric: BMI, WHR, Reproductive hormones: free testosterone, androstenedione, DHEAS, SHBG, FSH, LH Metabolic markers: fasting glucose, fasting insulin, 120‐min insulin and glucose levels after GTT, insulin sensitivity, HDL, LDL, triglycerides, systolic BP, diastolic BP Others: menstrual pattern, 17‐alpha‐hydroxyprogesterone response to buserelin | |
| Notes | Placebo group had significantly higher BMI (P < 0.05) at baseline and higher fasting insulin (non‐significant), but similar insulin sensitivity. Metformin group had higher androgens (non‐significant) Mild side effects in 5 in metformin group and 2 in placebo group It is assumed that the figures quoted in the publication are for standard errors. *Information kindly provided by the study author that was not in the original paper | |
| Risk of bias | ||
| Bias | Authors' judgement | Support for judgement |
| Random sequence generation (selection bias) | Unclear risk | Not stated |
| Allocation concealment (selection bias) | Low risk | Sequentially numbered, identical containers of identical drugs |
| Blinding (performance bias and detection bias) | Low risk | Double‐blind |
| Incomplete outcome data (attrition bias) | Low risk | No dropouts |
| Selective reporting (reporting bias) | Low risk | All primary outcome measures reported (menstrual frequency and metabolic parameters) |
| Other bias | High risk | Placebo group had a significantly higher BMI than the metformin group. It was assumed that the figures quoted in the publication are for standard errors. |
| Methods | Multicentre RCT Setting: the Netherlands Method of randomisation: computer‐generated blocks of 4 Blinding: double‐blind Number randomised: 225 | |
| Participants | Summary: non‐obese women with PCOS Inclusion criteria: PCOS (according to Rotterdam consensus), normal FSH concentrations Exclusion criteria: age > 40 years, abnormal liver function tests or creatinine levels > 95 umol/L, history of heart disease, history of male factor infertility with total motile sperm count < 10 x 106 Baseline characteristics of each group:
Dropouts: no significant difference in the dropout rates, 28 (25%) in the metformin arm, 21 (18%) in the placebo arm | |
| Interventions | Main intervention: metformin 2000 mg/d (increased from 500 mg to 2000 mg over a period of 7 days in order to limit the side effects) or placebo Duration: all women received metformin or placebo for 1 month before starting CC treatment (a maximum of 6 cycles for those who ovulated with CC) Co‐interventions: CC 50 mg from day 3 (spontaneous menstruation) or day 5 (progestogen induced menstruation) for a period of 5 days. If ovulation did not occur with this dose, CC was increased with steps of 50 mg with a maximum of 150 mg/d in the next cycles | |
| Outcomes | Ovulation: progesterone > 14 nmol/L in the second half of menstrual cycle, biphasic basal body temperature curve, follicular diameter > 16 mm on transvaginal USS or pregnancy Anthropometric: Hormones: Metabolic markers: Others: pregnancy, miscarriage and CC resistance | |
| Notes | A large, multicentre RCT. The sample size calculation was based on the ovulation rate. In total, 228 women were initially screened and 3 were subsequently excluded. 111 women were randomised to receive metformin and CC; whilst 114 received placebo and CC. | |
| Risk of bias | ||
| Bias | Authors' judgement | Support for judgement |
| Random sequence generation (selection bias) | Low risk | Computer‐generated blocks of 4 |
| Allocation concealment (selection bias) | Low risk | Randomisation was carried out in the co‐ordinating centre (Amsterdam) and the list was kept until inclusion was completed |
| Blinding (performance bias and detection bias) | Low risk | Double blind. Each centre received blinded, numbered container |
| Incomplete outcome data (attrition bias) | Unclear risk | Dropouts: no significant difference in the dropout rates, 28 (25%) in the metformin arm, 21 (18%) in the placebo arm. Details of the dropout participants not mentioned; although number of dropouts in each group were similar |
| Selective reporting (reporting bias) | Low risk | Primary outcome (ovulation) and secondary outcome (pregnancy, miscarriage rates) measures reported |
| Other bias | Unclear risk | Inadequate information |
| Methods | Multicentre RCT (parallel‐group study) Setting: Finland Method of randomisation: randomisation codes remained concealed. Metformin and placebo identically packaged and consecutively numbered Blinding: double Number randomised: 320 | |
| Participants | Summary: metformin and pregnancy outcomes in PCOS Inclusion criteria: anovulatory infertility for at least 6 months and 3 months since the last infertility treatment. Age range 18‐39 years Exclusion criteria: type 1 diabetes mellitus, liver, cardiac or renal disease, hormone medication, alcohol use, regular smoking Baseline characteristics of each group: Metformin, placebo
Dropouts: 61 women were lost to follow‐up or discontinued but their data were included in the ITT analysis | |
| Interventions | Main intervention: metformin 500 mg 1/d for 1 week, then increased weekly by 1 extra tablet/d to 1.5 g in non‐obese and 2 g/d in obese women versus placebo Duration: 3‐9 months Co‐interventions: if pregnancy has not occurred by 3 months, ovulation induction was started with CC. If unsuccessful after 4‐6 cycles, gonadotrophins or aromatase inhibitors were used | |
| Outcomes | Anthropometric: WHR, waist (cm), hirsutism score, BMI, ovarian volume Others: pregnancy rate, miscarriage rate, pregnancy complications, live birth rate | |
| Notes | This study was to ascertain the effects of metformin on pregnancy and live birth rates. Endocrine/metabolic outcomes not measured. Additional information sought from the study authors | |
| Risk of bias | ||
| Bias | Authors' judgement | Support for judgement |
| Random sequence generation (selection bias) | Low risk | Performed by hospital pharmacy with 1:1 allocation in random blocks of 10 using computer‐generated lists |
| Allocation concealment (selection bias) | Low risk | Randomisation codes remained blinded until database lock had taken place |
| Blinding (performance bias and detection bias) | Low risk | Metformin and placebo identically packaged and consecutively numbered |
| Incomplete outcome data (attrition bias) | Low risk | 61 women were lost to follow‐up or discontinued but their data were included in the ITT analysis |
| Selective reporting (reporting bias) | Unclear risk | Insufficient information in the study |
| Other bias | Unclear risk | Unclear |
| Methods | Multicentre RCT Setting: USA (3 participants), Venezuela (54 participants), Italy (4 participants)* Method of randomisation: centralised randomisation process*. Blinding: single‐blind, participants blinded Number randomised: 61 | |
| Participants | Summary: PCOS, obese Inclusion criteria: PCOS (oligomenorrhoea < 6 cycles/year, hyperandrogaenemia (elevated free testosterone), exclusion of other endocrinopathy, US finding of PCO), BMI >28 Exclusion criteria: diabetes mellitus, adrenal hyperplasia, thyroid dysfunction, hyperprolactinaemia, taking any medication for previous 2 months Baseline characteristics of each group:
Dropouts: none | |
| Interventions | Main intervention: 1 of metformin 500 mg 3/d, placebo Duration: 34 d, then those who did not ovulate continued for a further 19 d Co‐interventions: those that did not ovulate after 34 days had CC 50 mg for 5 d and continued metformin/placebo for a total of 53 d | |
| Outcomes | Ovulation: by serum progesterone (≥ 25.6 nmol/L) measured on days 14, 28, 35 (and 44 & 53 in those that went on to receive CC) Anthropometric: BMI, WHR Reproductive hormones: total testosterone, free testosterone, androstenedione, DHEAS, SHBG, 17‐beta estradiol Metabolic markers: fasting glucose, fasting insulin, AUC of insulin and glucose during GTT | |
| Notes | 89% of participants were recruited in Venezuela Most of the outcome measures were only reported for those that failed to ovulate during the metformin vs placebo phase of the trial. These have not been included in the analysis as a further analysis to include all participants was not possible. *Information not in the original paper kindly provided by the study author | |
| Risk of bias | ||
| Bias | Authors' judgement | Support for judgement |
| Random sequence generation (selection bias) | Unclear risk | Centralised randomisation process |
| Allocation concealment (selection bias) | Unclear risk | Inadequate information |
| Blinding (performance bias and detection bias) | High risk | Single‐blinded (participant only) |
| Incomplete outcome data (attrition bias) | High risk | No dropouts. Most of the outcome measures were only reported for those that failed to ovulate during the metformin vs placebo phase of the trial. |
| Selective reporting (reporting bias) | Unclear risk | Insufficient information in the study |
| Other bias | Unclear risk | Inadequate information |
| Methods | Multicentre RCT Setting: Venezuela (white 73%, Hispanic 16%, Afro‐Hispanic 4.5%, Arabic 4.5%, Asian 2%) Method of randomisation: drug and placebo packaged at same time and labelled according to participant number. Randomisation in blocks of 4 Number randomised: 44 | |
| Participants | Summary: PCOS, obese Inclusion criteria: PCOS (oligomenorrhoea ≤ 8 cycles/year, hyperandrogaenemia (elevated free testosterone)* or hirsutism (physician reported ‐ subjective)*, exclusion of other endocrinopathy), BMI > 28 Exclusion criteria: diabetes mellitus, thyroid dysfunction, hyperprolactinaemia, taking any medication for previous 2 months. Baseline characteristics of each group:
Dropouts: none | |
| Interventions | Main intervention: 1 of D‐chiro inositol 1200 mg 1/d, placebo Duration: 6 weeks; those who ovulated continued for a further 2 weeks | |
| Outcomes | Ovulation: by serum progesterone (≥ 25 nmol/L) weekly Anthropometric: BMI, WHR Reproductive hormones: total testosterone, free testosterone, androstenedione, DHEAS, SHBG, 17‐beta estradiol Metabolic markers: fasting glucose, fasting insulin, AUC of insulin and glucose during GTT, systolic BP, diastolic BP, HDL, LDL, triglycerides Others: LH response to leuprolide, 17‐alpha‐hydroxyprogesterone response to leuprolide | |
| Notes | All women had US features of PCO, but this was not an inclusion criteria None of the participants had diabetes mellitus, but 10 (23%) had impaired glucose tolerance (6 in treatment arm, 4 in placebo arm) | |
| Risk of bias | ||
| Bias | Authors' judgement | Support for judgement |
| Random sequence generation (selection bias) | Unclear risk | Randomisation in blocks of 4 |
| Allocation concealment (selection bias) | Low risk | Drug and placebo packaged at same time and labelled according to participant number |
| Blinding (performance bias and detection bias) | Low risk | Double‐blind |
| Incomplete outcome data (attrition bias) | Low risk | No dropouts |
| Selective reporting (reporting bias) | Unclear risk | Insufficient information in the study |
| Other bias | Unclear risk | Insufficient information |
| Methods | RCT Setting: Hong Kong (Chinese women) Method of randomisation: computer‐generated list in sealed envelopes Blinding: double‐blind Number randomised: 20 | |
| Participants | Summary: non‐obese PCOS, CC resistance Inclusion criteria: PCOS (irregular cycles of ≤ 21 days or ≥ 35 days and cycle‐to‐cycle variation of > 4 days*, anovulation with mid‐luteal progesterone < 16 nmol/L whilst taking CC 100 mg for 5 d over 3 cycles, exclusion of other endocrinopathy (raised prolactin, thyroid disorder*), US findings of PCO, age < 40, day 2 FSH < 10, bilateral patent tubes demonstrated by laparoscopy, normal semen parameters Exclusion criteria: taking any sex hormones in previous 3 months, smokers, renal impairment. Baseline characteristics of each group*:
Dropouts: 5 (25%), 3 in placebo arm, 2 in metformin. Analysis on ITT | |
| Interventions | Main intervention: 1 of metformin 500 mg 3/d, placebo Duration: 3 months. Those who did not ovulate continued for a further cycle Co‐interventions: CC 100 mg for 5 d was given after 3 months if there was no ovulation | |
| Outcomes | Ovulation: by serum progesterone (> 16 nmol/L) weekly Anthropometric: BMI Reproductive hormones: total testosterone, androstenedione, DHEA, SHBG, FSH, LH Metabolic markers: fasting glucose, fasting insulin, 120‐min glucose levels after GTT, fasting leptin, HDL, LDL, triglycerides Other: live birth | |
| Notes | The BMI was lower than in other trials In spite of the fact that anovulation and CC resistance was an inclusion criteria, 7 out of 9 women taking placebo ovulated (3 with placebo alone, and 4 out of the 6 remaining in the trial who had CC and placebo) *Information not in the original paper kindly provided by the study author | |
| Risk of bias | ||
| Bias | Authors' judgement | Support for judgement |
| Random sequence generation (selection bias) | Low risk | Computer‐generated list |
| Allocation concealment (selection bias) | Low risk | In sealed envelopes. Double, identical appearance and packed by the hospital pharmacy. Code kept in the pharmacy department until the end of the trial |
| Blinding (performance bias and detection bias) | Low risk | Double‐blind |
| Incomplete outcome data (attrition bias) | Unclear risk | Dropouts: 5 (25%), 3 in placebo arm, 2 in metformin. Analysis on ITT. Details not provided |
| Selective reporting (reporting bias) | Low risk | All primary outcome measures reported |
| Other bias | Unclear risk | In spite of the fact that anovulation and CC resistance was an inclusion criteria, 7 out of 9 women taking placebo ovulated (3 with placebo alone, and 4 out of the 6 remaining in the trial who had CC and placebo) |
| Methods | RCT Setting: Turkey Method of randomisation: computer‐generated randomisation in blocks of 4 Blinding: double* Number randomised: 139 were randomised into 6 main groups according to the fasting glucose/insulin ratio (with a level < 4.5 classified as hyperinsulinaemia) and BMI (< 25, 25‐29.9 and > 30) | |
| Participants | Summary: non‐obese PCOS Inclusion criteria: oligomenorrhoea (< 6 periods/year), clinical hyperandrogenism (Ferrriman‐Gallwey score > 7) and/or biochemical hyperandrogenism (free testosterone > 4 ng/dL) Exclusion criteria: other causes of hyperandrogenism, Cushing's syndrome, CAH, hyperprolactinaemia, thyroid dysfunction Baseline characteristics of each group:
Summary: obese PCOS Inclusion criteria: oligomenorrhoea (< 6 periods/year), clinical hyperandrogenism (Ferrriman‐Gallwey score > 7) and/or biochemical hyperandrogenism (free testosterone >4 ng/dL) Exclusion criteria: other causes of hyperandrogenism, Cushing's syndrome, CAH, hyperprolactinaemia, thyroid dysfunction Baseline characteristics of each group:
Dropouts: 15 in total, mainly due to gastro‐intestinal side effects. Further 8 women were excluded in the analysis because of pregnancy* Dropouts: 15 in total, mainly due to gastro‐intestinal side effects* | |
| Interventions | Main intervention: metformin 850 mg or placebo tablet twice daily Duration: 6 months Co‐interventions: none | |
| Outcomes | Ovulation: progesterone > 5 ng/mL Anthropometric: BMI, weight, WHR* Hormones: testosterone, free testosterone, androstenedione, DHEAS, cortisol* Metabolic markers: glucose, insulin, LDL, HDL, triglyceride* Others: hirsutism* | |
| Notes | The objective of this study was to investigate the effects of hyperinsulinaemia (fasting glucose/insulin ratio < 4.5mg/10‐4 U and obesity (BMI > 30) on the responses to metformin treatment in women with PCOS. There were 6 subgroups, normoinsulinaemic lean (BMI < 25), overweight (BMI 25‐29.9) and obese (BMI >30); hyperinsulinaemic lean (BMI < 25), overweight (BMI 25‐29.9) and obese (BMI > 30) The results of the non‐obese subgroups were entered separately from the obese subgroup in the meta‐analysis We have written to the study author regarding the details of randomisation and concealment. Additionally, we also asked the study author to provide further information of the anthropometric, hormonal and metabolic results at the end of the trial period. *No reply from study author | |
| Risk of bias | ||
| Bias | Authors' judgement | Support for judgement |
| Random sequence generation (selection bias) | Low risk | Computer‐generated blocks of 4 randomisation |
| Allocation concealment (selection bias) | Unclear risk | Not stated |
| Blinding (performance bias and detection bias) | Unclear risk | Inadequate information |
| Incomplete outcome data (attrition bias) | High risk | Dropouts: 15 in total (11%), mainly due to gastro‐intestinal side effects. Missing outcomes not addressed. Imbalance in missing data between the intervention and placebo groups. |
| Selective reporting (reporting bias) | Unclear risk | Primary outcome measures not stated. Inadequate study protocol reporting |
| Other bias | Unclear risk | Inadequate information to assess |
| Methods | RCT Setting: Argentina Method of randomisation: computer‐generated Blinding: double Number randomised: 30 | |
| Participants | Summary: obese PCOS Inclusion criteria: oligomenorrhoea (cycle length > 35 days), biochemical hyperandrogenism (level not defined) Exclusion criteria: other causes of hyperandrogenism, Cushing's syndrome, CAH, hyperprolactinaemia, thyroid dysfunction, abnormal renal, liver functions, diabetes, infection Baseline characteristics of each group:
Dropouts: 1 in metformin, poor compliance | |
| Interventions | Main intervention: metformin 750 mg or placebo tablet twice daily Duration: 4 months Co‐interventions: lifestyle modification (high carbohydrate diet and increase exercise with a minimum of 40 min walk/d) | |
| Outcomes | Ovulation: method of detecting ovulation not stated Anthropometric: BMI, weight, WHR Metabolic markers | |
| Notes | This study investigated the effects of combined metformin and lifestyle changes on endocrine and metabolic parameters in women with PCOS Methodology and study protocol were too brief. Unable to determine the quality of the trial Only 5 out of 30 subjects were trying to conceive. | |
| Risk of bias | ||
| Bias | Authors' judgement | Support for judgement |
| Random sequence generation (selection bias) | Low risk | Computer‐generated |
| Allocation concealment (selection bias) | Unclear risk | Not stated |
| Blinding (performance bias and detection bias) | Unclear risk | Not stated |
| Incomplete outcome data (attrition bias) | High risk | Missing data not reported. 1 in metformin group and excluded from analysis |
| Selective reporting (reporting bias) | Unclear risk | Primary outcome measures were unclear |
| Other bias | Low risk | Methodology and study protocol were too brief. Unable to determine the quality of the trial Only 5 out of 30 subjects were trying to conceive. |
| Methods | RCT Setting: Italy Method of randomisation: computer‐generated random allocation sequence in double block Blinding: double Number randomised: 100 | |
| Participants | Summary: non‐obese PCOS Inclusion criteria: National Institutes of Health criteria, age 20‐34 years, BMI < 30 kg/m2, tubal patency confirmed by hysterosalpingogram, normal semen analysis Exclusion criteria: metabolic disorders, hepatic or renal dysfunction, thyroid disease, hyperprolactinaemia, Cushing's syndrome, CAH, hormonal drugs, pelvic diseases, previous pelvic surgery Baseline characteristics of each group:
Dropouts: 5 in the metformin group and 3 in the metformin + CC group | |
| Interventions | Main intervention: metformin 850 mg or matched placebo tablets twice daily Duration: 6 months Co‐interventions: CC 150 mg or matched placebo tablets, day 3‐7 of the cycle and timed intercourse | |
| Outcomes | Ovulation: USS follicular tracking Pregnancy, ovulation | |
| Notes | This study was designed to compare the effectiveness of metformin and CC treatment as a first‐line therapy in non‐obese anovulatory women with PCOS. The primary end point measure was the pregnancy rate. | |
| Risk of bias | ||
| Bias | Authors' judgement | Support for judgement |
| Random sequence generation (selection bias) | Low risk | Computer‐generated random allocation sequence in double block |
| Allocation concealment (selection bias) | Unclear risk | Allocation sequence concealed until the interventions were assigned |
| Blinding (performance bias and detection bias) | Unclear risk | Inadequate information |
| Incomplete outcome data (attrition bias) | Low risk | Dropouts: 5 in the metformin group and 3 in the metformin + CC group |
| Selective reporting (reporting bias) | Unclear risk | Insufficient information in the study |
| Other bias | Unclear risk | Insufficient information |
| Methods | RCT Setting: Italy Method of randomisation: block of 4. Drug and placebo packaged and labelled according to participant number Blinding: double‐blind Number randomised: 20 | |
| Participants | Summary: obese PCOS Inclusion criteria: oligomenorrhoea (< 4 cycles in past 6 months), hyperandroenaemia, USS of PCO, BMI > 25, WHR > 0.8 Exclusion criteria: diabetes mellitus, adrenal hyperplasia, thyroid dysfunction, hyperprolactinaemia, cardiovascular, renal or liver dysfunction Baseline characteristics:
Dropouts: 2 from metformin arm due to pregnancy. Not included in analysis | |
| Interventions | Main intervention: metformin 850 mg 2/d or placebo Duration: 6 months Co‐interventions: standardised hypercaloric diet 1 month prior to treatment and continued throughout the trial | |
| Outcomes | Anthropometric parameters Reproductive hormones and metabolic markers | |
| Notes | The trial was designed to investigate the combined effects of diet and metformin on fat distribution in women with PCOS. The study also included a control group who were matched for age, weight and WHR but with regular menstrual cycles. | |
| Risk of bias | ||
| Bias | Authors' judgement | Support for judgement |
| Random sequence generation (selection bias) | Low risk | Block of 4, random table |
| Allocation concealment (selection bias) | Low risk | Drug and placebo packaged and labelled according to participant number |
| Blinding (performance bias and detection bias) | Low risk | Double‐blinded |
| Incomplete outcome data (attrition bias) | High risk | Missing data not reported |
| Selective reporting (reporting bias) | Low risk | A clear protocol published with all primary outcome measured reported |
| Other bias | Unclear risk | Inadequate information |
| Methods | Multicentre RCT Setting: New Zealand Randomisation: double‐blind Number randomised: 171 | |
| Participants | Inclusion criteria: women with PCOS according to Rotterdam consensus criteria Exclusion criteria: couples had undergone previous fertility treatment involving > 5 months treatment with CC or metformin; tubal factor (at least 1 tube blocked); severe male factor (< 15 mil/mL); important medical disorders | |
| Interventions | Women with BMI > 32 kg/m2 were randomised to receive either metformin 500 mg 3/d (increasing dose over 2 weeks) or matching placebo Women with BMI ≤ 32 kg/m2 were randomised to receive either metformin 500 mg 3/d, CC 50 mg from day 2‐6 (increasing up to 150 mg over 3 months if no evidence of ovulation) or metformin 500 mg 3/d combined with CC 50 mg day 2‐6 (increasing up to 150 mg over 3 months if no evidence of ovulation) Participants received up to 2 packages of 3 months' treatments. All study drugs were stopped once the participant was pregnant | |
| Outcomes | Primary outcomes were clinical pregnancy (intrauterine gestation sac) and live birth Secondary outcomes were ovulation, miscarriage, ectopic pregnancy or multiple pregnancy | |
| Notes | ||
| Risk of bias | ||
| Bias | Authors' judgement | Support for judgement |
| Random sequence generation (selection bias) | Low risk | Computerised block randomisation (blocks of 10) |
| Allocation concealment (selection bias) | Low risk | "allocation concealment was strictly maintained by a telephone call from the recruiting nurse to pharmacy, ...dispensing pre‐prepared drugs in a true third party randomisation" |
| Blinding (performance bias and detection bias) | Low risk | "Blinding of all parties was maintained in all cases ...until the end of the course of treatment or in the event of pregnancy, until after the pregnancy" |
| Incomplete outcome data (attrition bias) | Low risk | ITT analysis planned and protocol breach and losses to follow‐up were reported in figure 3 |
| Selective reporting (reporting bias) | Low risk | Protocol published and all outcomes reported |
| Other bias | Unclear risk | Inadequate information |
| Methods | RCT Setting: Finland Method of randomisation: computer‐generated random numbers (block of 5). Randomisation was conducted within the department.* Blinding: double* Number randomised: 30 | |
| Participants | Summary: obese PCOS Inclusion criteria: PCOS was defined according to the Rotterdam consensus 2003. PCO on USS. Oligomenorrhoea or amenorrhoea, clinical (Ferriman‐Gallwey score > 7) or biochemical (testosterone > 2.7 nmol/L) hyperandrogenism, BMI>25 Exclusion criteria: diabetes, abnormal liver function tests, smokers, history of alcohol abuse, hormonal drugs or drugs known to affect lipid metabolism Baseline characteristics of each group:
Dropouts: 3 (20%) in the rosiglitazone group (2 due to pregnancy); 1 (6.6%) in the placebo group (personal reasons) | |
| Interventions | Main intervention: rosiglitazone 4 mg for 2 weeks followed by 4 mg twice daily for 4 months or placebo Duration: 4 months Co‐interventions: none | |
| Outcomes | Anthropometric: BMI, WHR* Hormones: testosterone, SHBG, androstenedione, DHEAS Metabolic markers: insulin, glucose, AUC insulin, AUC glucose*, fasting C‐peptide, insulin resistance measured by euglycaemic hyperinsulinaemic clamp test Others: hirsutism, menstrual pattern | |
| Notes | The objective of this study was to assess the effects of rosiglitazone in obese women with PCOS. All the participants were recruited from a single endocrine clinic. All the participants were advised to use some form of non‐hormonal contraception during the study as rosiglitazone is a category C drug. Rosiglitazone improves menstrual cyclicity, insulin resistance and hyperandrogenism. *Information not in the original paper kindly provided by the study author | |
| Risk of bias | ||
| Bias | Authors' judgement | Support for judgement |
| Random sequence generation (selection bias) | Low risk | Computer‐generated random numbers (block of 5) |
| Allocation concealment (selection bias) | Unclear risk | Randomisation was conducted within the department. Unclear concealment, carried out by the departmental staff |
| Blinding (performance bias and detection bias) | Unclear risk | Inadequate information |
| Incomplete outcome data (attrition bias) | Low risk | Dropouts: 3 (20%) in the rosiglitazone group (2 due to pregnancy); 1 (6.6%) in the placebo group (personal reasons) |
| Selective reporting (reporting bias) | Unclear risk | Insufficient information in the study |
| Other bias | Unclear risk | Inadequate information |
| Methods | RCT Setting: Italy Method of randomisation: block of 10 sealed envelopes containing randomisation codes assigning 5 women to metformin and 5 to placebo group Blinding: double Number randomised: 28 | |
| Participants | Summary: non‐obese PCOS Inclusion criteria: Rotterdam consensus 2003, normal weight Exclusion criteria: abnormal TFT, LFT Baseline characteristics of each group:
Dropouts: 2 in metformin due to poor compliance; 3 in placebo group (lost to follow‐up) | |
| Interventions | Main intervention: metformin 500 mg or placebo tablets twice daily Duration: 6 months Co‐interventions: lifestyle modification | |
| Outcomes | Ovulation: Anthropometric: BMI, WHR Hormones: testosterone, SHBG Metabolic markers: lipid profiles | |
| Notes | A small RCT investigated the effect of metformin on ovarian US appearance and steroidogenic function in normal‐weight normoinsulinaemic women with PCOS. Only the metabolic data was included in our analysis. | |
| Risk of bias | ||
| Bias | Authors' judgement | Support for judgement |
| Random sequence generation (selection bias) | Unclear risk | Not stated |
| Allocation concealment (selection bias) | Low risk | Blocks of 10 sealed opaque envelopes containing randomisation codes |
| Blinding (performance bias and detection bias) | Low risk | Double‐blind, placebo‐controlled |
| Incomplete outcome data (attrition bias) | Low risk | Dropouts: 2 in metformin due to poor compliance; 3 in placebo group (lost to follow‐up) |
| Selective reporting (reporting bias) | Low risk | None identified |
| Other bias | Unclear risk | Inadequate information |
| Methods | RCT Setting: Turkey Method of randomisation: not stated* Blinding: not stated* Number randomised: 21 | |
| Participants | Summary: obese PCOS Inclusion criteria: PCO on USS (≥ 10 cysts 2‐10 mm), oligomenorrhoea (cycle length > 35 d) or amenorrhoea (no menstrual period > 6 months), clinical or biochemical hyperandrogenism (testosterone > 2.7 nmol/L); participants received no medication known to affect pituitary‐ovarian function or carbohydrate metabolism for at least 12 weeks before the study Exclusion criteria: androgen‐secreting tumour, Cushing’s syndrome, thyroid dysfunctions, CAH, hyperprolactinaemia and diabetes Baseline characteristics of each group:
Dropouts: none | |
| Interventions | Main intervention: metformin 850 mg twice daily. Placebo was not used. Duration: metformin alone or no treatment for 3 months followed by combining CC ovulation‐induction therapy for further 6 cycles or until pregnancy occurred. Co‐interventions: CC 100 mg daily for 5 d from day 5 of the cycle. Ovulation was triggered by administration of 10,000 IU hCG (Pregnyl, Organon, Holland) | |
| Outcomes | Ovulation: progesterone > 5.0 ng/mL Anthropometric: BMI Hormones: testosterone, free testosterone, androstenedione, SHBG, DHEAS, estradiol, prolactin Metabolic markers: insulin, glucose, AUC insulin, AUC glucose Others: pregnancy, live birth, miscarriage | |
| Notes | Women were recruited from a single infertility unit. All participants presented with primary infertility. Tubal disease and male‐factor infertility were excluded. Of the women, 90% presented with oligomenorrhoea and 10% amenorrhoea. In addition, half of the participants had Ferriman‐Gallwey score > 8. Since placebo was not used in the study, bias may exist in the trial period. We are still waiting for a reply from the study author regarding the method of randomisation and concealment. Furthermore, all the anthropometric, hormonal and metabolic data were presented in a format of median and range, which we cannot enter in the meta‐analysis. Hence, we asked the study author to provide the results in mean and standard deviation. Ovulation rates after the initial 3 months metformin treatment alone were not given. The response to CC treatment was monitored by serial USS. When there were < 4 follicles with diameter > 15 mm with a leading follicle of > 18 mm in diameter, 10,000 IU hCG was administrated intramuscularly. Pregnancy was defined by US evidence of a gestational sac and the presence of fetal heart activity. In this most recent update, we have calculated ovulation rate per woman. In the paper, values are given as number of participants and percentage ovulation/cycle. These data have been used to infer the ovulation rate per person.
*No reply from the study author | |
| Risk of bias | ||
| Bias | Authors' judgement | Support for judgement |
| Random sequence generation (selection bias) | Unclear risk | Inadequate information |
| Allocation concealment (selection bias) | Unclear risk | Inadequate information |
| Blinding (performance bias and detection bias) | Unclear risk | Inadequate information |
| Incomplete outcome data (attrition bias) | Unclear risk | Insufficient information to assess |
| Selective reporting (reporting bias) | Unclear risk | Insufficient information in the study |
| Other bias | Unclear risk | Insufficient information to assess |
| Methods | RCT Setting: South Africa Method of randomisation: computer‐generated random numbers Blinding: unblinded Number randomised: 107 | |
| Participants | Summary: obese PCOS Inclusion criteria: PCOS (according to Rotterdam consensus 2003), confirmed tubal patency Exclusion criteria: male factor subfertility Baseline characteristics of each group:
Dropouts: no significant different in the dropout rates, 10 in metformin + CC group and 7 in CC‐only group | |
| Interventions | Main intervention: metformin 850 mg twice daily Duration: 6 weeks before and throughout ovulation induction with CC Co‐interventions: CC 50‐150 mg day 4‐8 for 4 cycles + lifestyle modification | |
| Outcomes | Ovulation: day 21 progesterone level (level not stated) | |
| Notes | A single‐centre RCT investigated the benefit of using metformin in CC ovulation induction treatment. ITT was used in our analysis. Participant lost to follow‐up classified as non‐responder; whilst pregnant participants did not attend follow‐up visit (one in each arm) were classified as responder | |
| Risk of bias | ||
| Bias | Authors' judgement | Support for judgement |
| Random sequence generation (selection bias) | Low risk | Computer‐generated random numbers |
| Allocation concealment (selection bias) | Unclear risk | Not stated |
| Blinding (performance bias and detection bias) | High risk | Unblinded |
| Incomplete outcome data (attrition bias) | Low risk | Dropouts: no significant difference in the dropout rates, 10 in metformin + CC group and 7 in CC‐only group |
| Selective reporting (reporting bias) | Unclear risk | Insufficient information in the study |
| Other bias | Unclear risk | Inadequate information |
| Methods | Cross‐over RCT Setting: UK Method of randomisation: performed by pharmacy* Blinding: double‐blind Number randomised: 19 | |
| Participants | Summary: obese PCOS, CC resistance Inclusion criteria: oligomenorrhoea cycle > 40 d for 6 months, anovulation demonstrated by day 20‐22 progesterone ≤ 10 nmol/L, lack of response to CC 100 mg for 5 d with US showing endometrial thickness ≤ 5 mm and no ovarian follicle ≥ 14 mm. Age 18‐40 years Exclusion criteria: raised prolactin, adrenal hyperplasia, thyroid dysfunction, medication known to affect insulin action*
Dropouts: 4 (40%) from metformin arm and 4 (44%) from placebo arm*. Not included in analysis | |
| Interventions | Main intervention: 1 of metformin 500 mg 3/d, placebo Duration: 6 months Co‐interventions: 1st week of treatment at 500 mg 1/d, 2nd at 500 mg 2/d and 3rd at 500 mg 3/d. Those that did not ovulate after 3 months had CC 50 mg days 2‐6, increased to 100 mg for a total of 3 cycles | |
| Outcomes | Ovulation: by monthly serum progesterone (> 10 nmol/L) and presence of follicle ≥ 14 mm on ovarian US* Anthropometric: weight, BMI, WHR Reproductive hormones: total testosterone, FAI, SHBG Metabolic markers: fasting glucose, fasting insulin, insulin resistance, beta‐cell function, systolic BP, diastolic BP Others: pregnancy, menstrual cycle, Ferriman‐Gallwey score | |
| Notes | This was designed as a cross‐over trial, with 6 months in the treatment/placebo arm followed by a 1‐month washout and then a 3‐month cross‐over. In this review, we only considered the first phase. The inclusion criteria were simply for CC‐resistant anovulation and not specifically PCOS. However only 2 women did not have US criteria of PCOS, and 75% had a raised FAI* *Information not in the original paper kindly provided by the study author | |
| Risk of bias | ||
| Bias | Authors' judgement | Support for judgement |
| Random sequence generation (selection bias) | Unclear risk | Performed by pharmacy |
| Allocation concealment (selection bias) | Unclear risk | Performed by pharmacy |
| Blinding (performance bias and detection bias) | Unclear risk | Inadequate information |
| Incomplete outcome data (attrition bias) | High risk | Dropouts: 4 (40%) from metformin arm and 4 (44%) from placebo arm*. Not included in analysis |
| Selective reporting (reporting bias) | Unclear risk | Insufficient information in the study |
| Other bias | Unclear risk | Inadequate information |
| Methods | Multicentre RCT Setting: UK Method of randomisation: randomisation was performed by the research pharmacy department centrally. Using a random table, a block of 4 randomisation technique was employed in the study. Medications were supplied centrally from the research pharmacy department. The code was kept in the pharmacy department until the end of the trial period. Blinding: double Number randomised: 143 | |
| Participants | Summary: obese PCOS Inclusion criteria: PCO on USS (> 10 cysts 2‐8 mm in diameter), oligomenorrhoea (cycle length > 35 d) or amenorrhoea (no period in 6 months) Exclusion criteria: concurrent hormone therapy within previous 6 weeks, metabolic or chronic disease, renal or liver disease, diabetes, CAH, androgen‐secreting tumour Baseline characteristics of each group:
Dropouts: 11 (15.9%) in the metformin arm, 6 (8.1%). The difference was not significant. | |
| Interventions | Main intervention: metformin 850 mg or placebo tablet once twice daily Duration: 6 months Co‐interventions: lifestyle modification (combination of diet and exercise) aiming to reduce 500 kcal/d | |
| Outcomes | Anthropometric: BMI, weight, WHR, BP Hormones: total testosterone, SHBG Metabolic markers: insulin, glucose, total cholesterol, triglyceride Others: menstrual pattern, pregnancy | |
| Notes | A large multicentre randomised placebo controlled study was conducted to investigate the combined effects of the lifestyle modification and the use of metformin in obese women with PCOS (BMI > 30). A total of 8 centres in UK took part in the recruitment. All the participants were recruited from the infertility clinics. The ethnic origin of the participants was not recorded. Both the metformin and the placebo groups experienced improvement in weight loss and in menstrual pattern. However, the differences between the 2 groups were not significant. Participants in the metformin arm showed a greater reduction in total testosterone levels compared with women in the placebo arm. | |
| Risk of bias | ||
| Bias | Authors' judgement | Support for judgement |
| Random sequence generation (selection bias) | Low risk | The randomisation was performed by the research pharmacy department centrally. Using a random table, a block of 4 randomisation technique was employed in the study |
| Allocation concealment (selection bias) | Low risk | Medications were supplied centrally from the research pharmacy department. The code was kept in the pharmacy department until the end of the trial period |
| Blinding (performance bias and detection bias) | Low risk | Double‐blinded |
| Incomplete outcome data (attrition bias) | High risk | Dropouts: 11 (15.9%) in the metformin arm, 6 (8.1%). The difference was not significant. Details of the dropout participants were not mentioned |
| Selective reporting (reporting bias) | Low risk | Primary outcome measure (menstrual frequency) and secondary outcome measures (metabolic parameters) were reported |
| Other bias | Unclear risk | Inadequate information |
| Methods | Cross‐over RCT Setting: Denmark Method of randomisation: random number table Blinding: double Number randomised: 60 | |
| Participants | Summary: obese PCOS Inclusion criteria: Rotterdam criteria, age between 18‐45 years Exclusion criteria: elevated serum gonadotrophins levels, hyperprolactinaemia, diabetes, abnormal thyroid, renal or liver functions, pregnancy, a wish for fertility treatment Baseline characteristics of each group:
Dropouts: 2 in each group | |
| Interventions | Main intervention: metformin 850 mg or placebo twice daily Duration: 6 months Co‐interventions: no | |
| Outcomes | Anthropometric: weight, systolic BP* Hormones: testosterone* Metabolic markers: insulin, glucose, HDL* | |
| Notes | This was a single‐centre randomised, double blinded, placebo controlled cross‐over study to assess the effects of metformin on menstrual frequency and metabolic parameters. Women were randomised to receive either metformin or placebo tablets for 6 months. After a 3‐month wash‐out period, the women received the alternate treatment. Women who wished for fertility treatment were excluded. *Information that was not in the original article kindly provided by the study author. | |
| Risk of bias | ||
| Bias | Authors' judgement | Support for judgement |
| Random sequence generation (selection bias) | Low risk | Random number table |
| Allocation concealment (selection bias) | Unclear risk | The randomisation code stored in a closed envelope until the end of recruitment. Identical trial drug and placebo tablet |
| Blinding (performance bias and detection bias) | Low risk | Double‐blinded |
| Incomplete outcome data (attrition bias) | Low risk | 2 dropouts in each group. Similar dropout rates. Baseline characteristics were comparable between the dropout and the completed groups |
| Selective reporting (reporting bias) | Low risk | A clear study protocol. Power calculation reported. Primary outcome (menstrual frequency) reported |
| Other bias | High risk | Initial power calculation indicated minimum of 50 participants in the trial. However, due to an increased dropout rate, the number of recruitment subsequently increased to 60. |
| Methods | Multicentre RCT Setting: USA Method of randomisation: computer generation in blocks of 6 Blinding: double‐blind Number randomised: 27 | |
| Participants | Summary: obese PCOS, CC resistance Inclusion criteria: PCOS (oligomenorrhoea < 6 cycles/year, anovulation with CC 150 mg for 5 d confirmed by progesterone < 4 ng/mL or amenorrhoea by day 35, hyperandrogaenemia (elevated androstenedione, free testosterone or total testosterone)* or hirsutism, exclusion of other endocrinopathy, US findings of PCO; age 18‐35; normal semen analysis; tubal patency if previous pelvic surgery or infection Exclusion criteria: diabetes mellitus, adrenal hyperplasia, thyroid dysfunction, hyperprolactinaemia, abnormal renal or liver function, medication known to affect insulin action* Baseline characteristics of each group:
Dropouts: 1 from each arm (7%); 1 in the placebo arm ovulated in response to CC but was excluded owing to non‐compliance. Not included in analysis | |
| Interventions | Main intervention: 1 of metformin 500 mg 3/d, placebo Duration: 7 weeks initially, then those who did not ovulate continued for a further 6 cycles Co‐interventions: those that did not ovulate after 7 weeks had CC 50 mg for 5 d. If ovulation did not occur the dose was increased to 100 mg then 150 mg for a total of 6 cycles No change in usual eating habits, physical activity or lifestyle | |
| Outcomes | Ovulation: serum progesterone ≥ 12.7 nmol/L on days 10, 20, 30 and 40 (and days 21 and 28 of subsequent cycles if received CC) Anthropometric: weight, BMI Reproductive Hormones: total testosterone, free testosterone, androstenedione, DHEAS, SHBG, estradiol, FSH, LH, 17‐alpha hydroxyprogesterone Metabolic markers: fasting glucose, fasting insulin, AUC of insulin and glucose during GTT Others: live birth, pregnancy | |
| Notes | Although obesity was not an inclusion criteria, the mean BMI was high in this study although similar in both arms. *Information not in the original paper kindly provided by the study author | |
| Risk of bias | ||
| Bias | Authors' judgement | Support for judgement |
| Random sequence generation (selection bias) | Low risk | Computer generation in blocks of 6 |
| Allocation concealment (selection bias) | Unclear risk | Not stated |
| Blinding (performance bias and detection bias) | Low risk | Double‐blind |
| Incomplete outcome data (attrition bias) | Unclear risk | Dropouts: 1 from each arm (7%); 1 in the placebo arm ovulated in response to CC but was excluded owing to non‐compliance. Not included in analysis. Details not provided |
| Selective reporting (reporting bias) | Unclear risk | Insufficient information in the study |
| Other bias | Unclear risk | Inadequate information |
| Methods | RCT Setting: USA Method of randomisation: not stated Blinding: double‐blind Number randomised: 55 | |
| Participants | Summary: PCOS Inclusion criteria: not stated. Unknown BMI and age Exclusion criteria: unknown Baseline characteristics of each group: not stated Dropouts: not stated 26 women underwent 99 blinded treatment cycles whilst 29 women underwent 88 blinded treatment cycles | |
| Interventions | Main intervention: metformin 500 mg or placebo 3/d Duration: 6 cycles Co‐interventions: CC (dose unclear) | |
| Outcomes | Ovulation Pregnancy | |
| Notes | A conference abstract presented in 57th Annual Meeting of The Pacific Coast Reproductive Society 2009. No reply from study author regarding the detail of the study | |
| Risk of bias | ||
| Bias | Authors' judgement | Support for judgement |
| Random sequence generation (selection bias) | Unclear risk | Inadequate information |
| Allocation concealment (selection bias) | Unclear risk | Inadequate information |
| Blinding (performance bias and detection bias) | Unclear risk | Inadequate information |
| Incomplete outcome data (attrition bias) | Unclear risk | Inadequate information |
| Selective reporting (reporting bias) | Unclear risk | Insufficient information in the study |
| Other bias | Unclear risk | Inadequate information |
| Methods | RCT Setting: Turkey Method of randomisation: computer‐generated numbers. Centralised randomisation process* Blinding: double‐blind Number randomised: 32 | |
| Participants | Summary: non‐obese PCOS, CC resistance Inclusion criteria: PCOS (oligomenorrhoea < 6 cycles/year, anovulation confirmed with progesterone < 5 ng/mL, testosterone > 2.4 nmol/L, exclusion of other endocrinopathy, US findings of PCO, CC resistance to 250 mg for 5 d for up to 6 months, normal semen analysis, normal HSG or laparoscopy within 6 months Exclusion criteria: diabetes mellitus, adrenal hyperplasia, Cushing's syndrome, thyroid dysfunction, hyperprolactinaemia, medication known to alter insulin action, previous gonadotrophin treatment, infertility other than that caused by PCOS, previous pelvic surgery Baseline characteristics of each group:
Dropouts: 2 (6%) from the metformin/placebo part of the trial owing to pregnancy. They were excluded from analysis | |
| Interventions | Main intervention: 1 of metformin 850 mg 2/d, placebo Duration: 6 weeks initially, then those who did not ovulate continued for1 cycle Co‐interventions: those that did not ovulate after 6 weeks had recombinant FSH in a low‐dose, step‐up protocol No change in usual eating habits | |
| Outcomes | Ovulation: serum progesterone > 15.9 nmol/L weekly Anthropometric: BMI, WHR Reproductive hormones: total testosterone, free testosterone, androstenedione, DHEAS, estradiol, FSH, LH, 17‐alpha hydroxyprogesterone Metabolic markers: fasting insulin, AUC insulin and glucose during GTT, insulin sensitivity, leptin, Others: live birth, adverse events, pregnancy, duration of rFSH stimulation, total dose of FSH, oestradiol on day of hCG, monofollicular development | |
| Notes | Free testosterone was significantly higher in the metformin group. Fasting insulin was non‐significantly higher with a wide SD compared with placebo. *Information not in the original paper kindly provided by the study author | |
| Risk of bias | ||
| Bias | Authors' judgement | Support for judgement |
| Random sequence generation (selection bias) | Low risk | Computer‐generated numbers. Centralised randomisation process* |
| Allocation concealment (selection bias) | Unclear risk | Inadequate information |
| Blinding (performance bias and detection bias) | Unclear risk | Inadequate information |
| Incomplete outcome data (attrition bias) | Low risk | Dropouts: 2 (6%) from the metformin/placebo part of the trial owing to pregnancy. They were excluded from analysis |
| Selective reporting (reporting bias) | Unclear risk | Insufficient information in the study |
| Other bias | Unclear risk | Insufficient information |
| Methods | RCT Setting: Malaysia Method of randomisation: picking a card out of a box Blinding: no Number randomised: 124 | |
| Participants | Summary: obese PCOS Inclusion criteria: newly diagnosed with PCOS (Rotterdam criteria), age < 40 years Exclusion criteria: diabetes, hepatic or renal dysfunction, heart disease, abnormal semen analysis (WHO criteria) Baseline characteristics of each group:
Dropouts: 4 (9.5%) in the metformin group, 2 (4.9%) in the CC group and 3 (7.3%) in the combined metformin and CC group | |
| Interventions | Main intervention: metformin 1500 mg/d Duration: 6 months Co‐interventions: CC 50 mg from day 2‐6 of the cycle. If women did not respond to the treatment, the dose increased by 50 mg to a maximum dose of 200 mg All the women were offered dietary advice. | |
| Outcomes | Ovulation: USS follicular tracking Hormones: testosterone Others: live birth, pregnancy, miscarriage | |
| Notes | This study was designed to compare the live birth rates in women who received CC, metformin and combined CC and metformin treatments. Placebo tablets were not used in this unblinded RCT. Therefore, potential bias may be introduced. Most women were Malay (about 90%) Analysis was based on analysis per protocol, not ITT | |
| Risk of bias | ||
| Bias | Authors' judgement | Support for judgement |
| Random sequence generation (selection bias) | Unclear risk | Picking a card out of a box |
| Allocation concealment (selection bias) | Unclear risk | Picking a card out of a box |
| Blinding (performance bias and detection bias) | High risk | Unblinded |
| Incomplete outcome data (attrition bias) | High risk | Dropouts: 4 (9.5%) in the metformin group, 2 (4.9%) in the CC group and 3 (7.3%) in the combined metformin and CC group. Analysis was based on analysis per protocol, not ITT |
| Selective reporting (reporting bias) | Unclear risk | Insufficient information in the study |
| Other bias | Unclear risk | Inadequate information |
Baseline characteristics given in order of main intervention (drug, placebo).
Where the trial protocol included a statement such as, "all patients had ultrasound features of PCOS" then this has been included as an inclusion criteria (unless the authors specifically state that it was not in which case it is recorded under notes).
Abbreviations Table 1:
ACTH:
AUC: area under the curve
BMI: body mass index
BP: blood pressure
CAH:
CC: clomiphene citrate
CI: confidence interval
CT: computerised tomography scan
DHEAS: dehydroepiandrosterone sulphate
FAI: free androgen index
FSH: follicle stimulating hormone
GTT: glucose tolerance test
HbA1C: glycosylated haemoglobin
HDL: high density lipoprotein cholesterol
IGFBP‐1: insulin growth factor binding protein 1
ITT: intention‐to‐treat
LDL: low density lipoprotein cholesterol
LFT:
LH: luteinising hormone
OGTT:
RCT: randomised controlled trial
rFSH: recombinant follicle stimulating hormone
PCOS: polycystic ovary syndrome
PID:
SD: standard deviation
SE: standard error of the mean
SHBG: sex hormone‐binding globulin
TFT: thyroid function test
TSH:
US(S): ultrasound (scan)
VLDL: very low density lipoprotein cholesterol
WHO: World Health Organization
WHR: waist:hip ratio
Characteristics of excluded studies [ordered by study ID]
Ir a:
| Study | Reason for exclusion |
| Human chorionic gonadotrophin hormone was used an an ovulation trigger, which may have added additional heterogeneity to the results. Reasons for losses to follow up not given. Not intention to treat analysis | |
| The aim of the study was to evaluate the effects of pioglitazone on insulin action and ovarian androgen production in women with PCOS. This was a randomised, placebo‐controlled trial but the details of randomisation were not provided. Furthermore, the recruited participants did not have history of subfertility | |
| Randomised, double‐blind study comparing troglitazone (150 mg, 300 mg, 600 mg daily) with placebo. Randomisation method was unclear and no reply from the study author. Troglitazone has been withdrawn from the market due to risk of hepatic damage | |
| Randomised, double‐blind study comparing troglitazone (150 mg, 300 mg, 600 mg daily) with placebo. Randomisation method was unclear and no reply from the study author. Troglitazone has been withdrawn from the market due to risk of hepatic damage. | |
| This study compared 2 insulin‐sensitising agents, which does not meet the inclusion criteria for this review | |
| This study compared the efficacy of metformin with folic acid | |
| This study compared the efficacy of metformin with folic acid | |
| Randomised, double‐blind trial comparing metformin 850 mg 2/d with placebo Participants were women with hirsutism and obesity but not necessarily anovulation. 67% had regular menses. 63% had polycystic ovaries on US. The results indicated that weight loss induced by a hypocalorific diet led to improvements in insulin and androgen levels, but that metformin gave no additional benefit over diet | |
| The aim of this study was to ascertain the effects of metformin on ovarian function. The outcomes of this review, such as ovulation rate, pregnancy or live birth rate were not measured as contraception was advised during the study | |
| Randomised trial in women with CC‐resistant PCOS having 75 IU FSH for ovulation induction, comparing pre‐treatment with metformin 500 mg 3/d with no metformin pre‐treatment. The aims and outcome measures were different from the other included trials (main outcome measures were number of FSH ampoules, days of treatment and markers of ovarian hyperstimulation). The trial reported treatment cycles rather than participants, and combined the results of each group in a cross‐over type analysis. Therefore the data were not suitable for inclusion in this meta‐analysis | |
| Randomised double blind trial in women with PCOS comparing troglitazone 200mg and troglitazone 400mg daily. This trial only randomised for dose of troglitazone, and did not have a placebo or no treatment arm | |
| Randomised trial in non‐obese women with PCOS comparing metformin and the combined oral contraceptive (ethinyl estradiol/cyproterone acetate) with the combined contraceptive alone. This trial did not compare metformin with placebo, no treatment or an ovulation‐induction agent | |
| In this study, the efficacy of metformin was compared with vitamin B, and we were unable to contact the study author | |
| No record of this publication | |
| Non‐English‐language trial in women with CC resistant PCOS, comparing metformin with the Chinese herbal formula tiangui fang. The paper makes no mention of randomisation and has therefore been classified as a controlled clinical trial. Ovulation was assessed by menstrual cyclicity and basal body temperature change but not by a biochemical method. This trial did not have a placebo or no‐treatment arm, and the only significant result reported was a reduction in testosterone and BMI in the tiangui fang arm compared with baseline | |
| Randomised trial in lean, young women with anovulation, hyperinsulinaemia, and hyperandrogaenemia. It had 3 arms: metformin only, flutamide only and metformin and flutamide together. This trial was not included because it had no placebo arm, and the anti‐androgen flutamide is not an ovulation‐induction agent | |
| This study evaluated the effect of short‐course pretreatment with metformin on hyperandrogenism, insulin resistance, cervical scores and pregnancy rates in women with CC‐resistant PCOS Apart from receiving CC treatment, all participants received 10,000 U of hCG injection to stimulate ovulation followed by timed intercourse. Hence, all women received 2 ovulation‐induction agents per cycle of treatment. Therefore, it would not be appropriate to combine these subjects in the current review as all the included trial participants only received 1 type of ovulation‐induction agent with or without metformin | |
| This study was published in 2002. The objective was to ascertain the effect of metformin on hirsutism in women with PCOS. This outcome measure has been removed in the update review | |
| Quasi‐randomised trial comparing combined CC and metformin with CC on ovulation in CC‐resistant women with PCOS. Inadequate randomisation and sequence generation (sequential by order of admission). Admission determined by day of menses. Allocation performed by nurse blinded to the study. Odd numbers allocated metformin, even numbers allocated placebo | |
| In this RCT women were advised to avoid pregnancy, so the outcomes of interest in the review were not investigated | |
| Patients in this study underwent intrauterine insemination and assisted reproduction is an exclusion criteria for this review. Aspects of the methodology are missing from the article | |
| Randomised, double‐blind study in women with PCOS comparing troglitazone 200 mg and troglitazone 400 mg daily. This trial only randomised for dose of troglitazone, and did not have a placebo or no‐treatment arm | |
| Randomised trial in obese women with PCOS comparing metformin 500 mg 2/d and 1 g 2/d with combined oral contraceptive (ethinyl estradiol/cyproterone acetate). This trial was not blinded and did not compare metformin with placebo, no treatment or an ovulation‐induction agent | |
| Conference abstract. Not enough information to separate the data for analysis. Data from a published paper by the same author is included in the 3rd update of this review | |
| This study investigated whether hyperinsulinaemia stimulates ovarian cytochrome P450c17α activity in women with PCOS. Some of the participants were not infertile | |
| Partially randomised trial in lean women with PCOS comparing metformin 500 mg 3/d with placebo. The method of randomisation was initially by pulling pieces out of a hat, but then continued as an observational study. The trial was initially single‐blind, with the patient blinded The published data included both randomised and non‐randomised participants, and an analysis to include only the randomised participants was not possible | |
| Participants in this study underwent assisted conception using IVF | |
| This study investigated the effect of insulin sensitisers on oocyte quality in IVF cycles, and therefore does not meet the inclusion criteria for this review | |
| An open‐labelled, randomised trial comparing metformin 500 mg 3/d with placebo 6 weeks prior to CC treatment. In addition, randomisation was performed using alternate numbers. These factors introduced significant bias. | |
| Attempts to contact study author for more information unsuccessful | |
| Randomised trial comparing CC and metformin with CC 1.5 g and rosiglitazone 4 mg in CC‐resistant women with PCOS. This trial did not compare metformin/CC with CC/placebo | |
| This was a conference abstract only, with not enough detail to warrant inclusion. Literature search found no subsequent publication | |
| The objective of this study was to compare CC with metformin on ovulation rates. However, all participants also received 2000 U of hCG injection once follicular diameter > 15 mm on USS | |
| The objective of this study was to compare the effects of combined rosiglitazone and CC with CC monotherapy. Since placebo was not employed in the trial, both the clinician and participants were not blinded. Therefore, bias may exist in this study. It was unclear whether the study was randomised. We are currently still waiting for a response from the study author | |
| This study investigated the effect of insulin sensitisers on oocyte quality in IVF cycles, and therefore does not meet the inclusion criteria for this review |
CC: clomiphene citrate; FSH: follicle‐stimulating hormone; IVF: in vitro fertilisation; PCOS: polycystic ovary syndrome; RCT: randomised controlled trial; US(S): ultrasound (scan)
Data and analyses
| Outcome or subgroup title | No. of studies | No. of participants | Statistical method | Effect size |
| 1 Live birth rate Show forest plot | 4 | 435 | Odds Ratio (M‐H, Fixed, 95% CI) | 1.59 [1.00, 2.51] |
| Analysis 1.1 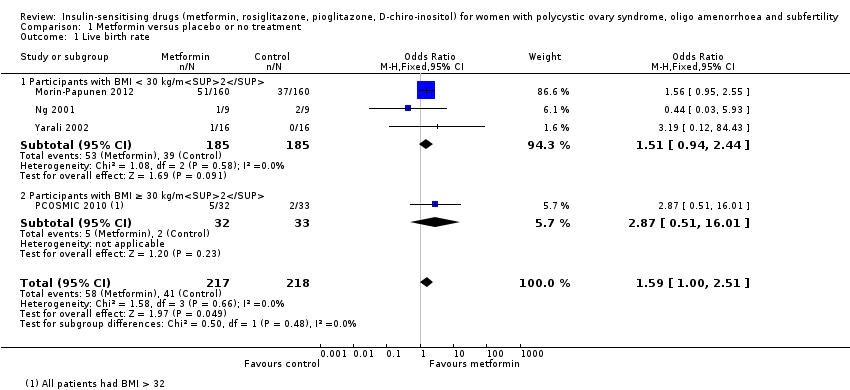 Comparison 1 Metformin versus placebo or no treatment, Outcome 1 Live birth rate. | ||||
| 1.1 Participants with BMI < 30 kg/m2 | 3 | 370 | Odds Ratio (M‐H, Fixed, 95% CI) | 1.51 [0.94, 2.44] |
| 1.2 Participants with BMI ≥ 30 kg/m2 | 1 | 65 | Odds Ratio (M‐H, Fixed, 95% CI) | 2.87 [0.51, 16.01] |
| 2 Adverse events (gastrointestinal side effects) Show forest plot | 7 | 670 | Odds Ratio (M‐H, Fixed, 95% CI) | 4.76 [3.06, 7.41] |
| Analysis 1.2 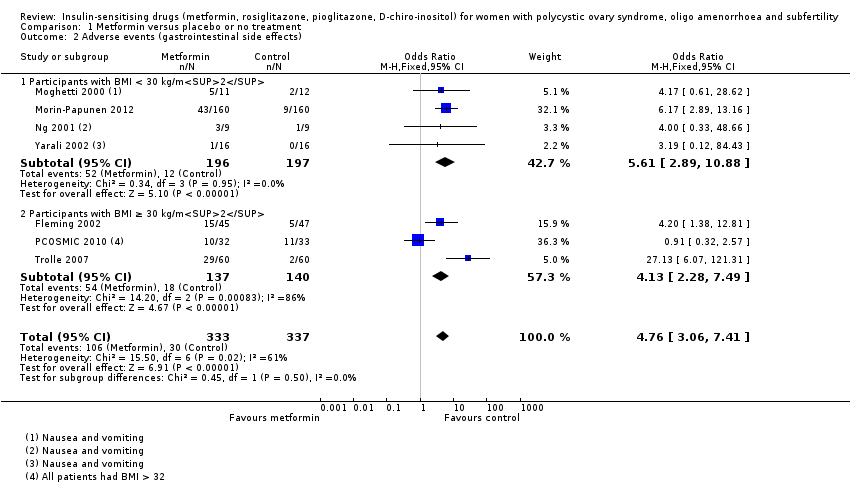 Comparison 1 Metformin versus placebo or no treatment, Outcome 2 Adverse events (gastrointestinal side effects). | ||||
| 2.1 Participants with BMI < 30 kg/m2 | 4 | 393 | Odds Ratio (M‐H, Fixed, 95% CI) | 5.61 [2.89, 10.88] |
| 2.2 Participants with BMI ≥ 30 kg/m2 | 3 | 277 | Odds Ratio (M‐H, Fixed, 95% CI) | 4.13 [2.28, 7.49] |
| 3 Clinical pregnancy rate Show forest plot | 9 | 1027 | Odds Ratio (M‐H, Fixed, 95% CI) | 1.93 [1.42, 2.64] |
| Analysis 1.3  Comparison 1 Metformin versus placebo or no treatment, Outcome 3 Clinical pregnancy rate. | ||||
| 3.1 Participants with BMI < 30 kg/m2 | 5 | 733 | Odds Ratio (M‐H, Fixed, 95% CI) | 1.89 [1.35, 2.65] |
| 3.2 Participants with BMI ≥ 30 kg/m2 | 4 | 294 | Odds Ratio (M‐H, Fixed, 95% CI) | 2.21 [0.98, 4.98] |
| 4 Ovulation rate Show forest plot | 14 | 701 | Odds Ratio (M‐H, Fixed, 95% CI) | 2.55 [1.81, 3.59] |
| Analysis 1.4  Comparison 1 Metformin versus placebo or no treatment, Outcome 4 Ovulation rate. | ||||
| 4.1 Participants with BMI < 30 kg/m2 | 5 | 229 | Odds Ratio (M‐H, Fixed, 95% CI) | 4.15 [2.31, 7.45] |
| 4.2 Participants with BMI ≥ 30 kg/m2 | 10 | 472 | Odds Ratio (M‐H, Fixed, 95% CI) | 1.96 [1.28, 3.01] |
| 5 Menstrual frequency Show forest plot | 7 | 427 | Odds Ratio (M‐H, Fixed, 95% CI) | 1.72 [1.14, 2.61] |
| Analysis 1.5  Comparison 1 Metformin versus placebo or no treatment, Outcome 5 Menstrual frequency. | ||||
| 5.1 Participants with BMI < 30 kg/m2 | 1 | 23 | Odds Ratio (M‐H, Fixed, 95% CI) | 21.15 [1.01, 445.00] |
| 5.2 Participants with BMI ≥ 30 kg/m2 | 6 | 404 | Odds Ratio (M‐H, Fixed, 95% CI) | 1.57 [1.03, 2.41] |
| 6 Miscarriage rate per woman Show forest plot | 4 | 748 | Odds Ratio (M‐H, Fixed, 95% CI) | 1.08 [0.50, 2.35] |
| Analysis 1.6 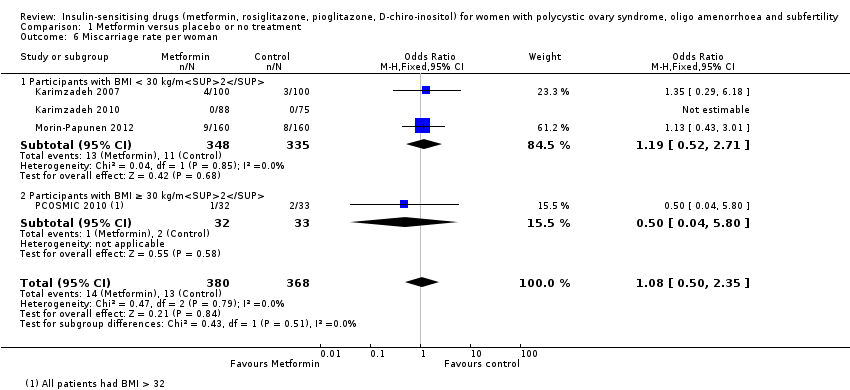 Comparison 1 Metformin versus placebo or no treatment, Outcome 6 Miscarriage rate per woman. | ||||
| 6.1 Participants with BMI < 30 kg/m2 | 3 | 683 | Odds Ratio (M‐H, Fixed, 95% CI) | 1.19 [0.52, 2.71] |
| 6.2 Participants with BMI ≥ 30 kg/m2 | 1 | 65 | Odds Ratio (M‐H, Fixed, 95% CI) | 0.5 [0.04, 5.80] |
| 7 Sensitivity analysis: miscarriage rate per pregnancy Show forest plot | 4 | 200 | Odds Ratio (M‐H, Fixed, 95% CI) | 0.58 [0.25, 1.34] |
| Analysis 1.7 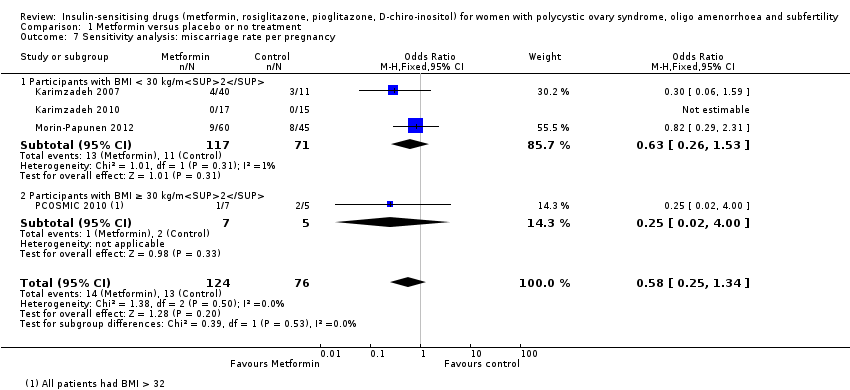 Comparison 1 Metformin versus placebo or no treatment, Outcome 7 Sensitivity analysis: miscarriage rate per pregnancy. | ||||
| 7.1 Participants with BMI < 30 kg/m2 | 3 | 188 | Odds Ratio (M‐H, Fixed, 95% CI) | 0.63 [0.26, 1.53] |
| 7.2 Participants with BMI ≥ 30 kg/m2 | 1 | 12 | Odds Ratio (M‐H, Fixed, 95% CI) | 0.25 [0.02, 4.00] |
| 8 Body mass index (kg/m2) Show forest plot | 16 | 827 | Mean Difference (IV, Fixed, 95% CI) | ‐0.08 [‐0.33, 0.17] |
| Analysis 1.8 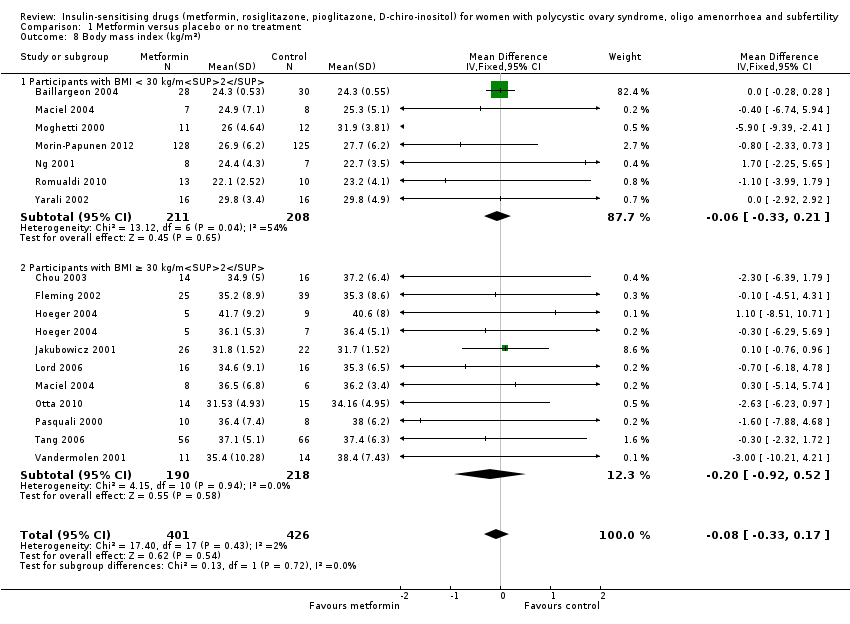 Comparison 1 Metformin versus placebo or no treatment, Outcome 8 Body mass index (kg/m2). | ||||
| 8.1 Participants with BMI < 30 kg/m2 | 7 | 419 | Mean Difference (IV, Fixed, 95% CI) | ‐0.06 [‐0.33, 0.21] |
| 8.2 Participants with BMI ≥ 30 kg/m2 | 10 | 408 | Mean Difference (IV, Fixed, 95% CI) | ‐0.20 [‐0.92, 0.52] |
| 9 Waist‐hip ratio Show forest plot | 11 | 702 | Mean Difference (IV, Fixed, 95% CI) | ‐0.01 [‐0.01, ‐0.00] |
| Analysis 1.9 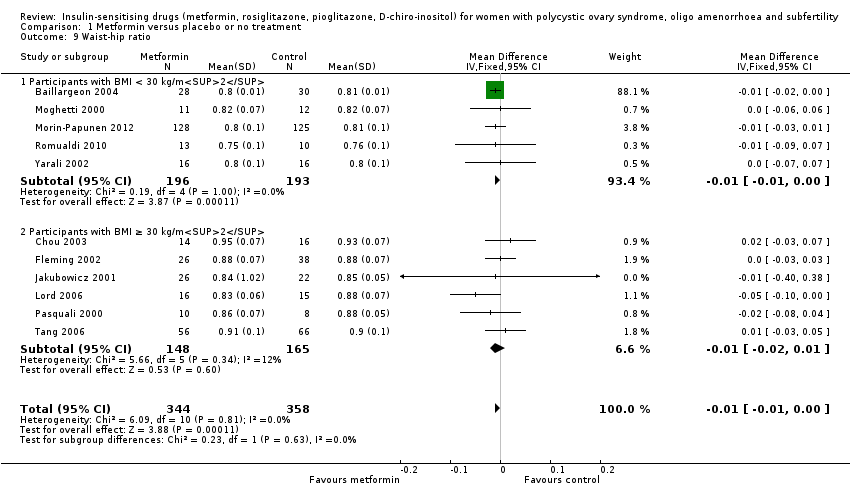 Comparison 1 Metformin versus placebo or no treatment, Outcome 9 Waist‐hip ratio. | ||||
| 9.1 Participants with BMI < 30 kg/m2 | 5 | 389 | Mean Difference (IV, Fixed, 95% CI) | ‐0.01 [‐0.01, ‐0.00] |
| 9.2 Participants with BMI ≥ 30 kg/m2 | 6 | 313 | Mean Difference (IV, Fixed, 95% CI) | ‐0.01 [‐0.02, 0.01] |
| 10 Blood pressure ‐ systolic (mm Hg) Show forest plot | 7 | 379 | Mean Difference (IV, Fixed, 95% CI) | ‐3.59 [‐5.13, ‐2.04] |
| Analysis 1.10  Comparison 1 Metformin versus placebo or no treatment, Outcome 10 Blood pressure ‐ systolic (mm Hg). | ||||
| 10.1 Participants with BMI < 30 kg/m2 | 3 | 96 | Mean Difference (IV, Fixed, 95% CI) | ‐3.52 [‐5.29, ‐1.76] |
| 10.2 Participants with BMI ≥ 30 kg/m2 | 5 | 283 | Mean Difference (IV, Fixed, 95% CI) | ‐3.80 [‐5.00, ‐0.60] |
| 11 Blood pressure ‐ diastolic (mm Hg) Show forest plot | 6 | 292 | Mean Difference (IV, Fixed, 95% CI) | ‐0.14 [‐1.35, 1.07] |
| Analysis 1.11 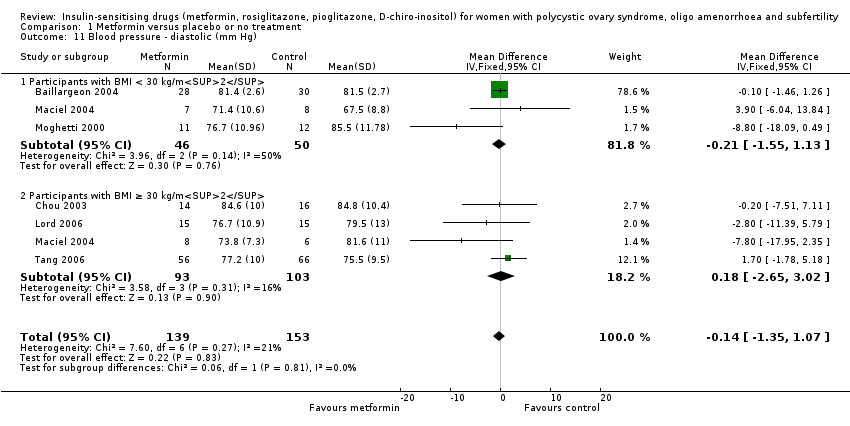 Comparison 1 Metformin versus placebo or no treatment, Outcome 11 Blood pressure ‐ diastolic (mm Hg). | ||||
| 11.1 Participants with BMI < 30 kg/m2 | 3 | 96 | Mean Difference (IV, Fixed, 95% CI) | ‐0.21 [‐1.55, 1.13] |
| 11.2 Participants with BMI ≥ 30 kg/m2 | 4 | 196 | Mean Difference (IV, Fixed, 95% CI) | 0.18 [‐2.65, 3.02] |
| 12 Serum testosterone (nmol/L) Show forest plot | 15 | 863 | Mean Difference (IV, Fixed, 95% CI) | ‐0.49 [‐0.59, ‐0.39] |
| Analysis 1.12  Comparison 1 Metformin versus placebo or no treatment, Outcome 12 Serum testosterone (nmol/L). | ||||
| 12.1 Participants with BMI < 30 kg/m2 | 7 | 419 | Mean Difference (IV, Fixed, 95% CI) | ‐0.71 [‐0.86, ‐0.56] |
| 12.2 Participants with BMI ≥ 30 kg/m2 | 9 | 444 | Mean Difference (IV, Fixed, 95% CI) | ‐0.29 [‐0.44, ‐0.15] |
| 13 Serum sex hormone‐binding globulin (nmol/L) Show forest plot | 15 | 823 | Mean Difference (IV, Fixed, 95% CI) | 0.49 [‐1.82, 2.81] |
| Analysis 1.13  Comparison 1 Metformin versus placebo or no treatment, Outcome 13 Serum sex hormone‐binding globulin (nmol/L). | ||||
| 13.1 Participants with BMI < 30 kg/m2 | 6 | 387 | Mean Difference (IV, Fixed, 95% CI) | ‐0.22 [‐6.73, 6.28] |
| 13.2 Participants with BMI ≥ 30 kg/m2 | 10 | 436 | Mean Difference (IV, Fixed, 95% CI) | 0.60 [‐1.88, 3.07] |
| 14 Fasting glucose (mmol/L) Show forest plot | 15 | 849 | Mean Difference (IV, Fixed, 95% CI) | ‐0.14 [‐0.21, ‐0.07] |
| Analysis 1.14 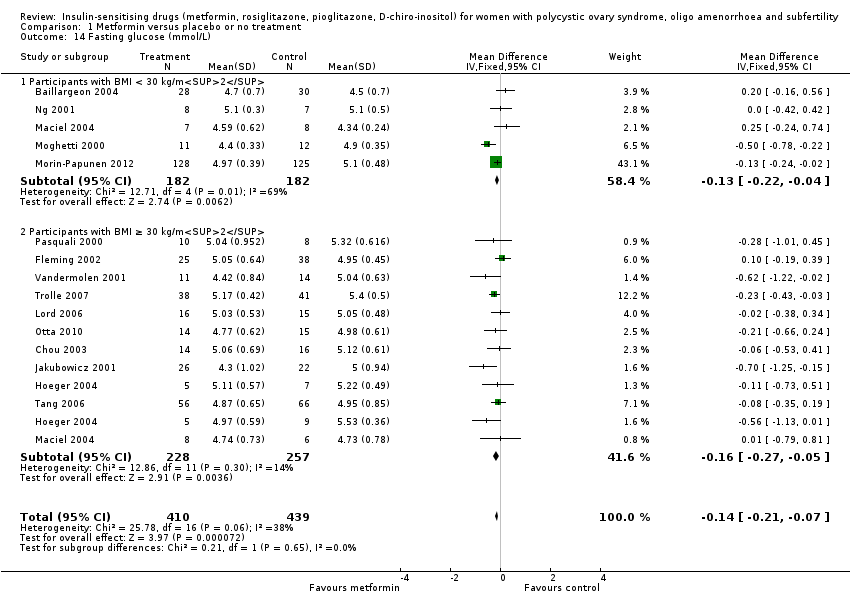 Comparison 1 Metformin versus placebo or no treatment, Outcome 14 Fasting glucose (mmol/L). | ||||
| 14.1 Participants with BMI < 30 kg/m2 | 5 | 364 | Mean Difference (IV, Fixed, 95% CI) | ‐0.13 [‐0.22, ‐0.04] |
| 14.2 Participants with BMI ≥ 30 kg/m2 | 11 | 485 | Mean Difference (IV, Fixed, 95% CI) | ‐0.16 [‐0.27, ‐0.05] |
| 15 Fasting insulin (mIU/L) Show forest plot | 14 | 573 | Mean Difference (IV, Fixed, 95% CI) | ‐4.13 [‐5.67, ‐2.58] |
| Analysis 1.15 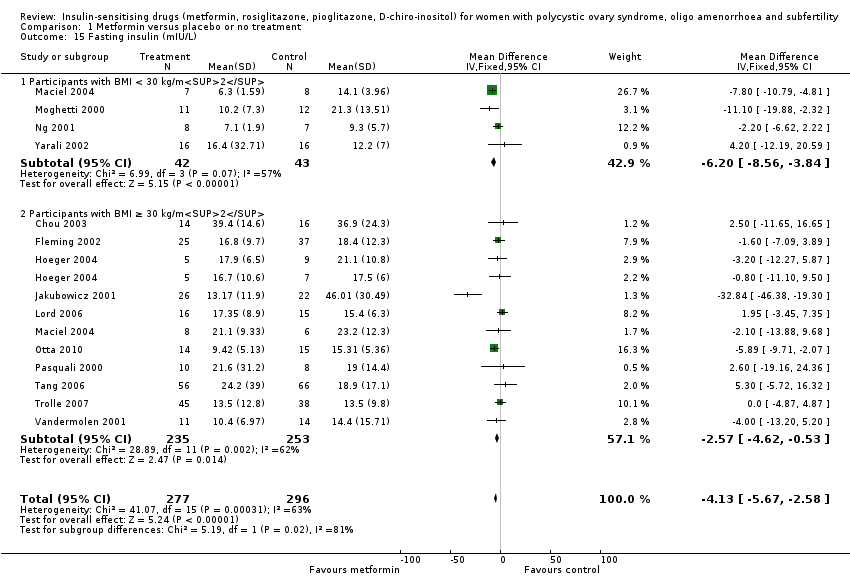 Comparison 1 Metformin versus placebo or no treatment, Outcome 15 Fasting insulin (mIU/L). | ||||
| 15.1 Participants with BMI < 30 kg/m2 | 4 | 85 | Mean Difference (IV, Fixed, 95% CI) | ‐6.20 [‐8.56, ‐3.84] |
| 15.2 Participants with BMI ≥ 30 kg/m2 | 11 | 488 | Mean Difference (IV, Fixed, 95% CI) | ‐2.57 [‐4.62, ‐0.53] |
| 16 Total cholesterol (mmol/L) Show forest plot | 10 | 562 | Mean Difference (IV, Fixed, 95% CI) | ‐0.14 [‐0.31, 0.02] |
| Analysis 1.16  Comparison 1 Metformin versus placebo or no treatment, Outcome 16 Total cholesterol (mmol/L). | ||||
| 16.1 Participants with BMI < 30 kg/m2 | 5 | 276 | Mean Difference (IV, Fixed, 95% CI) | ‐0.02 [‐0.26, 0.22] |
| 16.2 Participants with BMI ≥ 30 kg/m2 | 6 | 286 | Mean Difference (IV, Fixed, 95% CI) | ‐0.26 [‐0.48, ‐0.03] |
| 17 Triglyceride levels (mmol/L) Show forest plot | 7 | 309 | Mean Difference (IV, Fixed, 95% CI) | 0.14 [‐0.05, 0.32] |
| Analysis 1.17  Comparison 1 Metformin versus placebo or no treatment, Outcome 17 Triglyceride levels (mmol/L). | ||||
| 17.1 Participants with BMI < 30 kg/m2 | 3 | 53 | Mean Difference (IV, Fixed, 95% CI) | 0.00 [‐0.33, 0.34] |
| 17.2 Participants with BMI ≥ 30 kg/m2 | 5 | 256 | Mean Difference (IV, Fixed, 95% CI) | 0.20 [‐0.02, 0.42] |
| Outcome or subgroup title | No. of studies | No. of participants | Statistical method | Effect size |
| 1 Live birth rate Show forest plot | 9 | 1079 | Odds Ratio (M‐H, Fixed, 95% CI) | 1.21 [0.92, 1.59] |
| Analysis 2.1  Comparison 2 Metformin combined with clomiphene citrate versus clomiphene citrate alone, Outcome 1 Live birth rate. | ||||
| 1.1 Participants with BMI < 30 kg/m2 or ≤ 32 kg/m2 | 5 | 531 | Odds Ratio (M‐H, Fixed, 95% CI) | 1.14 [0.78, 1.67] |
| 1.2 Participants with BMI ≥ 30 kg/m2 | 4 | 548 | Odds Ratio (M‐H, Fixed, 95% CI) | 1.28 [0.86, 1.91] |
| 2 Adverse events Show forest plot | 3 | 591 | Odds Ratio (M‐H, Fixed, 95% CI) | 3.97 [2.59, 6.08] |
| Analysis 2.2  Comparison 2 Metformin combined with clomiphene citrate versus clomiphene citrate alone, Outcome 2 Adverse events. | ||||
| 2.1 Participants with BMI < 30 kg/m2 | 3 | 591 | Odds Ratio (M‐H, Fixed, 95% CI) | 3.97 [2.59, 6.08] |
| 3 Clinical pregnancy rate Show forest plot | 16 | 1529 | Odds Ratio (M‐H, Fixed, 95% CI) | 1.59 [1.27, 1.99] |
| Analysis 2.3  Comparison 2 Metformin combined with clomiphene citrate versus clomiphene citrate alone, Outcome 3 Clinical pregnancy rate. | ||||
| 3.1 Participants with BMI < 30 kg/m2 | 9 | 834 | Odds Ratio (M‐H, Fixed, 95% CI) | 1.46 [1.08, 1.98] |
| 3.2 Participants with BMI ≥ 30 kg/m2 | 7 | 695 | Odds Ratio (M‐H, Fixed, 95% CI) | 1.76 [1.26, 2.47] |
| 4 Ovulation rate Show forest plot | 21 | 1624 | Odds Ratio (M‐H, Fixed, 95% CI) | 1.57 [1.28, 1.92] |
| Analysis 2.4 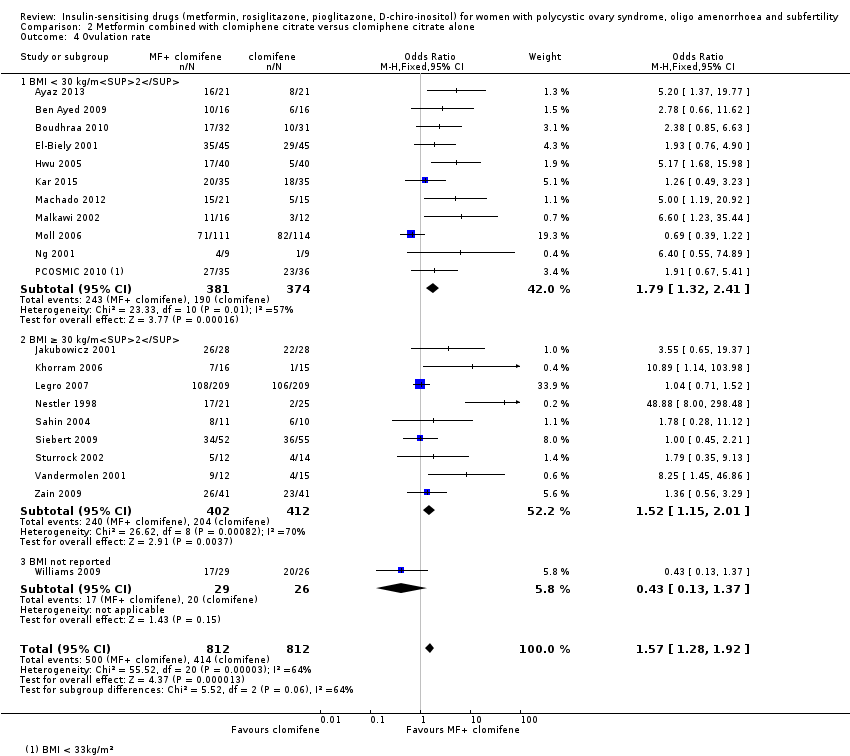 Comparison 2 Metformin combined with clomiphene citrate versus clomiphene citrate alone, Outcome 4 Ovulation rate. | ||||
| 4.1 BMI < 30 kg/m2 | 11 | 755 | Odds Ratio (M‐H, Fixed, 95% CI) | 1.79 [1.32, 2.41] |
| 4.2 BMI ≥ 30 kg/m2 | 9 | 814 | Odds Ratio (M‐H, Fixed, 95% CI) | 1.52 [1.15, 2.01] |
| 4.3 BMI not reported | 1 | 55 | Odds Ratio (M‐H, Fixed, 95% CI) | 0.43 [0.13, 1.37] |
| 5 Ovulation rate: subgroup analysis by sensitivity to clomiphene citrate Show forest plot | 7 | 271 | Odds Ratio (M‐H, Fixed, 95% CI) | 4.69 [2.61, 8.44] |
| Analysis 2.5  Comparison 2 Metformin combined with clomiphene citrate versus clomiphene citrate alone, Outcome 5 Ovulation rate: subgroup analysis by sensitivity to clomiphene citrate. | ||||
| 5.1 PCOS and clomiphene‐sensitive | 1 | 56 | Odds Ratio (M‐H, Fixed, 95% CI) | 3.55 [0.65, 19.37] |
| 5.2 PCOS and clomiphene‐resistant | 6 | 215 | Odds Ratio (M‐H, Fixed, 95% CI) | 4.89 [2.62, 9.13] |
| 6 Miscarriage rate per woman Show forest plot | 9 | 1096 | Odds Ratio (M‐H, Fixed, 95% CI) | 1.59 [1.03, 2.46] |
| Analysis 2.6  Comparison 2 Metformin combined with clomiphene citrate versus clomiphene citrate alone, Outcome 6 Miscarriage rate per woman. | ||||
| 6.1 Participants with BMI < 30 kg/m2 | 5 | 548 | Odds Ratio (M‐H, Fixed, 95% CI) | 1.41 [0.76, 2.62] |
| 6.2 Participants with BMI ≥ 30 kg/m2 | 4 | 548 | Odds Ratio (M‐H, Fixed, 95% CI) | 1.79 [0.97, 3.32] |
| 7 Sensitivity analysis: miscarriage rate per pregnancy Show forest plot | 8 | 400 | Odds Ratio (M‐H, Fixed, 95% CI) | 1.30 [0.80, 2.12] |
| Analysis 2.7 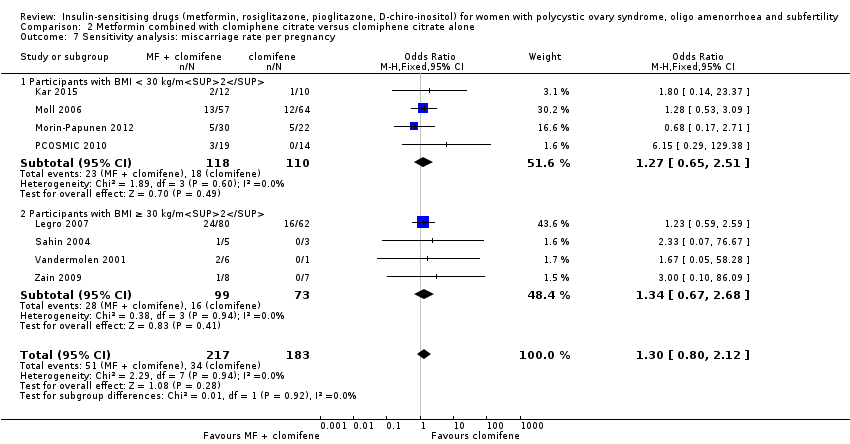 Comparison 2 Metformin combined with clomiphene citrate versus clomiphene citrate alone, Outcome 7 Sensitivity analysis: miscarriage rate per pregnancy. | ||||
| 7.1 Participants with BMI < 30 kg/m2 | 4 | 228 | Odds Ratio (M‐H, Fixed, 95% CI) | 1.27 [0.65, 2.51] |
| 7.2 Participants with BMI ≥ 30 kg/m2 | 4 | 172 | Odds Ratio (M‐H, Fixed, 95% CI) | 1.34 [0.67, 2.68] |
| 8 Multiple pregnancy rate per woman Show forest plot | 6 | 1003 | Odds Ratio (M‐H, Fixed, 95% CI) | 0.56 [0.18, 1.68] |
| Analysis 2.8  Comparison 2 Metformin combined with clomiphene citrate versus clomiphene citrate alone, Outcome 8 Multiple pregnancy rate per woman. | ||||
| 8.1 Participants with BMI < 30 kg/m2 | 3 | 476 | Odds Ratio (M‐H, Fixed, 95% CI) | 0.50 [0.12, 2.04] |
| 8.2 Participants with BMI ≥ 30kg/m2 | 3 | 527 | Odds Ratio (M‐H, Fixed, 95% CI) | 0.66 [0.11, 4.01] |
| 9 Senstivity analysis: multiple pregnancy rate per pregnancy Show forest plot | 6 | 342 | Odds Ratio (M‐H, Fixed, 95% CI) | 0.46 [0.15, 1.42] |
| Analysis 2.9  Comparison 2 Metformin combined with clomiphene citrate versus clomiphene citrate alone, Outcome 9 Senstivity analysis: multiple pregnancy rate per pregnancy. | ||||
| 9.1 Participants with BMI < 30 kg/m2 | 3 | 178 | Odds Ratio (M‐H, Fixed, 95% CI) | 0.43 [0.10, 1.85] |
| 9.2 Participants with BMI ≥ 30 kg/m2 | 3 | 164 | Odds Ratio (M‐H, Fixed, 95% CI) | 0.50 [0.08, 3.12] |
| Outcome or subgroup title | No. of studies | No. of participants | Statistical method | Effect size |
| 1 Live birth Show forest plot | 5 | 741 | Odds Ratio (M‐H, Fixed, 95% CI) | 0.71 [0.49, 1.01] |
| Analysis 3.1 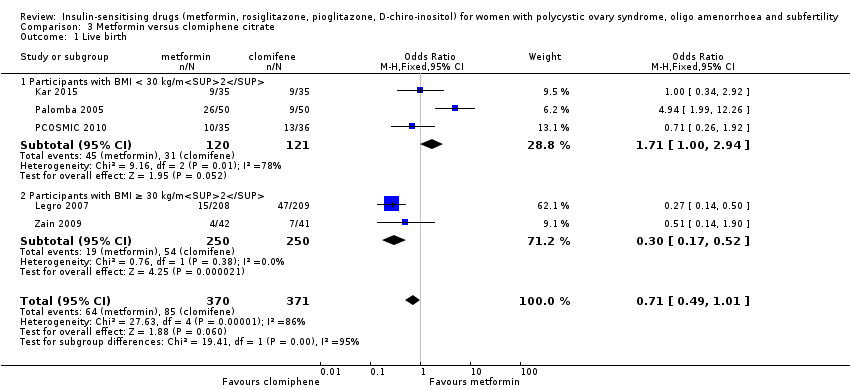 Comparison 3 Metformin versus clomiphene citrate, Outcome 1 Live birth. | ||||
| 1.1 Participants with BMI < 30 kg/m2 | 3 | 241 | Odds Ratio (M‐H, Fixed, 95% CI) | 1.71 [1.00, 2.94] |
| 1.2 Participants with BMI ≥ 30 kg/m2 | 2 | 500 | Odds Ratio (M‐H, Fixed, 95% CI) | 0.30 [0.17, 0.52] |
| 2 Clinical pregnancy rate Show forest plot | 7 | Odds Ratio (M‐H, Fixed, 95% CI) | Subtotals only | |
| Analysis 3.2  Comparison 3 Metformin versus clomiphene citrate, Outcome 2 Clinical pregnancy rate. | ||||
| 2.1 Participants with BMI < 30 kg/m2 | 5 | 490 | Odds Ratio (M‐H, Fixed, 95% CI) | 1.56 [1.05, 2.33] |
| 2.2 Participants with BMI ≥ 30 kg/m2 | 2 | 500 | Odds Ratio (M‐H, Fixed, 95% CI) | 0.34 [0.21, 0.55] |
| 3 Ovulation rate Show forest plot | 6 | Odds Ratio (M‐H, Fixed, 95% CI) | Subtotals only | |
| Analysis 3.3 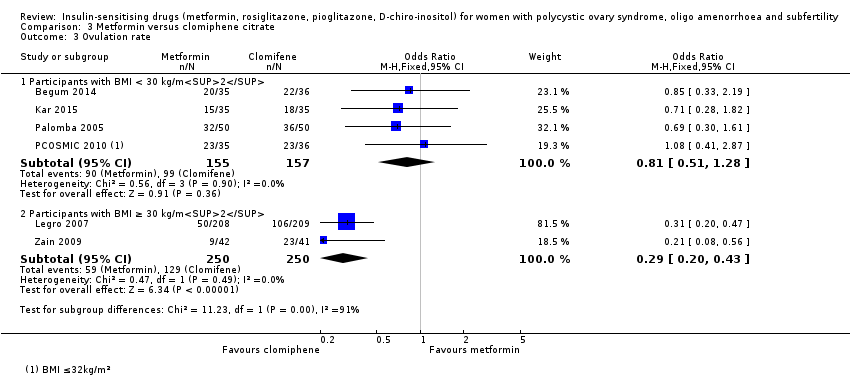 Comparison 3 Metformin versus clomiphene citrate, Outcome 3 Ovulation rate. | ||||
| 3.1 Participants with BMI < 30 kg/m2 | 4 | 312 | Odds Ratio (M‐H, Fixed, 95% CI) | 0.81 [0.51, 1.28] |
| 3.2 Participants with BMI ≥ 30 kg/m2 | 2 | 500 | Odds Ratio (M‐H, Fixed, 95% CI) | 0.29 [0.20, 0.43] |
| 4 Miscarriage rate per woman Show forest plot | 5 | 741 | Odds Ratio (M‐H, Fixed, 95% CI) | 0.92 [0.50, 1.67] |
| Analysis 3.4  Comparison 3 Metformin versus clomiphene citrate, Outcome 4 Miscarriage rate per woman. | ||||
| 4.1 Participants with BMI < 30 kg/m2 | 3 | 241 | Odds Ratio (M‐H, Fixed, 95% CI) | 1.58 [0.61, 4.09] |
| 4.2 Participants with BMI ≥ 30 kg/m2 | 2 | 500 | Odds Ratio (M‐H, Fixed, 95% CI) | 0.61 [0.27, 1.38] |
| 5 Sensitivity analysis: miscarriage rate per pregnancy Show forest plot | 5 | Odds Ratio (M‐H, Fixed, 95% CI) | Totals not selected | |
| Analysis 3.5 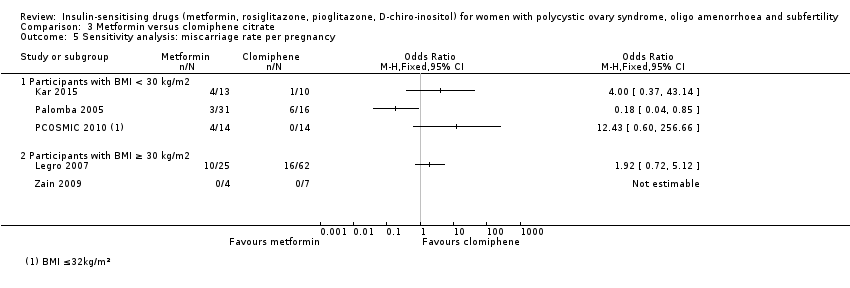 Comparison 3 Metformin versus clomiphene citrate, Outcome 5 Sensitivity analysis: miscarriage rate per pregnancy. | ||||
| 5.1 Participants with BMI < 30 kg/m2 | 3 | Odds Ratio (M‐H, Fixed, 95% CI) | 0.0 [0.0, 0.0] | |
| 5.2 Participants with BMI ≥ 30 kg/m2 | 2 | Odds Ratio (M‐H, Fixed, 95% CI) | 0.0 [0.0, 0.0] | |
| 6 Multiple pregnancy rate per woman Show forest plot | 5 | 858 | Odds Ratio (M‐H, Fixed, 95% CI) | 0.29 [0.06, 1.43] |
| Analysis 3.6  Comparison 3 Metformin versus clomiphene citrate, Outcome 6 Multiple pregnancy rate per woman. | ||||
| 6.1 Participants with BMI < 30 kg/m2 | 3 | 358 | Odds Ratio (M‐H, Fixed, 95% CI) | 0.46 [0.07, 3.16] |
| 6.2 Participants with BMI ≥ 30 kg/m2 | 2 | 500 | Odds Ratio (M‐H, Fixed, 95% CI) | 0.14 [0.01, 2.76] |
| 7 Sensitivity analysis: multiple pregnancy rate per pregnancy Show forest plot | 5 | 201 | Odds Ratio (M‐H, Fixed, 95% CI) | 0.33 [0.06, 1.68] |
| Analysis 3.7  Comparison 3 Metformin versus clomiphene citrate, Outcome 7 Sensitivity analysis: multiple pregnancy rate per pregnancy. | ||||
| 7.1 Participants with BMI < 30 kg/m2 | 3 | 103 | Odds Ratio (M‐H, Fixed, 95% CI) | 0.32 [0.05, 2.24] |
| 7.2 Participants with BMI ≥ 30 kg/m2 | 2 | 98 | Odds Ratio (M‐H, Fixed, 95% CI) | 0.33 [0.02, 6.69] |
| Outcome or subgroup title | No. of studies | No. of participants | Statistical method | Effect size |
| 1 Ovulation Show forest plot | 2 | 327 | Odds Ratio (M‐H, Fixed, 95% CI) | 3.57 [1.72, 7.45] |
| Analysis 4.1  Comparison 4 D‐chiro‐inositol versus placebo or no treatment, Outcome 1 Ovulation. | ||||
| 1.1 Participants with BMI < 30 kg/m2 | 2 | 327 | Odds Ratio (M‐H, Fixed, 95% CI) | 3.57 [1.72, 7.45] |
| 2 Body mass index (kg/m2) Show forest plot | 1 | 44 | Mean Difference (IV, Fixed, 95% CI) | 0.5 [‐0.86, 1.86] |
| Analysis 4.2  Comparison 4 D‐chiro‐inositol versus placebo or no treatment, Outcome 2 Body mass index (kg/m2). | ||||
| 3 Waist‐hip ratio Show forest plot | 1 | 44 | Mean Difference (IV, Fixed, 95% CI) | ‐0.01 [‐0.05, 0.03] |
| Analysis 4.3  Comparison 4 D‐chiro‐inositol versus placebo or no treatment, Outcome 3 Waist‐hip ratio. | ||||
| 4 Blood pressure ‐ systolic (mm Hg) Show forest plot | 1 | 44 | Mean Difference (IV, Fixed, 95% CI) | ‐2.0 [‐5.85, 1.85] |
| Analysis 4.4  Comparison 4 D‐chiro‐inositol versus placebo or no treatment, Outcome 4 Blood pressure ‐ systolic (mm Hg). | ||||
| 5 Blood pressure ‐ diastolic (mm Hg) Show forest plot | 1 | 44 | Mean Difference (IV, Fixed, 95% CI) | ‐4.0 [‐7.26, ‐0.74] |
| Analysis 4.5  Comparison 4 D‐chiro‐inositol versus placebo or no treatment, Outcome 5 Blood pressure ‐ diastolic (mm Hg). | ||||
| 6 Serum testosterone (nmol/L) Show forest plot | 1 | 44 | Mean Difference (IV, Fixed, 95% CI) | ‐0.63 [‐1.37, 0.11] |
| Analysis 4.6  Comparison 4 D‐chiro‐inositol versus placebo or no treatment, Outcome 6 Serum testosterone (nmol/L). | ||||
| 7 Serum sex hormone‐binding globulin (nmol/L) Show forest plot | 1 | 44 | Mean Difference (IV, Fixed, 95% CI) | 69.44 [34.97, 103.91] |
| Analysis 4.7  Comparison 4 D‐chiro‐inositol versus placebo or no treatment, Outcome 7 Serum sex hormone‐binding globulin (nmol/L). | ||||
| 8 Fasting glucose (mmol/L) Show forest plot | 1 | 44 | Mean Difference (IV, Fixed, 95% CI) | ‐0.28 [‐0.99, 0.43] |
| Analysis 4.8  Comparison 4 D‐chiro‐inositol versus placebo or no treatment, Outcome 8 Fasting glucose (mmol/L). | ||||
| 9 Fasting insulin (mIU/L) Show forest plot | 1 | 44 | Mean Difference (IV, Fixed, 95% CI) | ‐20.0 [‐43.43, 3.43] |
| Analysis 4.9 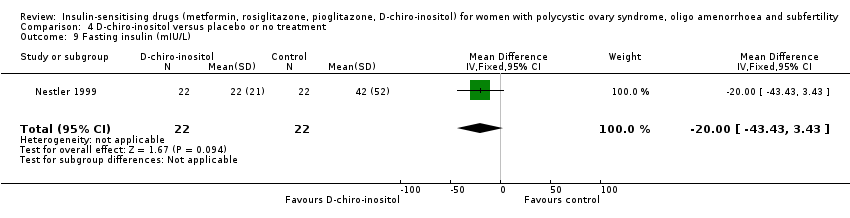 Comparison 4 D‐chiro‐inositol versus placebo or no treatment, Outcome 9 Fasting insulin (mIU/L). | ||||
| 10 Total cholesterol (mmol/L) Show forest plot | 1 | 44 | Mean Difference (IV, Fixed, 95% CI) | ‐0.23 [‐0.99, 0.53] |
| Analysis 4.10 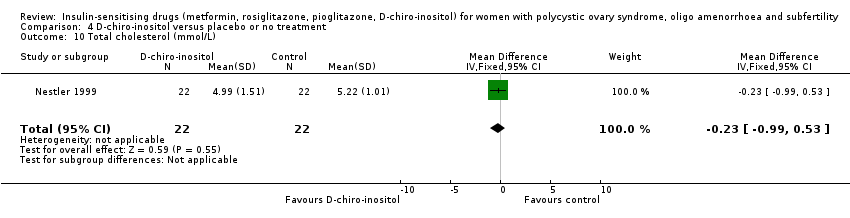 Comparison 4 D‐chiro‐inositol versus placebo or no treatment, Outcome 10 Total cholesterol (mmol/L). | ||||
| 11 Triglyceride levels (mmol/L) Show forest plot | 1 | 44 | Mean Difference (IV, Fixed, 95% CI) | ‐2.20 [‐6.23, 1.83] |
| Analysis 4.11  Comparison 4 D‐chiro‐inositol versus placebo or no treatment, Outcome 11 Triglyceride levels (mmol/L). | ||||
| Outcome or subgroup title | No. of studies | No. of participants | Statistical method | Effect size |
| 1 Ovulation rate Show forest plot | 1 | 64 | Odds Ratio (M‐H, Fixed, 95% CI) | 1.91 [0.70, 5.22] |
| Analysis 5.1  Comparison 5 Rosiglitazone versus placebo or no treatment, Outcome 1 Ovulation rate. | ||||
| 1.1 Participants with BMI ≥ 30 kg/m2 | 1 | 64 | Odds Ratio (M‐H, Fixed, 95% CI) | 1.91 [0.70, 5.22] |
| 2 Menstrual frequency Show forest plot | 2 | 100 | Odds Ratio (M‐H, Fixed, 95% CI) | 5.59 [2.20, 14.19] |
| Analysis 5.2  Comparison 5 Rosiglitazone versus placebo or no treatment, Outcome 2 Menstrual frequency. | ||||
| 3 Body mass index (kg/m2) Show forest plot | 3 | 132 | Mean Difference (IV, Fixed, 95% CI) | 0.68 [0.40, 0.96] |
| Analysis 5.3 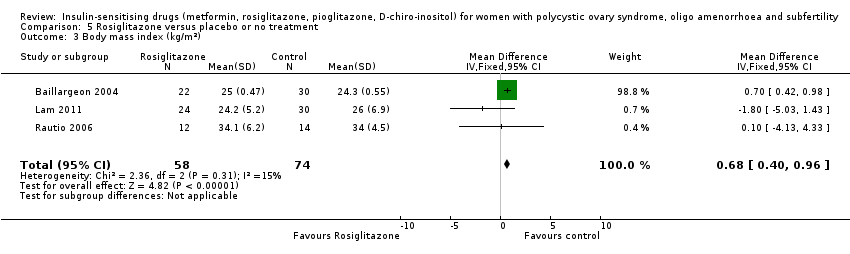 Comparison 5 Rosiglitazone versus placebo or no treatment, Outcome 3 Body mass index (kg/m2). | ||||
| 4 Waist‐hip ratio Show forest plot | 3 | 132 | Mean Difference (IV, Fixed, 95% CI) | ‐0.01 [‐0.02, ‐0.00] |
| Analysis 5.4 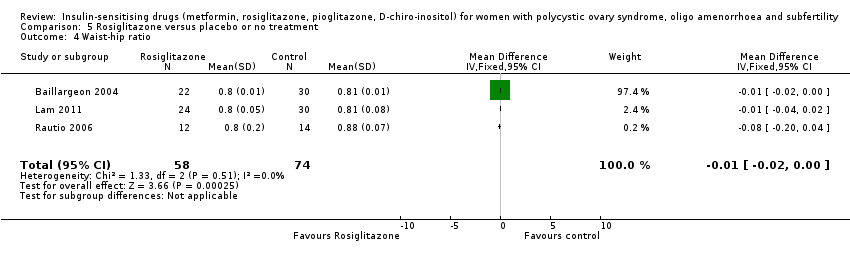 Comparison 5 Rosiglitazone versus placebo or no treatment, Outcome 4 Waist‐hip ratio. | ||||
| 5 Blood pressure ‐ systolic (mm Hg) Show forest plot | 1 | 52 | Mean Difference (IV, Fixed, 95% CI) | ‐2.0 [‐3.95, ‐0.05] |
| Analysis 5.5  Comparison 5 Rosiglitazone versus placebo or no treatment, Outcome 5 Blood pressure ‐ systolic (mm Hg). | ||||
| 6 Blood pressure ‐ diastolic (mm Hg) Show forest plot | 1 | 52 | Mean Difference (IV, Fixed, 95% CI) | ‐0.20 [‐1.72, 1.32] |
| Analysis 5.6  Comparison 5 Rosiglitazone versus placebo or no treatment, Outcome 6 Blood pressure ‐ diastolic (mm Hg). | ||||
| 7 Serum testosterone (nmol/L) Show forest plot | 1 | 54 | Mean Difference (IV, Fixed, 95% CI) | 0.20 [‐0.34, 0.74] |
| Analysis 5.7  Comparison 5 Rosiglitazone versus placebo or no treatment, Outcome 7 Serum testosterone (nmol/L). | ||||
| 8 Serum sex hormone‐binding globulin (nmol/L) Show forest plot | 3 | 132 | Mean Difference (IV, Fixed, 95% CI) | ‐0.69 [‐10.37, 8.98] |
| Analysis 5.8  Comparison 5 Rosiglitazone versus placebo or no treatment, Outcome 8 Serum sex hormone‐binding globulin (nmol/L). | ||||
| 9 Fasting glucose (mmol/L) Show forest plot | 3 | 132 | Mean Difference (IV, Fixed, 95% CI) | ‐0.21 [‐0.39, ‐0.04] |
| Analysis 5.9  Comparison 5 Rosiglitazone versus placebo or no treatment, Outcome 9 Fasting glucose (mmol/L). | ||||
| 10 Fasting insulin (mIU/L) Show forest plot | 2 | 80 | Mean Difference (IV, Fixed, 95% CI) | ‐3.98 [‐9.38, 1.42] |
| Analysis 5.10  Comparison 5 Rosiglitazone versus placebo or no treatment, Outcome 10 Fasting insulin (mIU/L). | ||||
| 11 Total cholesterol (mmol/L) Show forest plot | 2 | 80 | Mean Difference (IV, Fixed, 95% CI) | ‐0.20 [‐0.21, ‐0.19] |
| Analysis 5.11 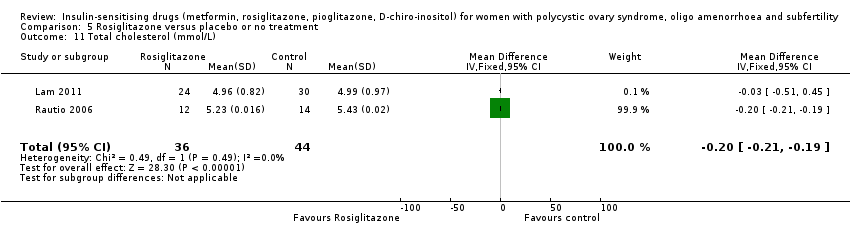 Comparison 5 Rosiglitazone versus placebo or no treatment, Outcome 11 Total cholesterol (mmol/L). | ||||
| 12 Triglyceride levels (mmol/L) Show forest plot | 1 | 26 | Mean Difference (IV, Fixed, 95% CI) | 1.0 [0.89, 1.11] |
| Analysis 5.12 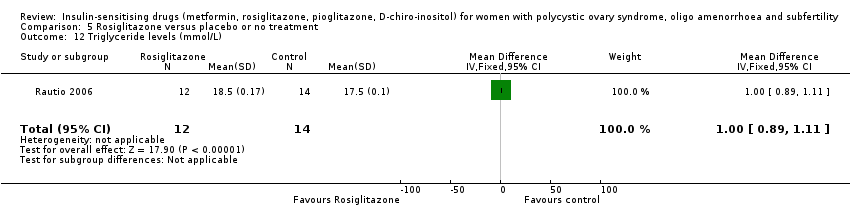 Comparison 5 Rosiglitazone versus placebo or no treatment, Outcome 12 Triglyceride levels (mmol/L). | ||||
| Outcome or subgroup title | No. of studies | No. of participants | Statistical method | Effect size |
| 1 Menstrual frequency Show forest plot | 2 | 70 | Odds Ratio (M‐H, Fixed, 95% CI) | 8.88 [2.35, 33.61] |
| Analysis 6.1  Comparison 6 Pioglitazone versus placebo or no treatment, Outcome 1 Menstrual frequency. | ||||
| 1.1 Participants with BMI < 30 kg/m2 | 1 | 40 | Odds Ratio (M‐H, Fixed, 95% CI) | 10.23 [1.12, 93.34] |
| 1.2 Participants with BMI ≥ 30 kg/m2 | 1 | 30 | Odds Ratio (M‐H, Fixed, 95% CI) | 8.0 [1.52, 42.04] |
| 2 Body mass index (kg/m2) Show forest plot | 2 | 63 | Mean Difference (IV, Fixed, 95% CI) | 0.91 [‐1.88, 3.70] |
| Analysis 6.2  Comparison 6 Pioglitazone versus placebo or no treatment, Outcome 2 Body mass index (kg/m2). | ||||
| 3 Waist‐hip ratio Show forest plot | 1 | 28 | Mean Difference (IV, Fixed, 95% CI) | 0.02 [‐0.02, 0.06] |
| Analysis 6.3  Comparison 6 Pioglitazone versus placebo or no treatment, Outcome 3 Waist‐hip ratio. | ||||
| 4 Serum testosterone (nmol/L) Show forest plot | 2 | 63 | Mean Difference (IV, Fixed, 95% CI) | ‐0.12 [‐0.53, 0.29] |
| Analysis 6.4  Comparison 6 Pioglitazone versus placebo or no treatment, Outcome 4 Serum testosterone (nmol/L). | ||||
| 5 Serum sex hormone‐binding globulin (nmol/L) Show forest plot | 2 | 63 | Mean Difference (IV, Fixed, 95% CI) | 2.75 [‐5.26, 10.77] |
| Analysis 6.5 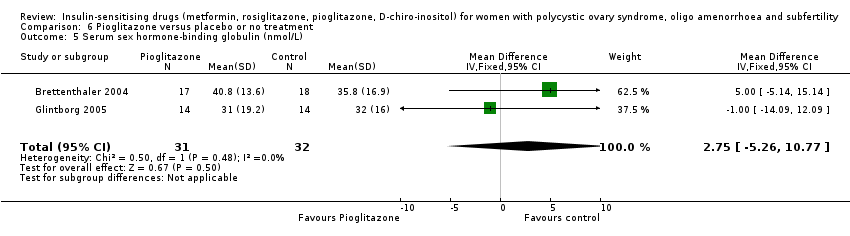 Comparison 6 Pioglitazone versus placebo or no treatment, Outcome 5 Serum sex hormone‐binding globulin (nmol/L). | ||||
| 6 Fasting insulin (mIU/L) Show forest plot | 2 | 63 | Mean Difference (IV, Fixed, 95% CI) | ‐1.46 [‐3.97, 1.06] |
| Analysis 6.6 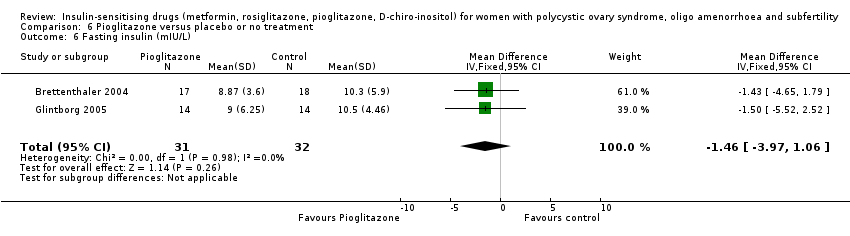 Comparison 6 Pioglitazone versus placebo or no treatment, Outcome 6 Fasting insulin (mIU/L). | ||||

Study flow diagram since publication
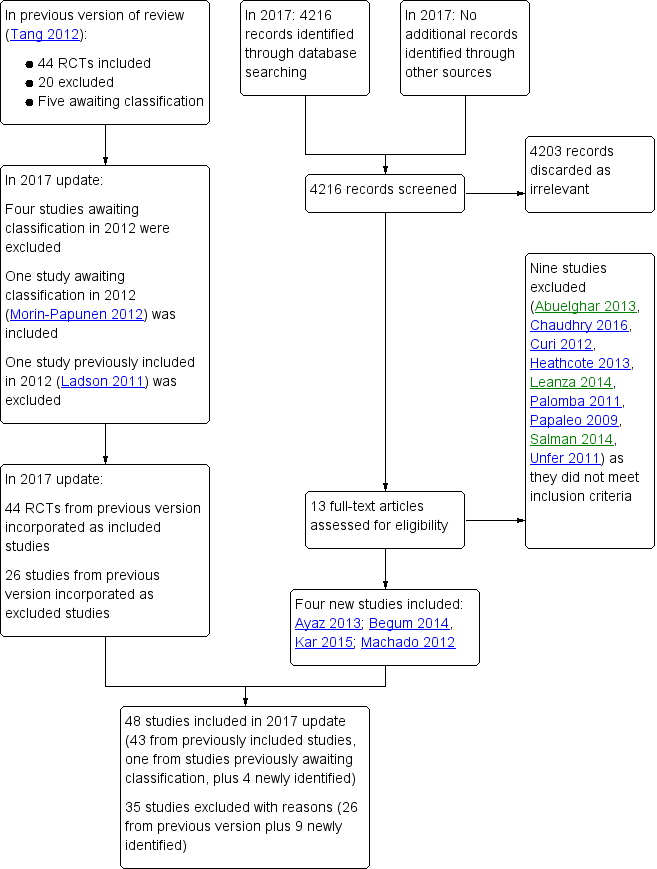
Study flow diagram 2017 update
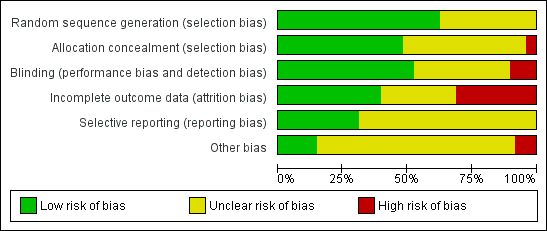
Risk of bias graph: review authors' judgements about each risk of bias item presented as percentages across all included studies

Risk of bias summary: review authors' judgements about each risk of bias item for each included study

Forest plot of comparison: 1 Metformin versus placebo or no treatment, outcome: 1.1 Live birth rate

Forest plot of comparison: 2 Metformin combined with clomiphene citrate versus clomiphene citrate alone, outcome: 2.1 Live birth rate

Forest plot of comparison: 3 Metformin versus clomiphene citrate, outcome: 3.1 Live birth.

Comparison 1 Metformin versus placebo or no treatment, Outcome 1 Live birth rate.

Comparison 1 Metformin versus placebo or no treatment, Outcome 2 Adverse events (gastrointestinal side effects).
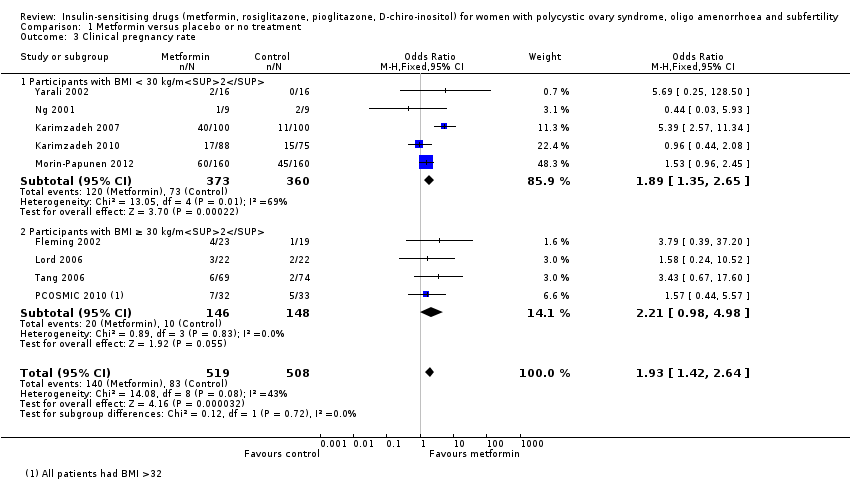
Comparison 1 Metformin versus placebo or no treatment, Outcome 3 Clinical pregnancy rate.
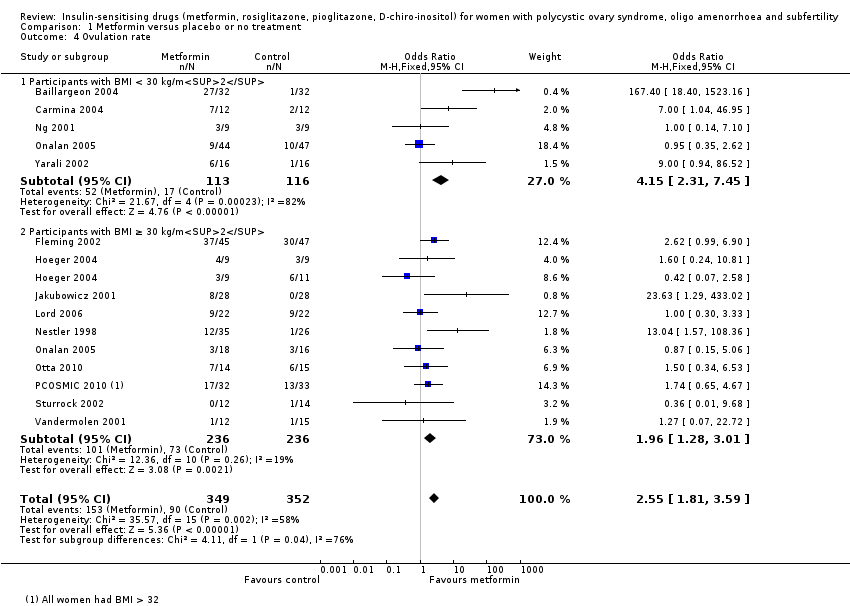
Comparison 1 Metformin versus placebo or no treatment, Outcome 4 Ovulation rate.
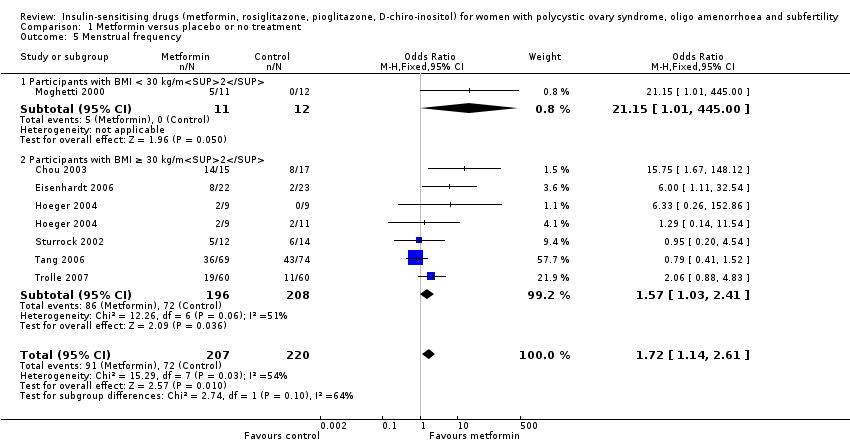
Comparison 1 Metformin versus placebo or no treatment, Outcome 5 Menstrual frequency.

Comparison 1 Metformin versus placebo or no treatment, Outcome 6 Miscarriage rate per woman.

Comparison 1 Metformin versus placebo or no treatment, Outcome 7 Sensitivity analysis: miscarriage rate per pregnancy.

Comparison 1 Metformin versus placebo or no treatment, Outcome 8 Body mass index (kg/m2).

Comparison 1 Metformin versus placebo or no treatment, Outcome 9 Waist‐hip ratio.
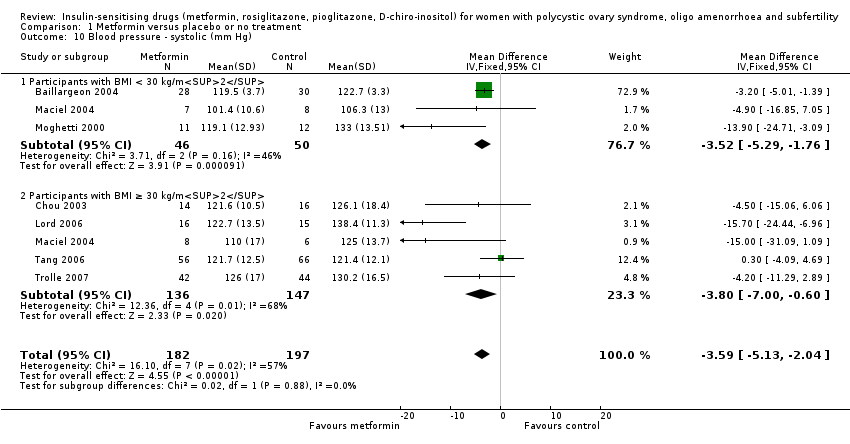
Comparison 1 Metformin versus placebo or no treatment, Outcome 10 Blood pressure ‐ systolic (mm Hg).

Comparison 1 Metformin versus placebo or no treatment, Outcome 11 Blood pressure ‐ diastolic (mm Hg).

Comparison 1 Metformin versus placebo or no treatment, Outcome 12 Serum testosterone (nmol/L).

Comparison 1 Metformin versus placebo or no treatment, Outcome 13 Serum sex hormone‐binding globulin (nmol/L).

Comparison 1 Metformin versus placebo or no treatment, Outcome 14 Fasting glucose (mmol/L).

Comparison 1 Metformin versus placebo or no treatment, Outcome 15 Fasting insulin (mIU/L).

Comparison 1 Metformin versus placebo or no treatment, Outcome 16 Total cholesterol (mmol/L).
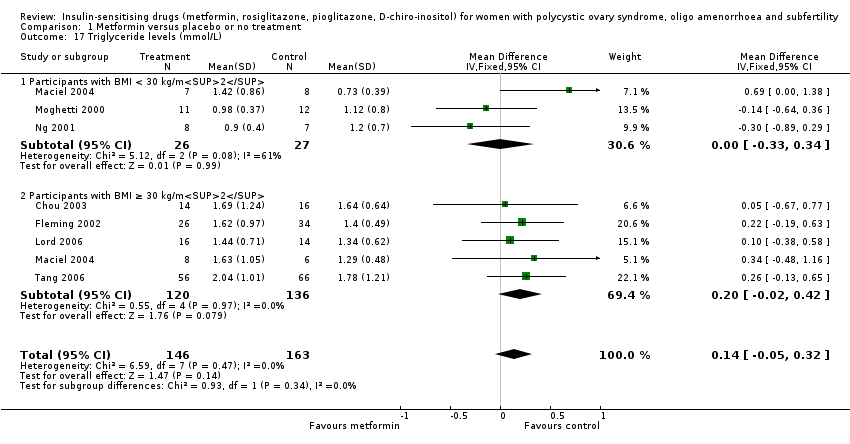
Comparison 1 Metformin versus placebo or no treatment, Outcome 17 Triglyceride levels (mmol/L).

Comparison 2 Metformin combined with clomiphene citrate versus clomiphene citrate alone, Outcome 1 Live birth rate.

Comparison 2 Metformin combined with clomiphene citrate versus clomiphene citrate alone, Outcome 2 Adverse events.

Comparison 2 Metformin combined with clomiphene citrate versus clomiphene citrate alone, Outcome 3 Clinical pregnancy rate.

Comparison 2 Metformin combined with clomiphene citrate versus clomiphene citrate alone, Outcome 4 Ovulation rate.

Comparison 2 Metformin combined with clomiphene citrate versus clomiphene citrate alone, Outcome 5 Ovulation rate: subgroup analysis by sensitivity to clomiphene citrate.

Comparison 2 Metformin combined with clomiphene citrate versus clomiphene citrate alone, Outcome 6 Miscarriage rate per woman.

Comparison 2 Metformin combined with clomiphene citrate versus clomiphene citrate alone, Outcome 7 Sensitivity analysis: miscarriage rate per pregnancy.
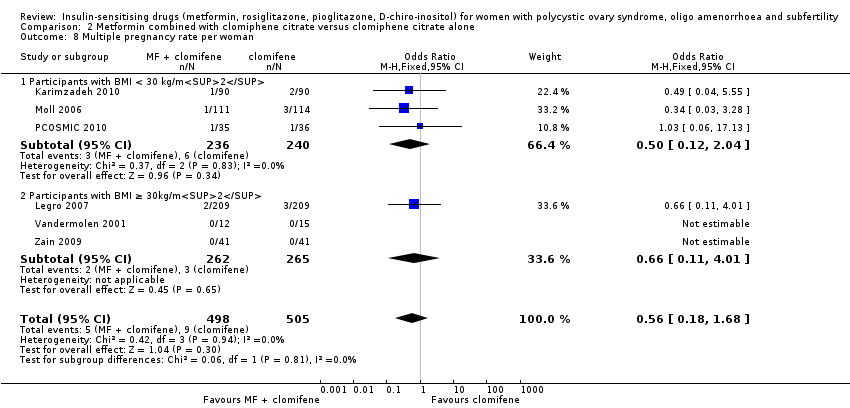
Comparison 2 Metformin combined with clomiphene citrate versus clomiphene citrate alone, Outcome 8 Multiple pregnancy rate per woman.
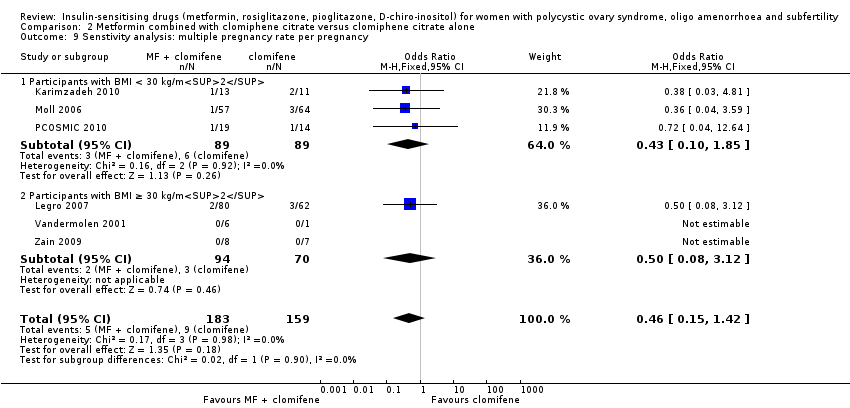
Comparison 2 Metformin combined with clomiphene citrate versus clomiphene citrate alone, Outcome 9 Senstivity analysis: multiple pregnancy rate per pregnancy.

Comparison 3 Metformin versus clomiphene citrate, Outcome 1 Live birth.

Comparison 3 Metformin versus clomiphene citrate, Outcome 2 Clinical pregnancy rate.

Comparison 3 Metformin versus clomiphene citrate, Outcome 3 Ovulation rate.

Comparison 3 Metformin versus clomiphene citrate, Outcome 4 Miscarriage rate per woman.

Comparison 3 Metformin versus clomiphene citrate, Outcome 5 Sensitivity analysis: miscarriage rate per pregnancy.

Comparison 3 Metformin versus clomiphene citrate, Outcome 6 Multiple pregnancy rate per woman.
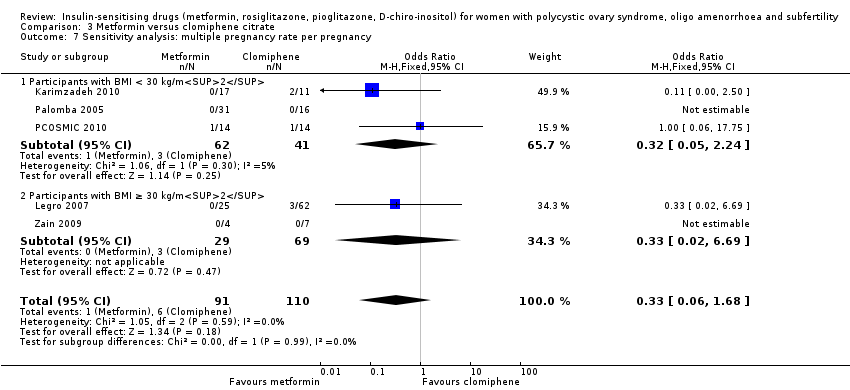
Comparison 3 Metformin versus clomiphene citrate, Outcome 7 Sensitivity analysis: multiple pregnancy rate per pregnancy.
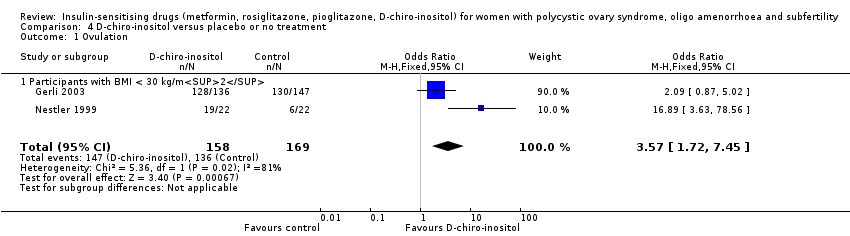
Comparison 4 D‐chiro‐inositol versus placebo or no treatment, Outcome 1 Ovulation.

Comparison 4 D‐chiro‐inositol versus placebo or no treatment, Outcome 2 Body mass index (kg/m2).

Comparison 4 D‐chiro‐inositol versus placebo or no treatment, Outcome 3 Waist‐hip ratio.

Comparison 4 D‐chiro‐inositol versus placebo or no treatment, Outcome 4 Blood pressure ‐ systolic (mm Hg).
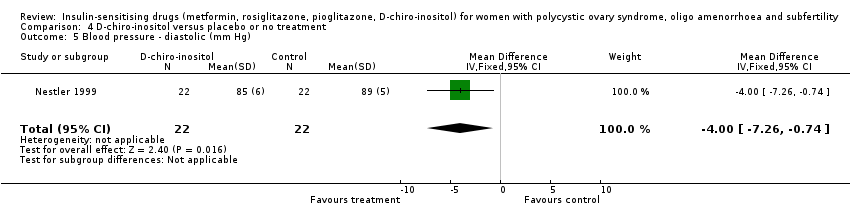
Comparison 4 D‐chiro‐inositol versus placebo or no treatment, Outcome 5 Blood pressure ‐ diastolic (mm Hg).

Comparison 4 D‐chiro‐inositol versus placebo or no treatment, Outcome 6 Serum testosterone (nmol/L).
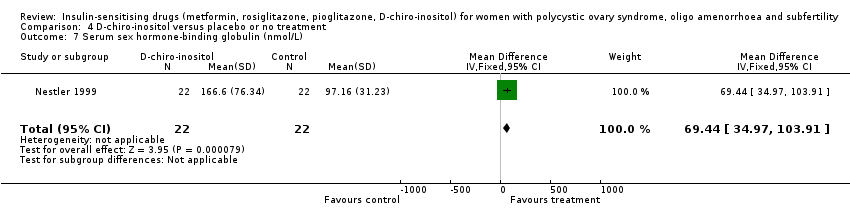
Comparison 4 D‐chiro‐inositol versus placebo or no treatment, Outcome 7 Serum sex hormone‐binding globulin (nmol/L).

Comparison 4 D‐chiro‐inositol versus placebo or no treatment, Outcome 8 Fasting glucose (mmol/L).

Comparison 4 D‐chiro‐inositol versus placebo or no treatment, Outcome 9 Fasting insulin (mIU/L).

Comparison 4 D‐chiro‐inositol versus placebo or no treatment, Outcome 10 Total cholesterol (mmol/L).

Comparison 4 D‐chiro‐inositol versus placebo or no treatment, Outcome 11 Triglyceride levels (mmol/L).

Comparison 5 Rosiglitazone versus placebo or no treatment, Outcome 1 Ovulation rate.

Comparison 5 Rosiglitazone versus placebo or no treatment, Outcome 2 Menstrual frequency.

Comparison 5 Rosiglitazone versus placebo or no treatment, Outcome 3 Body mass index (kg/m2).

Comparison 5 Rosiglitazone versus placebo or no treatment, Outcome 4 Waist‐hip ratio.

Comparison 5 Rosiglitazone versus placebo or no treatment, Outcome 5 Blood pressure ‐ systolic (mm Hg).

Comparison 5 Rosiglitazone versus placebo or no treatment, Outcome 6 Blood pressure ‐ diastolic (mm Hg).
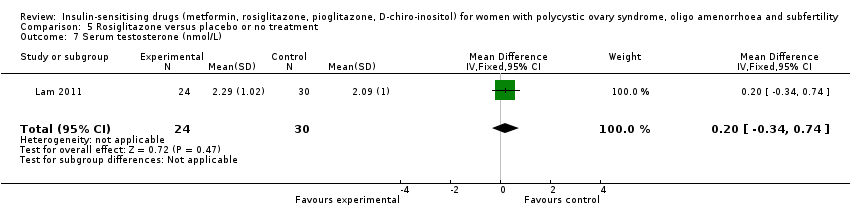
Comparison 5 Rosiglitazone versus placebo or no treatment, Outcome 7 Serum testosterone (nmol/L).
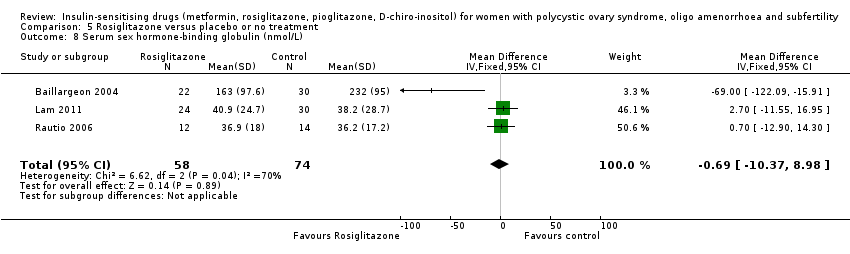
Comparison 5 Rosiglitazone versus placebo or no treatment, Outcome 8 Serum sex hormone‐binding globulin (nmol/L).

Comparison 5 Rosiglitazone versus placebo or no treatment, Outcome 9 Fasting glucose (mmol/L).

Comparison 5 Rosiglitazone versus placebo or no treatment, Outcome 10 Fasting insulin (mIU/L).

Comparison 5 Rosiglitazone versus placebo or no treatment, Outcome 11 Total cholesterol (mmol/L).

Comparison 5 Rosiglitazone versus placebo or no treatment, Outcome 12 Triglyceride levels (mmol/L).
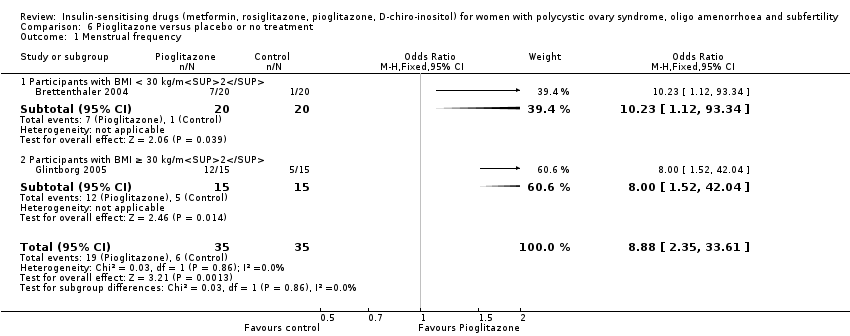
Comparison 6 Pioglitazone versus placebo or no treatment, Outcome 1 Menstrual frequency.

Comparison 6 Pioglitazone versus placebo or no treatment, Outcome 2 Body mass index (kg/m2).
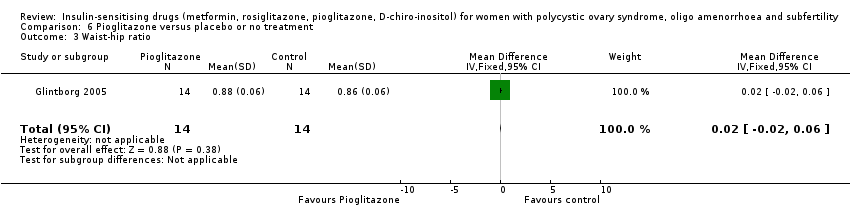
Comparison 6 Pioglitazone versus placebo or no treatment, Outcome 3 Waist‐hip ratio.

Comparison 6 Pioglitazone versus placebo or no treatment, Outcome 4 Serum testosterone (nmol/L).

Comparison 6 Pioglitazone versus placebo or no treatment, Outcome 5 Serum sex hormone‐binding globulin (nmol/L).

Comparison 6 Pioglitazone versus placebo or no treatment, Outcome 6 Fasting insulin (mIU/L).
| Metformin compared to placebo or no treatment for women with polycystic ovary syndrome, oligo amenorrhoea and subfertility | ||||||
| Patient or population: women with polycystic ovary syndrome, oligo amenorrhoea and subfertility | ||||||
| Outcomes | Illustrative comparative risks* (95% CI) | Relative effect | No of participants | Quality of the evidence | Comments | |
| Assumed risk | Corresponding risk | |||||
| Placebo or no treatment | Metformin | |||||
| Live birth rate per woman | 141 per 1000 | 208 per 1000 | OR 1.59 | 435 | ⊕⊕⊝⊝ | |
| Adverse events (gastrointestinal) per woman | 106 per 1000 | 362 per 1000 (267 to 469) | OR 4.76 (3.06 to 7.41) | 670 (7 studies) | ⊕⊕⊕⊝ | |
| Clinical pregnancy rate per woman | 110 per 1000 | 193 per 1000 | OR 1.93 | 1027 | ⊕⊕⊕⊝ | |
| Menstrual frequency per woman | 183 per 1000 | 278 per 1000 (203 to 368) | OR 1.72 (1.14 to 2.61) | 427 (7 studies) | ⊕⊕⊝⊝ | |
| Ovulation rate per woman | 200 per 1000 | 389 per 1000 | OR (1.81 to 3.59) | 701 | ⊕⊕⊕⊝ | |
| Miscarriage rate per woman | 40 per 1000 | 43per 1000 | OR 1.08 | 748 | ⊕⊕⊝⊝ | Miscarriage rate per pregnancy OR 0.58, 95% CI 0.25 to 1.34, 200 pregnancies |
| *The basis for the assumed risk is the median control group risk across studies. The corresponding risk (and its 95% confidence interval) is based on the assumed risk in the comparison group and the relative effect of the intervention (and its 95% CI). | ||||||
| GRADE Working Group grades of evidence High quality: we are very confident that the true effect lies close to that of the estimate of the effect Moderate quality: we are moderately confident in the effect estimate; the true effect is likely to be close to the estimate of effect, but there is a possibility that it is substantially different Low quality: our confidence in the effect estimate is limited; the true effect may be substantially different from the estimate of the effect Very low quality: we have very little confidence in the effect estimate; the true effect is likely to be substantially different from the estimate of effect | ||||||
| aDowngraded one level for serious risk of bias related to failure to report methods of randomisation and/or serious risk of attrition bias in some of the studies. | ||||||
| Metformin combined with clomiphene versus clomiphene alone for women with polycystic ovary syndrome | ||||||
| Population: women with polycystic ovary syndrome | ||||||
| Outcomes | Anticipated absolute effects* (95% CI) | Relative effect | № of participants | Quality of the evidence | Comments | |
| Risk with clomiphene alone | Risk with metformin combined with clomiphene | |||||
| Live birth rate per woman | 257 per 1000 | 295 per 1000 | OR 1.21 | 1079 | ⊕⊕⊝⊝ | |
| Adverse events (gastrointestinal) per woman | 134 per 1000 | 381 per 1000 | OR 3.97 | 591 | ⊕⊕⊕⊝ | |
| Clinical pregnancy rate per woman | 243 per 1000 | 338per 1000 | OR 1.59 | 1529 | ⊕⊕⊕⊝ | |
| Menstrual frequency per woman | Not reported by any of the included studies | |||||
| Ovulation rate per woman | 381per 1000 | 491 per 1000 | OR 1.57 (1.28 to 1.92) | 1624 | ⊕⊕⊕⊝ | |
| Miscarriage rate per woman | Median rates not calculable as there were no events in the control group in 5/8 studies | OR 1.59 | 1096 | ⊕⊕⊝⊝ | Miscarriage rate per pregnancy OR 1.30 95% CI 0.80 to 2.12, 400 pregnancies | |
| *The risk in the intervention group (and its 95% confidence interval) is based on the median risk in the comparison group and the relative effect of the intervention (and its 95% CI). | ||||||
| GRADE Working Group grades of evidence | ||||||
| aDowngraded one level for serious risk of bias related to failure to describe study methods and/or serious risk of attrition bias in several of the studies. | ||||||
| Metformin compared to clomiphene citrate for women with polycystic ovary syndrome | ||||||
| Population: women with polycystic ovary syndrome | ||||||
| Outcomes | Anticipated absolute effects* (95% CI) | Relative effect | № of participants | Quality of the evidence | Comments | |
| Risk with clomiphene citrate | Risk with metformin | |||||
| Live birth rate per woman Participants with BMI < 30 kg/m2 or ≤ 32 kg/m2a | 225 per 1000 | 171 per 1000 (124 to 227) | OR 1.71 (1.00 to 2.94) | 241 (3 studies) | ⊕⊝⊝⊝ very lowc,d | High heterogeneity (I2 = 78%) |
| Live birth rate per woman Participants with BMI ≥ 30 kg/m2a | 198 per 1000 | 69 per 1000 (40 to 114) | OR 0.30 (0.17 to 0.52) | 500 (2 studies) | ⊕⊝⊝⊝ | 74 events |
| Adverse events (gastrointestinal) | Not reported by any of the included studies | |||||
| Clinical pregnancy rate per woman Participants with BMI < 30 kg/m2 or ≤ 32 kg/m2a | 320 per 1000 | 423 per 1000 | OR 1.56 | 490 | ⊕⊝⊝⊝ | 103 events |
| Clinical pregnancy rate per woman Participants with BMI ≥ 30 kg/m2a | 234 per 1000 | 94 per 1000 | OR 0.34 | 500 | ⊕⊝⊝⊝ | 98 events |
| Menstrual frequency | Not reported by any of the included studies | |||||
| Ovulation rate per woman Participants with BMI < 30 kg/m2b | 625 per 1000 | 574 per 1000 | OR 0.81 | 312 | ⊕⊕⊝⊝ | |
| Ovulation rate per woman Participants with BMI ≥ 30 kg/m2b | 534per 1000 | 250per 1,000 | OR 0.29 | 500 | ⊕⊕⊝⊝ | |
| Miscarriage rate per woman | 29 per 1000 | 26 per 1000 (15 to 47) | OR 0.92 (0.50 to 1.67) | 741 | ⊕⊝⊝⊝ very lowc,e | High heterogeneity (I2 = 52%) |
| *The risk in the intervention group (and its 95% confidence interval) is based on the median risk in the comparison group and the relative effect of the intervention (and its 95% CI). | ||||||
| GRADE Working Group grades of evidence | ||||||
| aData subgrouped by BMI, as pooling of BMI groups resulted in high heterogeneity (I2 > 85%) with differing directions of effect. | ||||||
| Abbreviation | Definition |
| BMI | Body mass index |
| CC | Clomiphene citrate |
| CI | Confidence interval |
| CT | Computerised tomography scan |
| DHEAS | Dehydroepiandrosterone sulphate |
| FSH | Follicle stimulating hormone |
| GTT | Glucose tolerance test |
| HbA1C | Glycosylated haemoglobin |
| HDL | High‐density lipoprotein cholesterol |
| IGFBP‐1 | Insulin growth factor binding protein 1 |
| LDL | Low‐density lipoprotein cholesterol |
| LH | Luteinising hormone |
| NIDDM | Non insulin dependent diabetes mellitus |
| PAI‐1 | Plasminogen activator inhibitor 1 |
| PCO | Polycystic ovary |
| PCOS | Polycystic ovary syndrome |
| RCT | Randomised controlled trial |
| rFSH | Recombinant follicle stimulating hormone |
| SD | Standard deviation |
| SE | Standard error of the mean |
| SHBG | Sex hormone‐binding globulin |
| VLDL | Very low density lipoprotein cholesterol |
| vs | Versus |
| MD | Mean difference |
| Convert from | Convert to | Conversion factor | |
| Cholesterol | mg/dL | mmol/L | 0.026 |
| Triglycerides | mg/dL | mmol/L | 0.11 |
| Insulin | pmol/L | mIU/L (= microIU/mL) | 0.1667 |
| Glucose | mg/dL | mmol/L | 0.056 |
| Progesterone | ng/mL | nmol/L | 3.18 |
| Testosterone | ng/dL | nmol/L | 0.03467 |
| Androstenedione | ng/dL | nmol/L | 0.0349 |
| Estradiol | ng/dL | pmol/L | 36.71 |
| 17‐beta oestradiol | ng/dL | pmol/L | 36.71 |
| Dehydroepiandrosterone sulphate | microg/dL | micromol/L | 0.02714 |
| Sex hormone‐binding globulin | microg/dL | nmol/L | 34.7 |
| Standard deviation | Standard error | Standard deviation | Sqrt n |
| Confidence intervals | Confidence intervals | Standard error | (upper limit ‐ lower limit)/3.92 |
| Study ID | Metformin | Placebo | P value | ||
| Events | Cycles | Events | Cycles | ||
| BMI < 30 kg/m2 | |||||
| 27 | 32 | 11 | 32 | ||
| 7 | 12 | 3 | 12 | ||
| 3 | 9 | 3 | 9 | ||
| 17 | 153 | 20 | 150 | ||
| 6 | 16 | 1 | 16 | ||
| BMI ≥ 30 kg/m2 | |||||
| 37 | 45 | 30 | 47 | ||
| 3 | 9 | 6 | 11 | ||
| 4 | 9 | 3 | 9 | ||
| 8 | 28 | 0 | 28 | ||
| 9 | 22 | 9 | 22 | ||
| 12 | 35 | 1 | 26 | ||
| 5 | 63 | 5 | 51 | ||
| 7 | 14 | 6 | 15 | ||
| 17 | 32 | 13 | 33 | ||
| 0 | 12 | 1 | 14 | ||
| 1 | 12 | 1 | 15 | ||
| Study ID | Metformin + | Clomiphene | P value | ||
| Events | Cycles | Events | Cycles | ||
| BMI < 30 kg/m2 | |||||
| 16 | 21 | 8 | 21 | ||
| 10 | 16 | 6 | 16 | ||
| 17 | 32 | 10 | 31 | ||
| 35 | 45 | 29 | 45 | ||
| 17 | 40 | 5 | 40 | ||
| 15 | 21 | 5 | 15 | ||
| 11 | 16 | 3 | 12 | ||
| 84 | 141 | 98 | 168 | ||
| 4 | 9 | 1 | 9 | ||
| 27 | 35 | 23 | 36 | ||
| BMI ≥ 30 kg/m2 | |||||
| 26 | 28 | 22 | 28 | ||
| 7 | 16 | 1 | 15 | ||
| 582 | 964 | 462 | 942 | ||
| 19 | 21 | 2 | 25 | ||
| 38 | 51 | 34 | 55 | ||
| 34 | 52 | 36 | 55 | ||
| 5 | 12 | 4 | 14 | ||
| 9 | 12 | 4 | 15 | ||
| 38 | 41 | 24 | 41 | ||
| Metformin | Clomiphene citrate | ||||
| Study ID | Events | Cycles | Events | Cycles | P value |
| BMI < 30 kg/m2 | |||||
| 129 | 205 | 148 | 221 | ||
| 23 | 35 | 23 | 36 | ||
| BMI ≥ 30 kg/m2 | |||||
| 296 | 1019 | 462 | 942 | ||
| 4 | 42 | 7 | 41 | ||
| Inositol | Placebo | ||||
| Study ID | Events | Cycles | Events | Cycles | P value |
| BMI < 30 kg/m2 | |||||
| 128 | 136 | 130 | 147 | ||
| 19 | 22 | 6 | 22 | ||
| Rosiglitazone | Placebo | ||||
| Study ID | Events | Cycles | Events | Cycles | P value |
| BMI ≥ 30 kg/m2 | |||||
| 16 | 32 | 11 | 32 | ||
| Outcome or subgroup title | No. of studies | No. of participants | Statistical method | Effect size |
| 1 Live birth rate Show forest plot | 4 | 435 | Odds Ratio (M‐H, Fixed, 95% CI) | 1.59 [1.00, 2.51] |
| 1.1 Participants with BMI < 30 kg/m2 | 3 | 370 | Odds Ratio (M‐H, Fixed, 95% CI) | 1.51 [0.94, 2.44] |
| 1.2 Participants with BMI ≥ 30 kg/m2 | 1 | 65 | Odds Ratio (M‐H, Fixed, 95% CI) | 2.87 [0.51, 16.01] |
| 2 Adverse events (gastrointestinal side effects) Show forest plot | 7 | 670 | Odds Ratio (M‐H, Fixed, 95% CI) | 4.76 [3.06, 7.41] |
| 2.1 Participants with BMI < 30 kg/m2 | 4 | 393 | Odds Ratio (M‐H, Fixed, 95% CI) | 5.61 [2.89, 10.88] |
| 2.2 Participants with BMI ≥ 30 kg/m2 | 3 | 277 | Odds Ratio (M‐H, Fixed, 95% CI) | 4.13 [2.28, 7.49] |
| 3 Clinical pregnancy rate Show forest plot | 9 | 1027 | Odds Ratio (M‐H, Fixed, 95% CI) | 1.93 [1.42, 2.64] |
| 3.1 Participants with BMI < 30 kg/m2 | 5 | 733 | Odds Ratio (M‐H, Fixed, 95% CI) | 1.89 [1.35, 2.65] |
| 3.2 Participants with BMI ≥ 30 kg/m2 | 4 | 294 | Odds Ratio (M‐H, Fixed, 95% CI) | 2.21 [0.98, 4.98] |
| 4 Ovulation rate Show forest plot | 14 | 701 | Odds Ratio (M‐H, Fixed, 95% CI) | 2.55 [1.81, 3.59] |
| 4.1 Participants with BMI < 30 kg/m2 | 5 | 229 | Odds Ratio (M‐H, Fixed, 95% CI) | 4.15 [2.31, 7.45] |
| 4.2 Participants with BMI ≥ 30 kg/m2 | 10 | 472 | Odds Ratio (M‐H, Fixed, 95% CI) | 1.96 [1.28, 3.01] |
| 5 Menstrual frequency Show forest plot | 7 | 427 | Odds Ratio (M‐H, Fixed, 95% CI) | 1.72 [1.14, 2.61] |
| 5.1 Participants with BMI < 30 kg/m2 | 1 | 23 | Odds Ratio (M‐H, Fixed, 95% CI) | 21.15 [1.01, 445.00] |
| 5.2 Participants with BMI ≥ 30 kg/m2 | 6 | 404 | Odds Ratio (M‐H, Fixed, 95% CI) | 1.57 [1.03, 2.41] |
| 6 Miscarriage rate per woman Show forest plot | 4 | 748 | Odds Ratio (M‐H, Fixed, 95% CI) | 1.08 [0.50, 2.35] |
| 6.1 Participants with BMI < 30 kg/m2 | 3 | 683 | Odds Ratio (M‐H, Fixed, 95% CI) | 1.19 [0.52, 2.71] |
| 6.2 Participants with BMI ≥ 30 kg/m2 | 1 | 65 | Odds Ratio (M‐H, Fixed, 95% CI) | 0.5 [0.04, 5.80] |
| 7 Sensitivity analysis: miscarriage rate per pregnancy Show forest plot | 4 | 200 | Odds Ratio (M‐H, Fixed, 95% CI) | 0.58 [0.25, 1.34] |
| 7.1 Participants with BMI < 30 kg/m2 | 3 | 188 | Odds Ratio (M‐H, Fixed, 95% CI) | 0.63 [0.26, 1.53] |
| 7.2 Participants with BMI ≥ 30 kg/m2 | 1 | 12 | Odds Ratio (M‐H, Fixed, 95% CI) | 0.25 [0.02, 4.00] |
| 8 Body mass index (kg/m2) Show forest plot | 16 | 827 | Mean Difference (IV, Fixed, 95% CI) | ‐0.08 [‐0.33, 0.17] |
| 8.1 Participants with BMI < 30 kg/m2 | 7 | 419 | Mean Difference (IV, Fixed, 95% CI) | ‐0.06 [‐0.33, 0.21] |
| 8.2 Participants with BMI ≥ 30 kg/m2 | 10 | 408 | Mean Difference (IV, Fixed, 95% CI) | ‐0.20 [‐0.92, 0.52] |
| 9 Waist‐hip ratio Show forest plot | 11 | 702 | Mean Difference (IV, Fixed, 95% CI) | ‐0.01 [‐0.01, ‐0.00] |
| 9.1 Participants with BMI < 30 kg/m2 | 5 | 389 | Mean Difference (IV, Fixed, 95% CI) | ‐0.01 [‐0.01, ‐0.00] |
| 9.2 Participants with BMI ≥ 30 kg/m2 | 6 | 313 | Mean Difference (IV, Fixed, 95% CI) | ‐0.01 [‐0.02, 0.01] |
| 10 Blood pressure ‐ systolic (mm Hg) Show forest plot | 7 | 379 | Mean Difference (IV, Fixed, 95% CI) | ‐3.59 [‐5.13, ‐2.04] |
| 10.1 Participants with BMI < 30 kg/m2 | 3 | 96 | Mean Difference (IV, Fixed, 95% CI) | ‐3.52 [‐5.29, ‐1.76] |
| 10.2 Participants with BMI ≥ 30 kg/m2 | 5 | 283 | Mean Difference (IV, Fixed, 95% CI) | ‐3.80 [‐5.00, ‐0.60] |
| 11 Blood pressure ‐ diastolic (mm Hg) Show forest plot | 6 | 292 | Mean Difference (IV, Fixed, 95% CI) | ‐0.14 [‐1.35, 1.07] |
| 11.1 Participants with BMI < 30 kg/m2 | 3 | 96 | Mean Difference (IV, Fixed, 95% CI) | ‐0.21 [‐1.55, 1.13] |
| 11.2 Participants with BMI ≥ 30 kg/m2 | 4 | 196 | Mean Difference (IV, Fixed, 95% CI) | 0.18 [‐2.65, 3.02] |
| 12 Serum testosterone (nmol/L) Show forest plot | 15 | 863 | Mean Difference (IV, Fixed, 95% CI) | ‐0.49 [‐0.59, ‐0.39] |
| 12.1 Participants with BMI < 30 kg/m2 | 7 | 419 | Mean Difference (IV, Fixed, 95% CI) | ‐0.71 [‐0.86, ‐0.56] |
| 12.2 Participants with BMI ≥ 30 kg/m2 | 9 | 444 | Mean Difference (IV, Fixed, 95% CI) | ‐0.29 [‐0.44, ‐0.15] |
| 13 Serum sex hormone‐binding globulin (nmol/L) Show forest plot | 15 | 823 | Mean Difference (IV, Fixed, 95% CI) | 0.49 [‐1.82, 2.81] |
| 13.1 Participants with BMI < 30 kg/m2 | 6 | 387 | Mean Difference (IV, Fixed, 95% CI) | ‐0.22 [‐6.73, 6.28] |
| 13.2 Participants with BMI ≥ 30 kg/m2 | 10 | 436 | Mean Difference (IV, Fixed, 95% CI) | 0.60 [‐1.88, 3.07] |
| 14 Fasting glucose (mmol/L) Show forest plot | 15 | 849 | Mean Difference (IV, Fixed, 95% CI) | ‐0.14 [‐0.21, ‐0.07] |
| 14.1 Participants with BMI < 30 kg/m2 | 5 | 364 | Mean Difference (IV, Fixed, 95% CI) | ‐0.13 [‐0.22, ‐0.04] |
| 14.2 Participants with BMI ≥ 30 kg/m2 | 11 | 485 | Mean Difference (IV, Fixed, 95% CI) | ‐0.16 [‐0.27, ‐0.05] |
| 15 Fasting insulin (mIU/L) Show forest plot | 14 | 573 | Mean Difference (IV, Fixed, 95% CI) | ‐4.13 [‐5.67, ‐2.58] |
| 15.1 Participants with BMI < 30 kg/m2 | 4 | 85 | Mean Difference (IV, Fixed, 95% CI) | ‐6.20 [‐8.56, ‐3.84] |
| 15.2 Participants with BMI ≥ 30 kg/m2 | 11 | 488 | Mean Difference (IV, Fixed, 95% CI) | ‐2.57 [‐4.62, ‐0.53] |
| 16 Total cholesterol (mmol/L) Show forest plot | 10 | 562 | Mean Difference (IV, Fixed, 95% CI) | ‐0.14 [‐0.31, 0.02] |
| 16.1 Participants with BMI < 30 kg/m2 | 5 | 276 | Mean Difference (IV, Fixed, 95% CI) | ‐0.02 [‐0.26, 0.22] |
| 16.2 Participants with BMI ≥ 30 kg/m2 | 6 | 286 | Mean Difference (IV, Fixed, 95% CI) | ‐0.26 [‐0.48, ‐0.03] |
| 17 Triglyceride levels (mmol/L) Show forest plot | 7 | 309 | Mean Difference (IV, Fixed, 95% CI) | 0.14 [‐0.05, 0.32] |
| 17.1 Participants with BMI < 30 kg/m2 | 3 | 53 | Mean Difference (IV, Fixed, 95% CI) | 0.00 [‐0.33, 0.34] |
| 17.2 Participants with BMI ≥ 30 kg/m2 | 5 | 256 | Mean Difference (IV, Fixed, 95% CI) | 0.20 [‐0.02, 0.42] |
| Outcome or subgroup title | No. of studies | No. of participants | Statistical method | Effect size |
| 1 Live birth rate Show forest plot | 9 | 1079 | Odds Ratio (M‐H, Fixed, 95% CI) | 1.21 [0.92, 1.59] |
| 1.1 Participants with BMI < 30 kg/m2 or ≤ 32 kg/m2 | 5 | 531 | Odds Ratio (M‐H, Fixed, 95% CI) | 1.14 [0.78, 1.67] |
| 1.2 Participants with BMI ≥ 30 kg/m2 | 4 | 548 | Odds Ratio (M‐H, Fixed, 95% CI) | 1.28 [0.86, 1.91] |
| 2 Adverse events Show forest plot | 3 | 591 | Odds Ratio (M‐H, Fixed, 95% CI) | 3.97 [2.59, 6.08] |
| 2.1 Participants with BMI < 30 kg/m2 | 3 | 591 | Odds Ratio (M‐H, Fixed, 95% CI) | 3.97 [2.59, 6.08] |
| 3 Clinical pregnancy rate Show forest plot | 16 | 1529 | Odds Ratio (M‐H, Fixed, 95% CI) | 1.59 [1.27, 1.99] |
| 3.1 Participants with BMI < 30 kg/m2 | 9 | 834 | Odds Ratio (M‐H, Fixed, 95% CI) | 1.46 [1.08, 1.98] |
| 3.2 Participants with BMI ≥ 30 kg/m2 | 7 | 695 | Odds Ratio (M‐H, Fixed, 95% CI) | 1.76 [1.26, 2.47] |
| 4 Ovulation rate Show forest plot | 21 | 1624 | Odds Ratio (M‐H, Fixed, 95% CI) | 1.57 [1.28, 1.92] |
| 4.1 BMI < 30 kg/m2 | 11 | 755 | Odds Ratio (M‐H, Fixed, 95% CI) | 1.79 [1.32, 2.41] |
| 4.2 BMI ≥ 30 kg/m2 | 9 | 814 | Odds Ratio (M‐H, Fixed, 95% CI) | 1.52 [1.15, 2.01] |
| 4.3 BMI not reported | 1 | 55 | Odds Ratio (M‐H, Fixed, 95% CI) | 0.43 [0.13, 1.37] |
| 5 Ovulation rate: subgroup analysis by sensitivity to clomiphene citrate Show forest plot | 7 | 271 | Odds Ratio (M‐H, Fixed, 95% CI) | 4.69 [2.61, 8.44] |
| 5.1 PCOS and clomiphene‐sensitive | 1 | 56 | Odds Ratio (M‐H, Fixed, 95% CI) | 3.55 [0.65, 19.37] |
| 5.2 PCOS and clomiphene‐resistant | 6 | 215 | Odds Ratio (M‐H, Fixed, 95% CI) | 4.89 [2.62, 9.13] |
| 6 Miscarriage rate per woman Show forest plot | 9 | 1096 | Odds Ratio (M‐H, Fixed, 95% CI) | 1.59 [1.03, 2.46] |
| 6.1 Participants with BMI < 30 kg/m2 | 5 | 548 | Odds Ratio (M‐H, Fixed, 95% CI) | 1.41 [0.76, 2.62] |
| 6.2 Participants with BMI ≥ 30 kg/m2 | 4 | 548 | Odds Ratio (M‐H, Fixed, 95% CI) | 1.79 [0.97, 3.32] |
| 7 Sensitivity analysis: miscarriage rate per pregnancy Show forest plot | 8 | 400 | Odds Ratio (M‐H, Fixed, 95% CI) | 1.30 [0.80, 2.12] |
| 7.1 Participants with BMI < 30 kg/m2 | 4 | 228 | Odds Ratio (M‐H, Fixed, 95% CI) | 1.27 [0.65, 2.51] |
| 7.2 Participants with BMI ≥ 30 kg/m2 | 4 | 172 | Odds Ratio (M‐H, Fixed, 95% CI) | 1.34 [0.67, 2.68] |
| 8 Multiple pregnancy rate per woman Show forest plot | 6 | 1003 | Odds Ratio (M‐H, Fixed, 95% CI) | 0.56 [0.18, 1.68] |
| 8.1 Participants with BMI < 30 kg/m2 | 3 | 476 | Odds Ratio (M‐H, Fixed, 95% CI) | 0.50 [0.12, 2.04] |
| 8.2 Participants with BMI ≥ 30kg/m2 | 3 | 527 | Odds Ratio (M‐H, Fixed, 95% CI) | 0.66 [0.11, 4.01] |
| 9 Senstivity analysis: multiple pregnancy rate per pregnancy Show forest plot | 6 | 342 | Odds Ratio (M‐H, Fixed, 95% CI) | 0.46 [0.15, 1.42] |
| 9.1 Participants with BMI < 30 kg/m2 | 3 | 178 | Odds Ratio (M‐H, Fixed, 95% CI) | 0.43 [0.10, 1.85] |
| 9.2 Participants with BMI ≥ 30 kg/m2 | 3 | 164 | Odds Ratio (M‐H, Fixed, 95% CI) | 0.50 [0.08, 3.12] |
| Outcome or subgroup title | No. of studies | No. of participants | Statistical method | Effect size |
| 1 Live birth Show forest plot | 5 | 741 | Odds Ratio (M‐H, Fixed, 95% CI) | 0.71 [0.49, 1.01] |
| 1.1 Participants with BMI < 30 kg/m2 | 3 | 241 | Odds Ratio (M‐H, Fixed, 95% CI) | 1.71 [1.00, 2.94] |
| 1.2 Participants with BMI ≥ 30 kg/m2 | 2 | 500 | Odds Ratio (M‐H, Fixed, 95% CI) | 0.30 [0.17, 0.52] |
| 2 Clinical pregnancy rate Show forest plot | 7 | Odds Ratio (M‐H, Fixed, 95% CI) | Subtotals only | |
| 2.1 Participants with BMI < 30 kg/m2 | 5 | 490 | Odds Ratio (M‐H, Fixed, 95% CI) | 1.56 [1.05, 2.33] |
| 2.2 Participants with BMI ≥ 30 kg/m2 | 2 | 500 | Odds Ratio (M‐H, Fixed, 95% CI) | 0.34 [0.21, 0.55] |
| 3 Ovulation rate Show forest plot | 6 | Odds Ratio (M‐H, Fixed, 95% CI) | Subtotals only | |
| 3.1 Participants with BMI < 30 kg/m2 | 4 | 312 | Odds Ratio (M‐H, Fixed, 95% CI) | 0.81 [0.51, 1.28] |
| 3.2 Participants with BMI ≥ 30 kg/m2 | 2 | 500 | Odds Ratio (M‐H, Fixed, 95% CI) | 0.29 [0.20, 0.43] |
| 4 Miscarriage rate per woman Show forest plot | 5 | 741 | Odds Ratio (M‐H, Fixed, 95% CI) | 0.92 [0.50, 1.67] |
| 4.1 Participants with BMI < 30 kg/m2 | 3 | 241 | Odds Ratio (M‐H, Fixed, 95% CI) | 1.58 [0.61, 4.09] |
| 4.2 Participants with BMI ≥ 30 kg/m2 | 2 | 500 | Odds Ratio (M‐H, Fixed, 95% CI) | 0.61 [0.27, 1.38] |
| 5 Sensitivity analysis: miscarriage rate per pregnancy Show forest plot | 5 | Odds Ratio (M‐H, Fixed, 95% CI) | Totals not selected | |
| 5.1 Participants with BMI < 30 kg/m2 | 3 | Odds Ratio (M‐H, Fixed, 95% CI) | 0.0 [0.0, 0.0] | |
| 5.2 Participants with BMI ≥ 30 kg/m2 | 2 | Odds Ratio (M‐H, Fixed, 95% CI) | 0.0 [0.0, 0.0] | |
| 6 Multiple pregnancy rate per woman Show forest plot | 5 | 858 | Odds Ratio (M‐H, Fixed, 95% CI) | 0.29 [0.06, 1.43] |
| 6.1 Participants with BMI < 30 kg/m2 | 3 | 358 | Odds Ratio (M‐H, Fixed, 95% CI) | 0.46 [0.07, 3.16] |
| 6.2 Participants with BMI ≥ 30 kg/m2 | 2 | 500 | Odds Ratio (M‐H, Fixed, 95% CI) | 0.14 [0.01, 2.76] |
| 7 Sensitivity analysis: multiple pregnancy rate per pregnancy Show forest plot | 5 | 201 | Odds Ratio (M‐H, Fixed, 95% CI) | 0.33 [0.06, 1.68] |
| 7.1 Participants with BMI < 30 kg/m2 | 3 | 103 | Odds Ratio (M‐H, Fixed, 95% CI) | 0.32 [0.05, 2.24] |
| 7.2 Participants with BMI ≥ 30 kg/m2 | 2 | 98 | Odds Ratio (M‐H, Fixed, 95% CI) | 0.33 [0.02, 6.69] |
| Outcome or subgroup title | No. of studies | No. of participants | Statistical method | Effect size |
| 1 Ovulation Show forest plot | 2 | 327 | Odds Ratio (M‐H, Fixed, 95% CI) | 3.57 [1.72, 7.45] |
| 1.1 Participants with BMI < 30 kg/m2 | 2 | 327 | Odds Ratio (M‐H, Fixed, 95% CI) | 3.57 [1.72, 7.45] |
| 2 Body mass index (kg/m2) Show forest plot | 1 | 44 | Mean Difference (IV, Fixed, 95% CI) | 0.5 [‐0.86, 1.86] |
| 3 Waist‐hip ratio Show forest plot | 1 | 44 | Mean Difference (IV, Fixed, 95% CI) | ‐0.01 [‐0.05, 0.03] |
| 4 Blood pressure ‐ systolic (mm Hg) Show forest plot | 1 | 44 | Mean Difference (IV, Fixed, 95% CI) | ‐2.0 [‐5.85, 1.85] |
| 5 Blood pressure ‐ diastolic (mm Hg) Show forest plot | 1 | 44 | Mean Difference (IV, Fixed, 95% CI) | ‐4.0 [‐7.26, ‐0.74] |
| 6 Serum testosterone (nmol/L) Show forest plot | 1 | 44 | Mean Difference (IV, Fixed, 95% CI) | ‐0.63 [‐1.37, 0.11] |
| 7 Serum sex hormone‐binding globulin (nmol/L) Show forest plot | 1 | 44 | Mean Difference (IV, Fixed, 95% CI) | 69.44 [34.97, 103.91] |
| 8 Fasting glucose (mmol/L) Show forest plot | 1 | 44 | Mean Difference (IV, Fixed, 95% CI) | ‐0.28 [‐0.99, 0.43] |
| 9 Fasting insulin (mIU/L) Show forest plot | 1 | 44 | Mean Difference (IV, Fixed, 95% CI) | ‐20.0 [‐43.43, 3.43] |
| 10 Total cholesterol (mmol/L) Show forest plot | 1 | 44 | Mean Difference (IV, Fixed, 95% CI) | ‐0.23 [‐0.99, 0.53] |
| 11 Triglyceride levels (mmol/L) Show forest plot | 1 | 44 | Mean Difference (IV, Fixed, 95% CI) | ‐2.20 [‐6.23, 1.83] |
| Outcome or subgroup title | No. of studies | No. of participants | Statistical method | Effect size |
| 1 Ovulation rate Show forest plot | 1 | 64 | Odds Ratio (M‐H, Fixed, 95% CI) | 1.91 [0.70, 5.22] |
| 1.1 Participants with BMI ≥ 30 kg/m2 | 1 | 64 | Odds Ratio (M‐H, Fixed, 95% CI) | 1.91 [0.70, 5.22] |
| 2 Menstrual frequency Show forest plot | 2 | 100 | Odds Ratio (M‐H, Fixed, 95% CI) | 5.59 [2.20, 14.19] |
| 3 Body mass index (kg/m2) Show forest plot | 3 | 132 | Mean Difference (IV, Fixed, 95% CI) | 0.68 [0.40, 0.96] |
| 4 Waist‐hip ratio Show forest plot | 3 | 132 | Mean Difference (IV, Fixed, 95% CI) | ‐0.01 [‐0.02, ‐0.00] |
| 5 Blood pressure ‐ systolic (mm Hg) Show forest plot | 1 | 52 | Mean Difference (IV, Fixed, 95% CI) | ‐2.0 [‐3.95, ‐0.05] |
| 6 Blood pressure ‐ diastolic (mm Hg) Show forest plot | 1 | 52 | Mean Difference (IV, Fixed, 95% CI) | ‐0.20 [‐1.72, 1.32] |
| 7 Serum testosterone (nmol/L) Show forest plot | 1 | 54 | Mean Difference (IV, Fixed, 95% CI) | 0.20 [‐0.34, 0.74] |
| 8 Serum sex hormone‐binding globulin (nmol/L) Show forest plot | 3 | 132 | Mean Difference (IV, Fixed, 95% CI) | ‐0.69 [‐10.37, 8.98] |
| 9 Fasting glucose (mmol/L) Show forest plot | 3 | 132 | Mean Difference (IV, Fixed, 95% CI) | ‐0.21 [‐0.39, ‐0.04] |
| 10 Fasting insulin (mIU/L) Show forest plot | 2 | 80 | Mean Difference (IV, Fixed, 95% CI) | ‐3.98 [‐9.38, 1.42] |
| 11 Total cholesterol (mmol/L) Show forest plot | 2 | 80 | Mean Difference (IV, Fixed, 95% CI) | ‐0.20 [‐0.21, ‐0.19] |
| 12 Triglyceride levels (mmol/L) Show forest plot | 1 | 26 | Mean Difference (IV, Fixed, 95% CI) | 1.0 [0.89, 1.11] |
| Outcome or subgroup title | No. of studies | No. of participants | Statistical method | Effect size |
| 1 Menstrual frequency Show forest plot | 2 | 70 | Odds Ratio (M‐H, Fixed, 95% CI) | 8.88 [2.35, 33.61] |
| 1.1 Participants with BMI < 30 kg/m2 | 1 | 40 | Odds Ratio (M‐H, Fixed, 95% CI) | 10.23 [1.12, 93.34] |
| 1.2 Participants with BMI ≥ 30 kg/m2 | 1 | 30 | Odds Ratio (M‐H, Fixed, 95% CI) | 8.0 [1.52, 42.04] |
| 2 Body mass index (kg/m2) Show forest plot | 2 | 63 | Mean Difference (IV, Fixed, 95% CI) | 0.91 [‐1.88, 3.70] |
| 3 Waist‐hip ratio Show forest plot | 1 | 28 | Mean Difference (IV, Fixed, 95% CI) | 0.02 [‐0.02, 0.06] |
| 4 Serum testosterone (nmol/L) Show forest plot | 2 | 63 | Mean Difference (IV, Fixed, 95% CI) | ‐0.12 [‐0.53, 0.29] |
| 5 Serum sex hormone‐binding globulin (nmol/L) Show forest plot | 2 | 63 | Mean Difference (IV, Fixed, 95% CI) | 2.75 [‐5.26, 10.77] |
| 6 Fasting insulin (mIU/L) Show forest plot | 2 | 63 | Mean Difference (IV, Fixed, 95% CI) | ‐1.46 [‐3.97, 1.06] |