Fármacos sensibilizadores de insulina (metformina, rosiglitazona, pioglitazona, D‐quiro‐inositol) para las mujeres con síndrome de ovario poliquístico, oligoamenorrea y subfertilidad
Información
- DOI:
- https://doi.org/10.1002/14651858.CD003053.pub6Copiar DOI

- Base de datos:
-
- Cochrane Database of Systematic Reviews
- Versión publicada:
-
- 28 noviembre 2017see what's new
- Tipo:
-
- Intervention
- Etapa:
-
- Review
- Grupo Editorial Cochrane:
-
Grupo Cochrane de Ginecología y fertilidad
- Copyright:
-
- Copyright © 2018 The Cochrane Collaboration. Published by John Wiley & Sons, Ltd.
Cifras del artículo
Altmetric:
Citado por:
Autores
Contributions of authors
LCM: literature search, assessment of trials, data collection, revising and preparing the review (2017 version)
TT: checking the literature search, secondary assessment of trials and data analysis in the updated review (May 2008 to January 2017). Preparation of the previous reviews (2009 and 2012 versions)
EY: checking the literature search and secondary assessment of trials (2009, 2012 and 2017 versions)
RN: read, commented on and approved the draft review (2009, 2012 and 2017 versions)
AB: secondary assessment of trials and quality analysis. Revising and finalising the review (2009, 2012 and 2017 versions)
Sources of support
Internal sources
-
Peninsula Medical School, UK.
-
University of Adelaide, Australia.
-
Leeds Centre of Reproductive Medicine, Leeds, UK.
External sources
-
No sources of support supplied
Declarations of interest
LCM: none known
TT: received consultancy fee from Finox Biotech for advisory board meeting in 2016; Finox do not manufacture insulin sensitisers.
EY: received travel costs and meeting expenses to attend Ferring advisory board in 2017; Ferring do not manufacture insulin sensitisers.
RN: received consultancy fee from Ferring for advisory board meeting; Ferring do not manufacture insulin sensitisers.
AB: NHS Consultant in Reproductive Medicine and clinical lead for the Leeds Centre for Reproductive Medicine, which performs all fertility treatments funded by the NHS; partner in Genesis LLP, the private arm on the Leeds Centre for Reproductive Medicine, which performs all self‐funded fertility treatments using identical protocols to the NHS; Chair, Clinical Board, IVI, UK; Chair, British Fertility Society; Chair, NHS England IVF Pricing Development Expert Advisory Group; Chair, World Health Organization Expert Working Group on Global Infertility Guidelines, Management of PCOS; consultant for ad hoc advisory boards for Ferring Pharmaceuticals, Astra Zeneca, Merck Serono, IBSA, Clear Blue, Gideon Richter, Uteron Pharma & former member of ethics committee for OvaScience. Merck manufacture some products containing metformin.
Acknowledgements
The authors wish to thank Cochrane Pregnancy and Childbirth for their assistance with developing this systematic review. We also thank Dr Machado and Professor Morin‐Papunen for answering email queries regarding their studies.
We would also like to thank the corresponding authors of the following trials who took time to respond to our requests for further data, some of whom took the trouble to perform repeat analyses for us:
Chou 2003; Fleming 2002; Glintborg 2005; Hoeger 2004; Hwu 2005; Jakubowicz 2001; Ladson 2011; Legro 2007; Lord 2006; Malkawi 2002; Moghetti 2000; Morin‐Papunen 2012; Nestler 1997; Nestler 1999; Ng 2001; Rautio 2006; Sturrock 2002; Trolle 2007; Vandermolen 2001; Yarali 2002.
We would also like to thank the Cochrane Menstrual Disorders and Subfertility Review Group in Auckland (now Cochrane Gynaecology and Fertility), and in particular their Managing Editor (to 2011) Jane Clarke, for all their help and support. We are also grateful to Rafael Perera of the UK Cochrane Centre for statistical advice.
The authors of the 2017 update wish to thank Dr Jonathan Lord for his contributions to all previous versions of this review.
Version history
| Published | Title | Stage | Authors | Version |
| 2017 Nov 28 | Insulin‐sensitising drugs (metformin, rosiglitazone, pioglitazone, D‐chiro‐inositol) for women with polycystic ovary syndrome, oligo amenorrhoea and subfertility | Review | Lara C Morley, Thomas Tang, Ephia Yasmin, Robert J Norman, Adam H Balen | |
| 2012 May 16 | Insulin‐sensitising drugs (metformin, rosiglitazone, pioglitazone, D‐chiro‐inositol) for women with polycystic ovary syndrome, oligo amenorrhoea and subfertility | Review | Thomas Tang, Jonathan M Lord, Robert J Norman, Ephia Yasmin, Adam H Balen | |
| 2010 Jan 20 | Insulin‐sensitising drugs (metformin, rosiglitazone, pioglitazone, D‐chiro‐inositol) for women with polycystic ovary syndrome, oligo amenorrhoea and subfertility | Review | Thomas Tang, Jonathan M Lord, Robert J Norman, Ephia Yasmin, Adam H Balen | |
| 2009 Oct 07 | Insulin‐sensitising drugs (metformin, rosiglitazone, pioglitazone, D‐chiro‐inositol) for women with polycystic ovary syndrome, oligo amenorrhoea and subfertility | Review | Thomas Tang, Jonathan M Lord, Robert J Norman, Ephia Yasmin, Adam H Balen | |
| 2009 Jul 08 | Insulin‐sensitising drugs for polycystic ovary syndrome | Review | Thomas Tang, Jonathan M Lord, Robert J Norman, Ephia Yasmin, Adam H Balen | |
| 2003 Apr 22 | Insulin‐sensitising drugs (metformin, troglitazone, rosiglitazone, pioglitazone, D‐chiro‐inositol) for polycystic ovary syndrome | Review | Thomas Tang, Robert J Norman, Adam H Balen, Jonathan M Lord | |
Differences between protocol and review
Changes in 2009 update
In the 2009 update of this review, the title was changed from 'Insulin‐sensitising drugs (metformin, rosiglitazone, pioglitazone, D‐chiro‐inositol) for polycystic ovary syndrome' to 'Insulin‐sensitising drugs (metformin, rosiglitazone, pioglitazone, D‐chiro‐inositol) for women with polycystic ovary syndrome, oligo amenorrhoea and subfertility'.
The outcome measures were restructured. One new comparison was added (metformin versus clomiphene citrate).
Studies using troglitazone were excluded.
Changes in 2017 update
Unit of analysis
We added a note to the Methods section to clarify that miscarriage and multiple pregnancy data were analysed 'per woman' and added a sensitivity analysis to check the effect of analysing these outcomes 'per pregnancy'. In addition we restricted analysis of ovulation rates to per‐woman data and reported per‐cycle data in an additional table.
'Summary of findings' table
We added more detail in the Methods section to state which comparisons and outcomes would be included in the 'Summary of findings' table. We decided to include only the three most important clinical comparisons. For one comparison (metformin versus clomiphene citrate), there was high heterogeneity for some outcomes which was associated with BMI status, so for this comparison we decided as a post hoc measure to present the data by BMI subgroup.
Keywords
MeSH
Medical Subject Headings (MeSH) Keywords
- *Insulin Resistance;
- *Live Birth;
- Abortion, Spontaneous [epidemiology];
- Anovulation [*drug therapy];
- Clomiphene [therapeutic use];
- Hypoglycemic Agents [adverse effects, *therapeutic use];
- Infertility, Female [*drug therapy];
- Inositol [therapeutic use];
- Metformin [adverse effects, therapeutic use];
- Ovulation Induction [statistics & numerical data];
- Pioglitazone;
- Polycystic Ovary Syndrome [*complications];
- Pregnancy Rate;
- Randomized Controlled Trials as Topic;
- Rosiglitazone;
- Thiazolidinediones [therapeutic use];
Medical Subject Headings Check Words
Female; Humans; Pregnancy;
PICO

Study flow diagram since publication
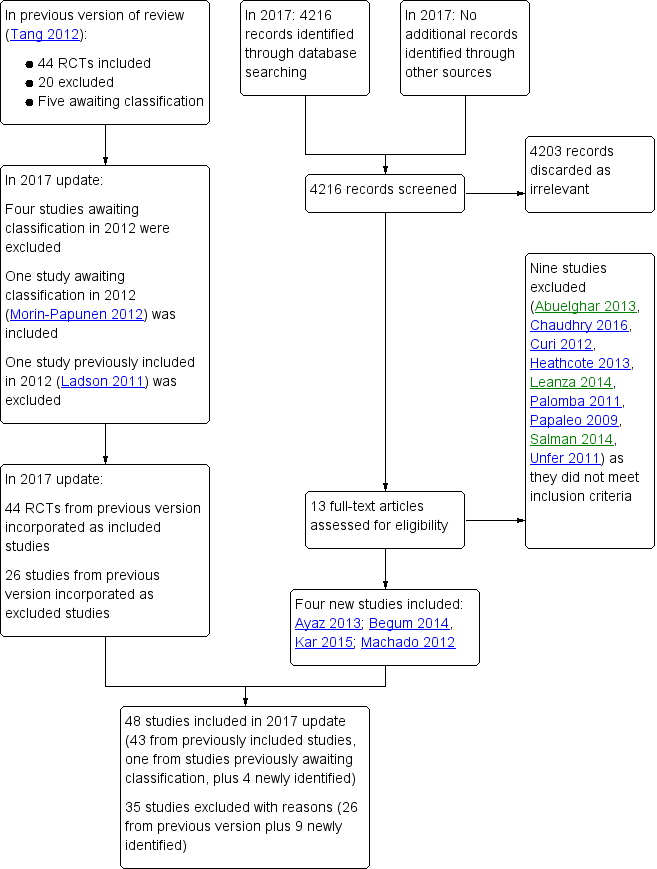
Study flow diagram 2017 update
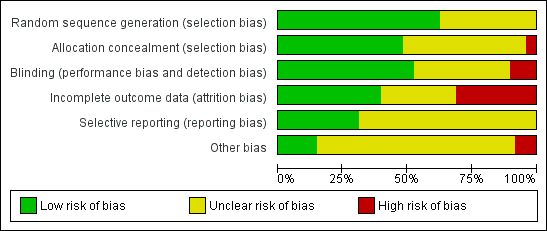
Risk of bias graph: review authors' judgements about each risk of bias item presented as percentages across all included studies

Risk of bias summary: review authors' judgements about each risk of bias item for each included study

Forest plot of comparison: 1 Metformin versus placebo or no treatment, outcome: 1.1 Live birth rate

Forest plot of comparison: 2 Metformin combined with clomiphene citrate versus clomiphene citrate alone, outcome: 2.1 Live birth rate

Forest plot of comparison: 3 Metformin versus clomiphene citrate, outcome: 3.1 Live birth.

Comparison 1 Metformin versus placebo or no treatment, Outcome 1 Live birth rate.

Comparison 1 Metformin versus placebo or no treatment, Outcome 2 Adverse events (gastrointestinal side effects).
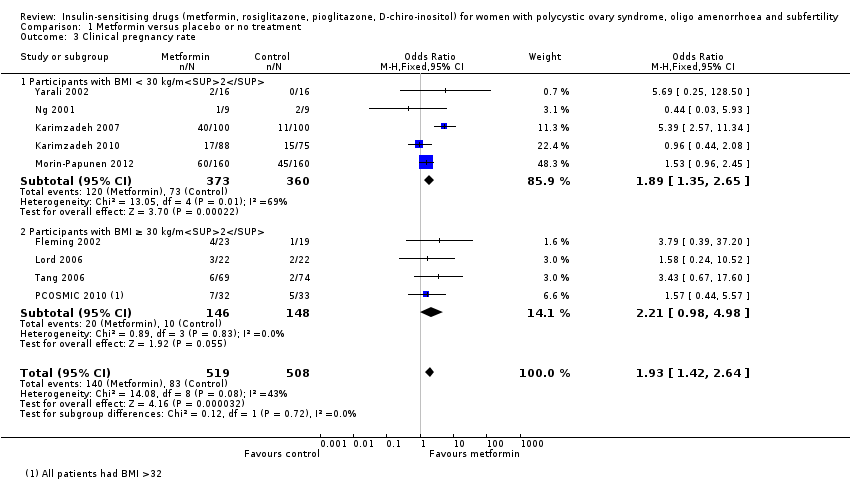
Comparison 1 Metformin versus placebo or no treatment, Outcome 3 Clinical pregnancy rate.
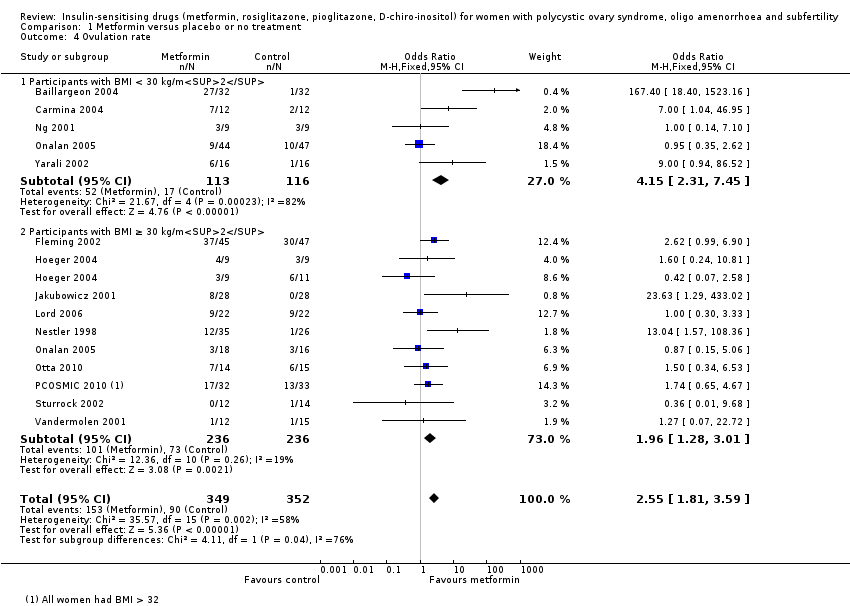
Comparison 1 Metformin versus placebo or no treatment, Outcome 4 Ovulation rate.
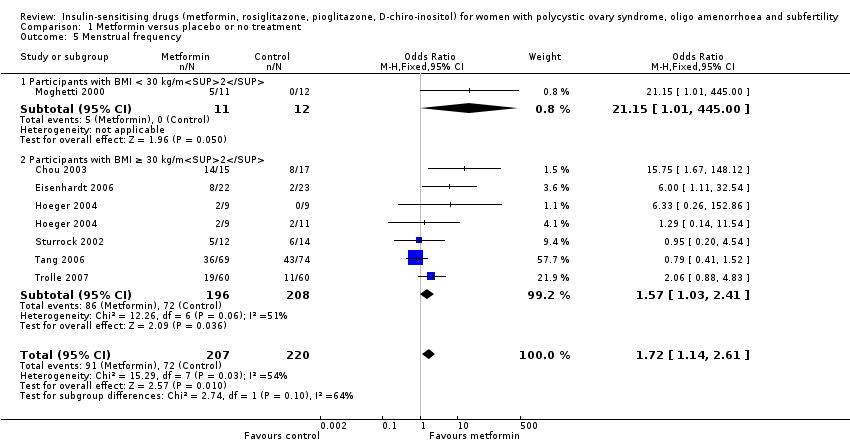
Comparison 1 Metformin versus placebo or no treatment, Outcome 5 Menstrual frequency.

Comparison 1 Metformin versus placebo or no treatment, Outcome 6 Miscarriage rate per woman.

Comparison 1 Metformin versus placebo or no treatment, Outcome 7 Sensitivity analysis: miscarriage rate per pregnancy.

Comparison 1 Metformin versus placebo or no treatment, Outcome 8 Body mass index (kg/m2).

Comparison 1 Metformin versus placebo or no treatment, Outcome 9 Waist‐hip ratio.
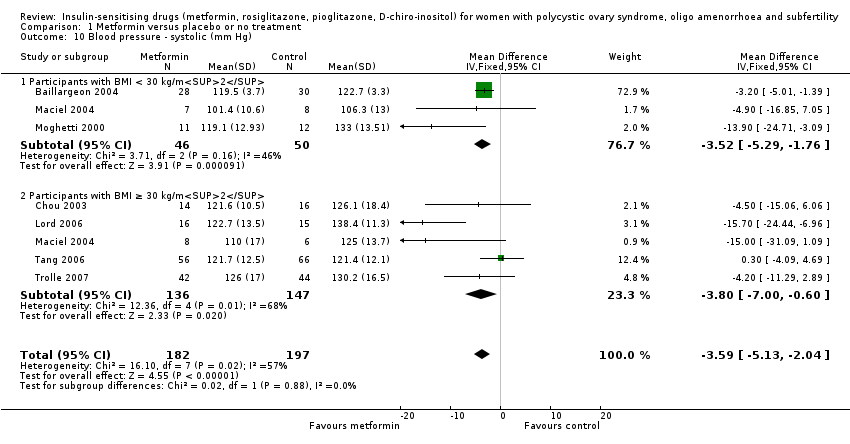
Comparison 1 Metformin versus placebo or no treatment, Outcome 10 Blood pressure ‐ systolic (mm Hg).
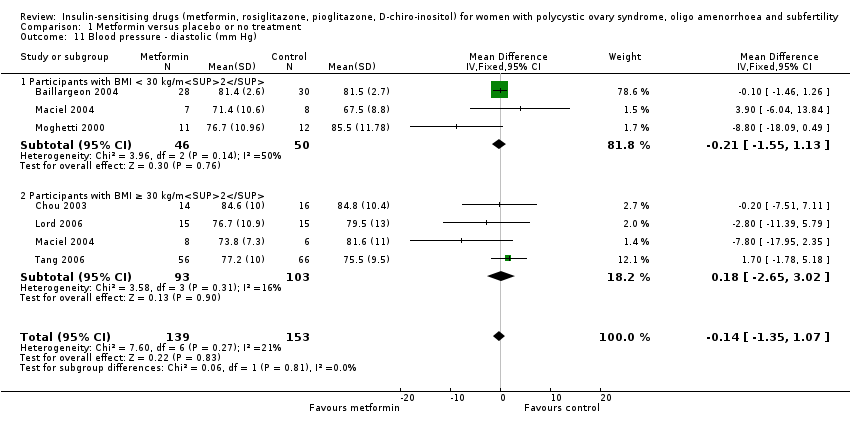
Comparison 1 Metformin versus placebo or no treatment, Outcome 11 Blood pressure ‐ diastolic (mm Hg).

Comparison 1 Metformin versus placebo or no treatment, Outcome 12 Serum testosterone (nmol/L).

Comparison 1 Metformin versus placebo or no treatment, Outcome 13 Serum sex hormone‐binding globulin (nmol/L).

Comparison 1 Metformin versus placebo or no treatment, Outcome 14 Fasting glucose (mmol/L).
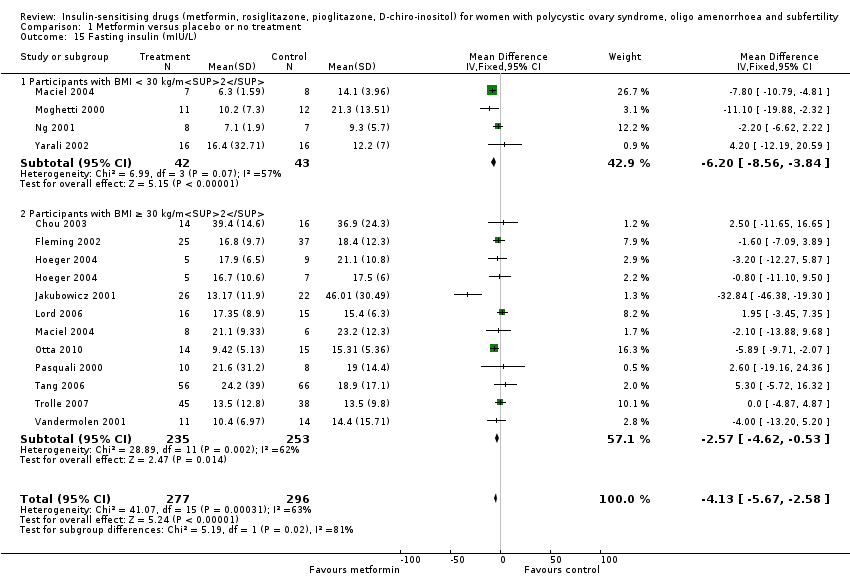
Comparison 1 Metformin versus placebo or no treatment, Outcome 15 Fasting insulin (mIU/L).

Comparison 1 Metformin versus placebo or no treatment, Outcome 16 Total cholesterol (mmol/L).
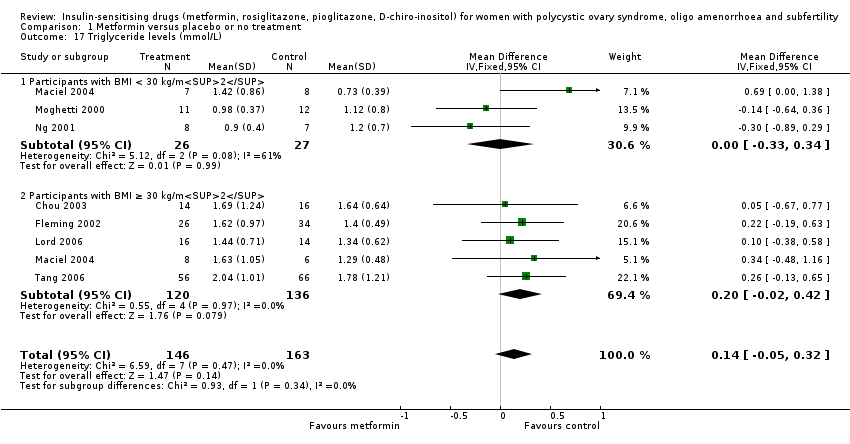
Comparison 1 Metformin versus placebo or no treatment, Outcome 17 Triglyceride levels (mmol/L).

Comparison 2 Metformin combined with clomiphene citrate versus clomiphene citrate alone, Outcome 1 Live birth rate.

Comparison 2 Metformin combined with clomiphene citrate versus clomiphene citrate alone, Outcome 2 Adverse events.

Comparison 2 Metformin combined with clomiphene citrate versus clomiphene citrate alone, Outcome 3 Clinical pregnancy rate.

Comparison 2 Metformin combined with clomiphene citrate versus clomiphene citrate alone, Outcome 4 Ovulation rate.

Comparison 2 Metformin combined with clomiphene citrate versus clomiphene citrate alone, Outcome 5 Ovulation rate: subgroup analysis by sensitivity to clomiphene citrate.

Comparison 2 Metformin combined with clomiphene citrate versus clomiphene citrate alone, Outcome 6 Miscarriage rate per woman.

Comparison 2 Metformin combined with clomiphene citrate versus clomiphene citrate alone, Outcome 7 Sensitivity analysis: miscarriage rate per pregnancy.
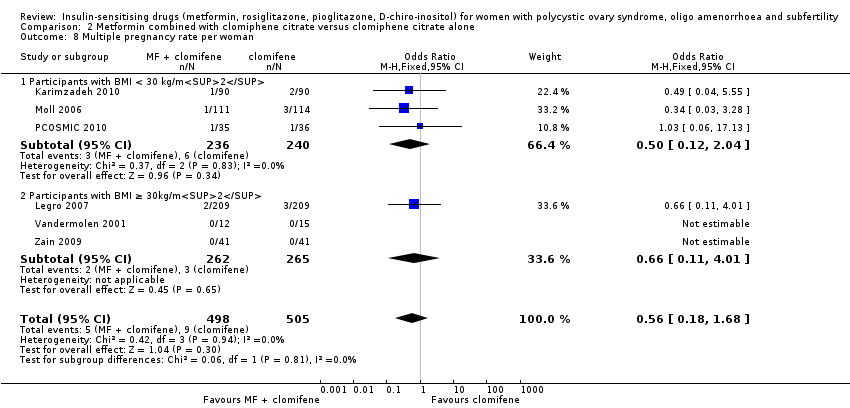
Comparison 2 Metformin combined with clomiphene citrate versus clomiphene citrate alone, Outcome 8 Multiple pregnancy rate per woman.
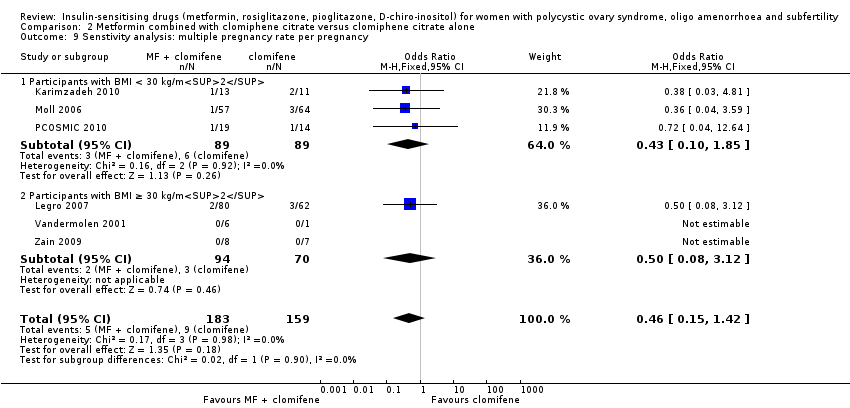
Comparison 2 Metformin combined with clomiphene citrate versus clomiphene citrate alone, Outcome 9 Senstivity analysis: multiple pregnancy rate per pregnancy.
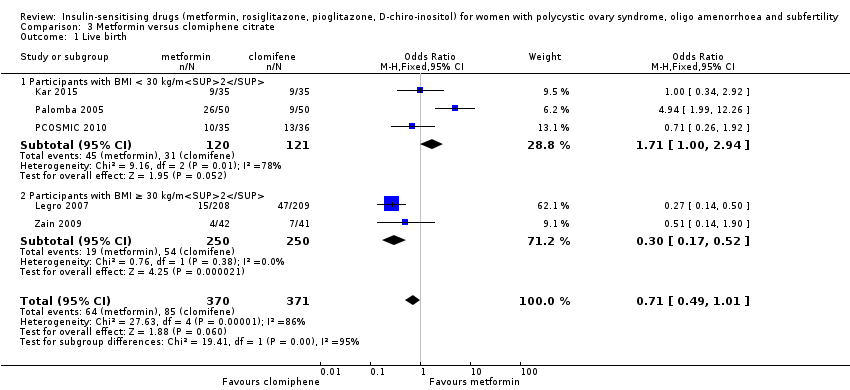
Comparison 3 Metformin versus clomiphene citrate, Outcome 1 Live birth.

Comparison 3 Metformin versus clomiphene citrate, Outcome 2 Clinical pregnancy rate.

Comparison 3 Metformin versus clomiphene citrate, Outcome 3 Ovulation rate.

Comparison 3 Metformin versus clomiphene citrate, Outcome 4 Miscarriage rate per woman.
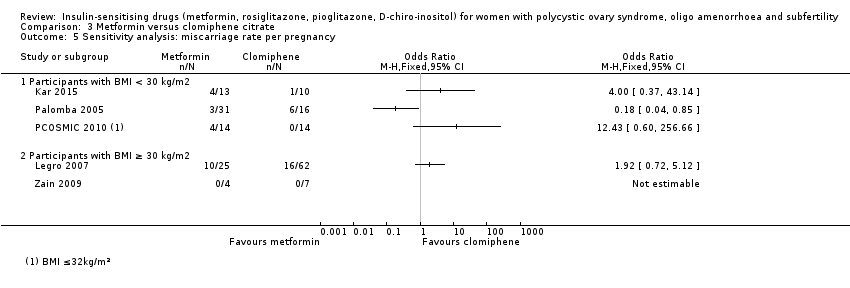
Comparison 3 Metformin versus clomiphene citrate, Outcome 5 Sensitivity analysis: miscarriage rate per pregnancy.

Comparison 3 Metformin versus clomiphene citrate, Outcome 6 Multiple pregnancy rate per woman.
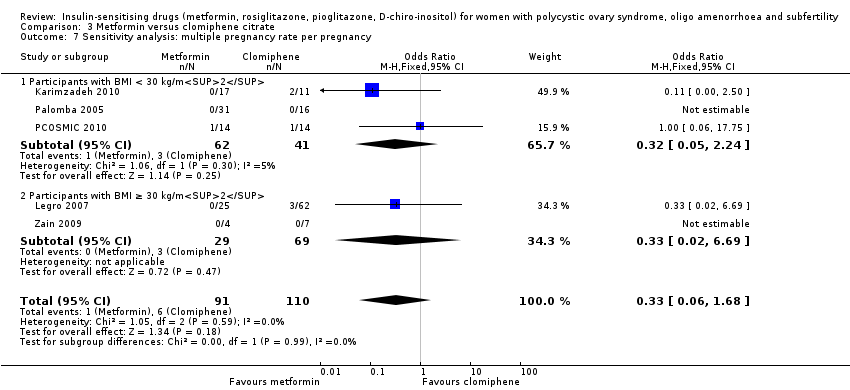
Comparison 3 Metformin versus clomiphene citrate, Outcome 7 Sensitivity analysis: multiple pregnancy rate per pregnancy.
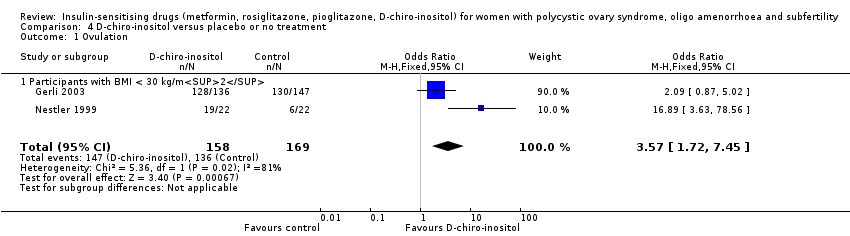
Comparison 4 D‐chiro‐inositol versus placebo or no treatment, Outcome 1 Ovulation.

Comparison 4 D‐chiro‐inositol versus placebo or no treatment, Outcome 2 Body mass index (kg/m2).

Comparison 4 D‐chiro‐inositol versus placebo or no treatment, Outcome 3 Waist‐hip ratio.

Comparison 4 D‐chiro‐inositol versus placebo or no treatment, Outcome 4 Blood pressure ‐ systolic (mm Hg).
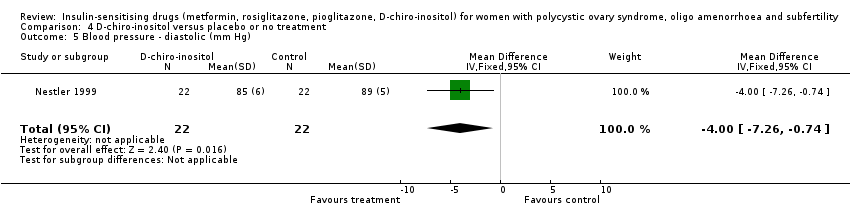
Comparison 4 D‐chiro‐inositol versus placebo or no treatment, Outcome 5 Blood pressure ‐ diastolic (mm Hg).

Comparison 4 D‐chiro‐inositol versus placebo or no treatment, Outcome 6 Serum testosterone (nmol/L).
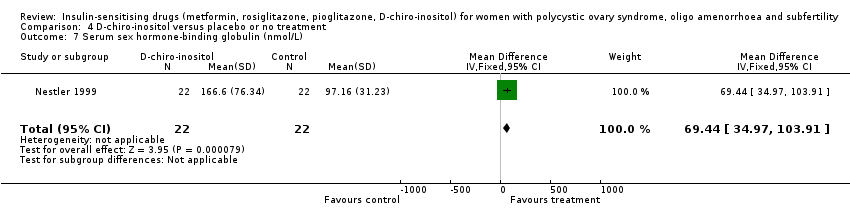
Comparison 4 D‐chiro‐inositol versus placebo or no treatment, Outcome 7 Serum sex hormone‐binding globulin (nmol/L).

Comparison 4 D‐chiro‐inositol versus placebo or no treatment, Outcome 8 Fasting glucose (mmol/L).

Comparison 4 D‐chiro‐inositol versus placebo or no treatment, Outcome 9 Fasting insulin (mIU/L).
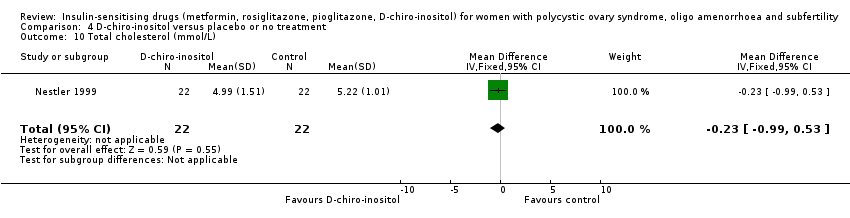
Comparison 4 D‐chiro‐inositol versus placebo or no treatment, Outcome 10 Total cholesterol (mmol/L).

Comparison 4 D‐chiro‐inositol versus placebo or no treatment, Outcome 11 Triglyceride levels (mmol/L).

Comparison 5 Rosiglitazone versus placebo or no treatment, Outcome 1 Ovulation rate.

Comparison 5 Rosiglitazone versus placebo or no treatment, Outcome 2 Menstrual frequency.

Comparison 5 Rosiglitazone versus placebo or no treatment, Outcome 3 Body mass index (kg/m2).
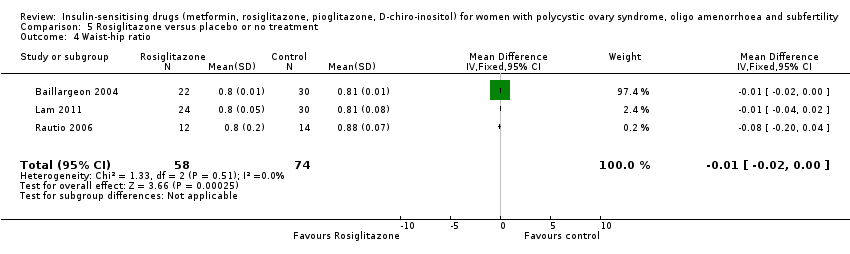
Comparison 5 Rosiglitazone versus placebo or no treatment, Outcome 4 Waist‐hip ratio.

Comparison 5 Rosiglitazone versus placebo or no treatment, Outcome 5 Blood pressure ‐ systolic (mm Hg).

Comparison 5 Rosiglitazone versus placebo or no treatment, Outcome 6 Blood pressure ‐ diastolic (mm Hg).
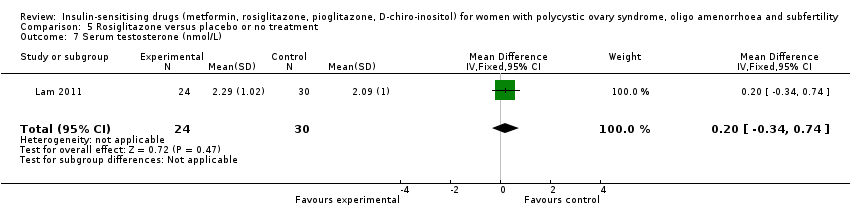
Comparison 5 Rosiglitazone versus placebo or no treatment, Outcome 7 Serum testosterone (nmol/L).
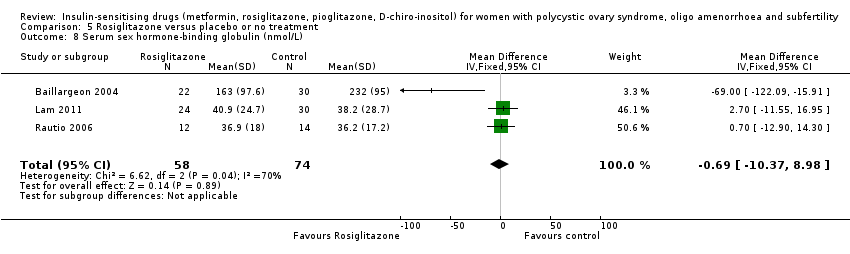
Comparison 5 Rosiglitazone versus placebo or no treatment, Outcome 8 Serum sex hormone‐binding globulin (nmol/L).

Comparison 5 Rosiglitazone versus placebo or no treatment, Outcome 9 Fasting glucose (mmol/L).

Comparison 5 Rosiglitazone versus placebo or no treatment, Outcome 10 Fasting insulin (mIU/L).

Comparison 5 Rosiglitazone versus placebo or no treatment, Outcome 11 Total cholesterol (mmol/L).

Comparison 5 Rosiglitazone versus placebo or no treatment, Outcome 12 Triglyceride levels (mmol/L).
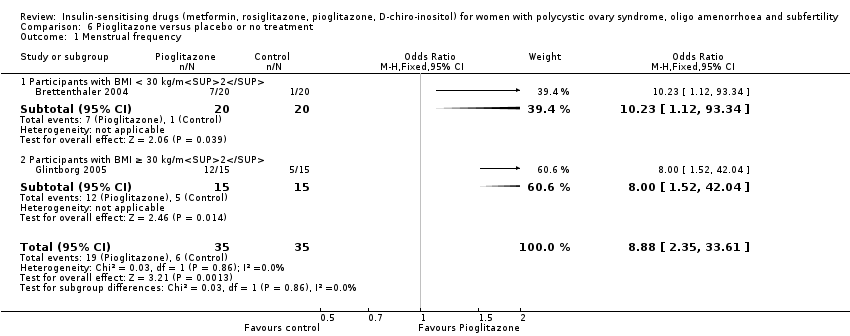
Comparison 6 Pioglitazone versus placebo or no treatment, Outcome 1 Menstrual frequency.

Comparison 6 Pioglitazone versus placebo or no treatment, Outcome 2 Body mass index (kg/m2).
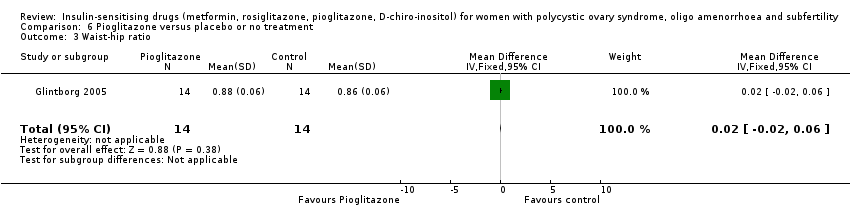
Comparison 6 Pioglitazone versus placebo or no treatment, Outcome 3 Waist‐hip ratio.

Comparison 6 Pioglitazone versus placebo or no treatment, Outcome 4 Serum testosterone (nmol/L).

Comparison 6 Pioglitazone versus placebo or no treatment, Outcome 5 Serum sex hormone‐binding globulin (nmol/L).

Comparison 6 Pioglitazone versus placebo or no treatment, Outcome 6 Fasting insulin (mIU/L).
| Metformin compared to placebo or no treatment for women with polycystic ovary syndrome, oligo amenorrhoea and subfertility | ||||||
| Patient or population: women with polycystic ovary syndrome, oligo amenorrhoea and subfertility | ||||||
| Outcomes | Illustrative comparative risks* (95% CI) | Relative effect | No of participants | Quality of the evidence | Comments | |
| Assumed risk | Corresponding risk | |||||
| Placebo or no treatment | Metformin | |||||
| Live birth rate per woman | 141 per 1000 | 208 per 1000 | OR 1.59 | 435 | ⊕⊕⊝⊝ | |
| Adverse events (gastrointestinal) per woman | 106 per 1000 | 362 per 1000 (267 to 469) | OR 4.76 (3.06 to 7.41) | 670 (7 studies) | ⊕⊕⊕⊝ | |
| Clinical pregnancy rate per woman | 110 per 1000 | 193 per 1000 | OR 1.93 | 1027 | ⊕⊕⊕⊝ | |
| Menstrual frequency per woman | 183 per 1000 | 278 per 1000 (203 to 368) | OR 1.72 (1.14 to 2.61) | 427 (7 studies) | ⊕⊕⊝⊝ | |
| Ovulation rate per woman | 200 per 1000 | 389 per 1000 | OR (1.81 to 3.59) | 701 | ⊕⊕⊕⊝ | |
| Miscarriage rate per woman | 40 per 1000 | 43per 1000 | OR 1.08 | 748 | ⊕⊕⊝⊝ | Miscarriage rate per pregnancy OR 0.58, 95% CI 0.25 to 1.34, 200 pregnancies |
| *The basis for the assumed risk is the median control group risk across studies. The corresponding risk (and its 95% confidence interval) is based on the assumed risk in the comparison group and the relative effect of the intervention (and its 95% CI). | ||||||
| GRADE Working Group grades of evidence High quality: we are very confident that the true effect lies close to that of the estimate of the effect Moderate quality: we are moderately confident in the effect estimate; the true effect is likely to be close to the estimate of effect, but there is a possibility that it is substantially different Low quality: our confidence in the effect estimate is limited; the true effect may be substantially different from the estimate of the effect Very low quality: we have very little confidence in the effect estimate; the true effect is likely to be substantially different from the estimate of effect | ||||||
| aDowngraded one level for serious risk of bias related to failure to report methods of randomisation and/or serious risk of attrition bias in some of the studies. | ||||||
| Metformin combined with clomiphene versus clomiphene alone for women with polycystic ovary syndrome | ||||||
| Population: women with polycystic ovary syndrome | ||||||
| Outcomes | Anticipated absolute effects* (95% CI) | Relative effect | № of participants | Quality of the evidence | Comments | |
| Risk with clomiphene alone | Risk with metformin combined with clomiphene | |||||
| Live birth rate per woman | 257 per 1000 | 295 per 1000 | OR 1.21 | 1079 | ⊕⊕⊝⊝ | |
| Adverse events (gastrointestinal) per woman | 134 per 1000 | 381 per 1000 | OR 3.97 | 591 | ⊕⊕⊕⊝ | |
| Clinical pregnancy rate per woman | 243 per 1000 | 338per 1000 | OR 1.59 | 1529 | ⊕⊕⊕⊝ | |
| Menstrual frequency per woman | Not reported by any of the included studies | |||||
| Ovulation rate per woman | 381per 1000 | 491 per 1000 | OR 1.57 (1.28 to 1.92) | 1624 | ⊕⊕⊕⊝ | |
| Miscarriage rate per woman | Median rates not calculable as there were no events in the control group in 5/8 studies | OR 1.59 | 1096 | ⊕⊕⊝⊝ | Miscarriage rate per pregnancy OR 1.30 95% CI 0.80 to 2.12, 400 pregnancies | |
| *The risk in the intervention group (and its 95% confidence interval) is based on the median risk in the comparison group and the relative effect of the intervention (and its 95% CI). | ||||||
| GRADE Working Group grades of evidence | ||||||
| aDowngraded one level for serious risk of bias related to failure to describe study methods and/or serious risk of attrition bias in several of the studies. | ||||||
| Metformin compared to clomiphene citrate for women with polycystic ovary syndrome | ||||||
| Population: women with polycystic ovary syndrome | ||||||
| Outcomes | Anticipated absolute effects* (95% CI) | Relative effect | № of participants | Quality of the evidence | Comments | |
| Risk with clomiphene citrate | Risk with metformin | |||||
| Live birth rate per woman Participants with BMI < 30 kg/m2 or ≤ 32 kg/m2a | 225 per 1000 | 171 per 1000 (124 to 227) | OR 1.71 (1.00 to 2.94) | 241 (3 studies) | ⊕⊝⊝⊝ very lowc,d | High heterogeneity (I2 = 78%) |
| Live birth rate per woman Participants with BMI ≥ 30 kg/m2a | 198 per 1000 | 69 per 1000 (40 to 114) | OR 0.30 (0.17 to 0.52) | 500 (2 studies) | ⊕⊝⊝⊝ | 74 events |
| Adverse events (gastrointestinal) | Not reported by any of the included studies | |||||
| Clinical pregnancy rate per woman Participants with BMI < 30 kg/m2 or ≤ 32 kg/m2a | 320 per 1000 | 423 per 1000 | OR 1.56 | 490 | ⊕⊝⊝⊝ | 103 events |
| Clinical pregnancy rate per woman Participants with BMI ≥ 30 kg/m2a | 234 per 1000 | 94 per 1000 | OR 0.34 | 500 | ⊕⊝⊝⊝ | 98 events |
| Menstrual frequency | Not reported by any of the included studies | |||||
| Ovulation rate per woman Participants with BMI < 30 kg/m2b | 625 per 1000 | 574 per 1000 | OR 0.81 | 312 | ⊕⊕⊝⊝ | |
| Ovulation rate per woman Participants with BMI ≥ 30 kg/m2b | 534per 1000 | 250per 1,000 | OR 0.29 | 500 | ⊕⊕⊝⊝ | |
| Miscarriage rate per woman | 29 per 1000 | 26 per 1000 (15 to 47) | OR 0.92 (0.50 to 1.67) | 741 | ⊕⊝⊝⊝ very lowc,e | High heterogeneity (I2 = 52%) |
| *The risk in the intervention group (and its 95% confidence interval) is based on the median risk in the comparison group and the relative effect of the intervention (and its 95% CI). | ||||||
| GRADE Working Group grades of evidence | ||||||
| aData subgrouped by BMI, as pooling of BMI groups resulted in high heterogeneity (I2 > 85%) with differing directions of effect. | ||||||
| Abbreviation | Definition |
| BMI | Body mass index |
| CC | Clomiphene citrate |
| CI | Confidence interval |
| CT | Computerised tomography scan |
| DHEAS | Dehydroepiandrosterone sulphate |
| FSH | Follicle stimulating hormone |
| GTT | Glucose tolerance test |
| HbA1C | Glycosylated haemoglobin |
| HDL | High‐density lipoprotein cholesterol |
| IGFBP‐1 | Insulin growth factor binding protein 1 |
| LDL | Low‐density lipoprotein cholesterol |
| LH | Luteinising hormone |
| NIDDM | Non insulin dependent diabetes mellitus |
| PAI‐1 | Plasminogen activator inhibitor 1 |
| PCO | Polycystic ovary |
| PCOS | Polycystic ovary syndrome |
| RCT | Randomised controlled trial |
| rFSH | Recombinant follicle stimulating hormone |
| SD | Standard deviation |
| SE | Standard error of the mean |
| SHBG | Sex hormone‐binding globulin |
| VLDL | Very low density lipoprotein cholesterol |
| vs | Versus |
| MD | Mean difference |
| Convert from | Convert to | Conversion factor | |
| Cholesterol | mg/dL | mmol/L | 0.026 |
| Triglycerides | mg/dL | mmol/L | 0.11 |
| Insulin | pmol/L | mIU/L (= microIU/mL) | 0.1667 |
| Glucose | mg/dL | mmol/L | 0.056 |
| Progesterone | ng/mL | nmol/L | 3.18 |
| Testosterone | ng/dL | nmol/L | 0.03467 |
| Androstenedione | ng/dL | nmol/L | 0.0349 |
| Estradiol | ng/dL | pmol/L | 36.71 |
| 17‐beta oestradiol | ng/dL | pmol/L | 36.71 |
| Dehydroepiandrosterone sulphate | microg/dL | micromol/L | 0.02714 |
| Sex hormone‐binding globulin | microg/dL | nmol/L | 34.7 |
| Standard deviation | Standard error | Standard deviation | Sqrt n |
| Confidence intervals | Confidence intervals | Standard error | (upper limit ‐ lower limit)/3.92 |
| Study ID | Metformin | Placebo | P value | ||
| Events | Cycles | Events | Cycles | ||
| BMI < 30 kg/m2 | |||||
| 27 | 32 | 11 | 32 | ||
| 7 | 12 | 3 | 12 | ||
| 3 | 9 | 3 | 9 | ||
| 17 | 153 | 20 | 150 | ||
| 6 | 16 | 1 | 16 | ||
| BMI ≥ 30 kg/m2 | |||||
| 37 | 45 | 30 | 47 | ||
| 3 | 9 | 6 | 11 | ||
| 4 | 9 | 3 | 9 | ||
| 8 | 28 | 0 | 28 | ||
| 9 | 22 | 9 | 22 | ||
| 12 | 35 | 1 | 26 | ||
| 5 | 63 | 5 | 51 | ||
| 7 | 14 | 6 | 15 | ||
| 17 | 32 | 13 | 33 | ||
| 0 | 12 | 1 | 14 | ||
| 1 | 12 | 1 | 15 | ||
| Study ID | Metformin + | Clomiphene | P value | ||
| Events | Cycles | Events | Cycles | ||
| BMI < 30 kg/m2 | |||||
| 16 | 21 | 8 | 21 | ||
| 10 | 16 | 6 | 16 | ||
| 17 | 32 | 10 | 31 | ||
| 35 | 45 | 29 | 45 | ||
| 17 | 40 | 5 | 40 | ||
| 15 | 21 | 5 | 15 | ||
| 11 | 16 | 3 | 12 | ||
| 84 | 141 | 98 | 168 | ||
| 4 | 9 | 1 | 9 | ||
| 27 | 35 | 23 | 36 | ||
| BMI ≥ 30 kg/m2 | |||||
| 26 | 28 | 22 | 28 | ||
| 7 | 16 | 1 | 15 | ||
| 582 | 964 | 462 | 942 | ||
| 19 | 21 | 2 | 25 | ||
| 38 | 51 | 34 | 55 | ||
| 34 | 52 | 36 | 55 | ||
| 5 | 12 | 4 | 14 | ||
| 9 | 12 | 4 | 15 | ||
| 38 | 41 | 24 | 41 | ||
| Metformin | Clomiphene citrate | ||||
| Study ID | Events | Cycles | Events | Cycles | P value |
| BMI < 30 kg/m2 | |||||
| 129 | 205 | 148 | 221 | ||
| 23 | 35 | 23 | 36 | ||
| BMI ≥ 30 kg/m2 | |||||
| 296 | 1019 | 462 | 942 | ||
| 4 | 42 | 7 | 41 | ||
| Inositol | Placebo | ||||
| Study ID | Events | Cycles | Events | Cycles | P value |
| BMI < 30 kg/m2 | |||||
| 128 | 136 | 130 | 147 | ||
| 19 | 22 | 6 | 22 | ||
| Rosiglitazone | Placebo | ||||
| Study ID | Events | Cycles | Events | Cycles | P value |
| BMI ≥ 30 kg/m2 | |||||
| 16 | 32 | 11 | 32 | ||
| Outcome or subgroup title | No. of studies | No. of participants | Statistical method | Effect size |
| 1 Live birth rate Show forest plot | 4 | 435 | Odds Ratio (M‐H, Fixed, 95% CI) | 1.59 [1.00, 2.51] |
| 1.1 Participants with BMI < 30 kg/m2 | 3 | 370 | Odds Ratio (M‐H, Fixed, 95% CI) | 1.51 [0.94, 2.44] |
| 1.2 Participants with BMI ≥ 30 kg/m2 | 1 | 65 | Odds Ratio (M‐H, Fixed, 95% CI) | 2.87 [0.51, 16.01] |
| 2 Adverse events (gastrointestinal side effects) Show forest plot | 7 | 670 | Odds Ratio (M‐H, Fixed, 95% CI) | 4.76 [3.06, 7.41] |
| 2.1 Participants with BMI < 30 kg/m2 | 4 | 393 | Odds Ratio (M‐H, Fixed, 95% CI) | 5.61 [2.89, 10.88] |
| 2.2 Participants with BMI ≥ 30 kg/m2 | 3 | 277 | Odds Ratio (M‐H, Fixed, 95% CI) | 4.13 [2.28, 7.49] |
| 3 Clinical pregnancy rate Show forest plot | 9 | 1027 | Odds Ratio (M‐H, Fixed, 95% CI) | 1.93 [1.42, 2.64] |
| 3.1 Participants with BMI < 30 kg/m2 | 5 | 733 | Odds Ratio (M‐H, Fixed, 95% CI) | 1.89 [1.35, 2.65] |
| 3.2 Participants with BMI ≥ 30 kg/m2 | 4 | 294 | Odds Ratio (M‐H, Fixed, 95% CI) | 2.21 [0.98, 4.98] |
| 4 Ovulation rate Show forest plot | 14 | 701 | Odds Ratio (M‐H, Fixed, 95% CI) | 2.55 [1.81, 3.59] |
| 4.1 Participants with BMI < 30 kg/m2 | 5 | 229 | Odds Ratio (M‐H, Fixed, 95% CI) | 4.15 [2.31, 7.45] |
| 4.2 Participants with BMI ≥ 30 kg/m2 | 10 | 472 | Odds Ratio (M‐H, Fixed, 95% CI) | 1.96 [1.28, 3.01] |
| 5 Menstrual frequency Show forest plot | 7 | 427 | Odds Ratio (M‐H, Fixed, 95% CI) | 1.72 [1.14, 2.61] |
| 5.1 Participants with BMI < 30 kg/m2 | 1 | 23 | Odds Ratio (M‐H, Fixed, 95% CI) | 21.15 [1.01, 445.00] |
| 5.2 Participants with BMI ≥ 30 kg/m2 | 6 | 404 | Odds Ratio (M‐H, Fixed, 95% CI) | 1.57 [1.03, 2.41] |
| 6 Miscarriage rate per woman Show forest plot | 4 | 748 | Odds Ratio (M‐H, Fixed, 95% CI) | 1.08 [0.50, 2.35] |
| 6.1 Participants with BMI < 30 kg/m2 | 3 | 683 | Odds Ratio (M‐H, Fixed, 95% CI) | 1.19 [0.52, 2.71] |
| 6.2 Participants with BMI ≥ 30 kg/m2 | 1 | 65 | Odds Ratio (M‐H, Fixed, 95% CI) | 0.5 [0.04, 5.80] |
| 7 Sensitivity analysis: miscarriage rate per pregnancy Show forest plot | 4 | 200 | Odds Ratio (M‐H, Fixed, 95% CI) | 0.58 [0.25, 1.34] |
| 7.1 Participants with BMI < 30 kg/m2 | 3 | 188 | Odds Ratio (M‐H, Fixed, 95% CI) | 0.63 [0.26, 1.53] |
| 7.2 Participants with BMI ≥ 30 kg/m2 | 1 | 12 | Odds Ratio (M‐H, Fixed, 95% CI) | 0.25 [0.02, 4.00] |
| 8 Body mass index (kg/m2) Show forest plot | 16 | 827 | Mean Difference (IV, Fixed, 95% CI) | ‐0.08 [‐0.33, 0.17] |
| 8.1 Participants with BMI < 30 kg/m2 | 7 | 419 | Mean Difference (IV, Fixed, 95% CI) | ‐0.06 [‐0.33, 0.21] |
| 8.2 Participants with BMI ≥ 30 kg/m2 | 10 | 408 | Mean Difference (IV, Fixed, 95% CI) | ‐0.20 [‐0.92, 0.52] |
| 9 Waist‐hip ratio Show forest plot | 11 | 702 | Mean Difference (IV, Fixed, 95% CI) | ‐0.01 [‐0.01, ‐0.00] |
| 9.1 Participants with BMI < 30 kg/m2 | 5 | 389 | Mean Difference (IV, Fixed, 95% CI) | ‐0.01 [‐0.01, ‐0.00] |
| 9.2 Participants with BMI ≥ 30 kg/m2 | 6 | 313 | Mean Difference (IV, Fixed, 95% CI) | ‐0.01 [‐0.02, 0.01] |
| 10 Blood pressure ‐ systolic (mm Hg) Show forest plot | 7 | 379 | Mean Difference (IV, Fixed, 95% CI) | ‐3.59 [‐5.13, ‐2.04] |
| 10.1 Participants with BMI < 30 kg/m2 | 3 | 96 | Mean Difference (IV, Fixed, 95% CI) | ‐3.52 [‐5.29, ‐1.76] |
| 10.2 Participants with BMI ≥ 30 kg/m2 | 5 | 283 | Mean Difference (IV, Fixed, 95% CI) | ‐3.80 [‐5.00, ‐0.60] |
| 11 Blood pressure ‐ diastolic (mm Hg) Show forest plot | 6 | 292 | Mean Difference (IV, Fixed, 95% CI) | ‐0.14 [‐1.35, 1.07] |
| 11.1 Participants with BMI < 30 kg/m2 | 3 | 96 | Mean Difference (IV, Fixed, 95% CI) | ‐0.21 [‐1.55, 1.13] |
| 11.2 Participants with BMI ≥ 30 kg/m2 | 4 | 196 | Mean Difference (IV, Fixed, 95% CI) | 0.18 [‐2.65, 3.02] |
| 12 Serum testosterone (nmol/L) Show forest plot | 15 | 863 | Mean Difference (IV, Fixed, 95% CI) | ‐0.49 [‐0.59, ‐0.39] |
| 12.1 Participants with BMI < 30 kg/m2 | 7 | 419 | Mean Difference (IV, Fixed, 95% CI) | ‐0.71 [‐0.86, ‐0.56] |
| 12.2 Participants with BMI ≥ 30 kg/m2 | 9 | 444 | Mean Difference (IV, Fixed, 95% CI) | ‐0.29 [‐0.44, ‐0.15] |
| 13 Serum sex hormone‐binding globulin (nmol/L) Show forest plot | 15 | 823 | Mean Difference (IV, Fixed, 95% CI) | 0.49 [‐1.82, 2.81] |
| 13.1 Participants with BMI < 30 kg/m2 | 6 | 387 | Mean Difference (IV, Fixed, 95% CI) | ‐0.22 [‐6.73, 6.28] |
| 13.2 Participants with BMI ≥ 30 kg/m2 | 10 | 436 | Mean Difference (IV, Fixed, 95% CI) | 0.60 [‐1.88, 3.07] |
| 14 Fasting glucose (mmol/L) Show forest plot | 15 | 849 | Mean Difference (IV, Fixed, 95% CI) | ‐0.14 [‐0.21, ‐0.07] |
| 14.1 Participants with BMI < 30 kg/m2 | 5 | 364 | Mean Difference (IV, Fixed, 95% CI) | ‐0.13 [‐0.22, ‐0.04] |
| 14.2 Participants with BMI ≥ 30 kg/m2 | 11 | 485 | Mean Difference (IV, Fixed, 95% CI) | ‐0.16 [‐0.27, ‐0.05] |
| 15 Fasting insulin (mIU/L) Show forest plot | 14 | 573 | Mean Difference (IV, Fixed, 95% CI) | ‐4.13 [‐5.67, ‐2.58] |
| 15.1 Participants with BMI < 30 kg/m2 | 4 | 85 | Mean Difference (IV, Fixed, 95% CI) | ‐6.20 [‐8.56, ‐3.84] |
| 15.2 Participants with BMI ≥ 30 kg/m2 | 11 | 488 | Mean Difference (IV, Fixed, 95% CI) | ‐2.57 [‐4.62, ‐0.53] |
| 16 Total cholesterol (mmol/L) Show forest plot | 10 | 562 | Mean Difference (IV, Fixed, 95% CI) | ‐0.14 [‐0.31, 0.02] |
| 16.1 Participants with BMI < 30 kg/m2 | 5 | 276 | Mean Difference (IV, Fixed, 95% CI) | ‐0.02 [‐0.26, 0.22] |
| 16.2 Participants with BMI ≥ 30 kg/m2 | 6 | 286 | Mean Difference (IV, Fixed, 95% CI) | ‐0.26 [‐0.48, ‐0.03] |
| 17 Triglyceride levels (mmol/L) Show forest plot | 7 | 309 | Mean Difference (IV, Fixed, 95% CI) | 0.14 [‐0.05, 0.32] |
| 17.1 Participants with BMI < 30 kg/m2 | 3 | 53 | Mean Difference (IV, Fixed, 95% CI) | 0.00 [‐0.33, 0.34] |
| 17.2 Participants with BMI ≥ 30 kg/m2 | 5 | 256 | Mean Difference (IV, Fixed, 95% CI) | 0.20 [‐0.02, 0.42] |
| Outcome or subgroup title | No. of studies | No. of participants | Statistical method | Effect size |
| 1 Live birth rate Show forest plot | 9 | 1079 | Odds Ratio (M‐H, Fixed, 95% CI) | 1.21 [0.92, 1.59] |
| 1.1 Participants with BMI < 30 kg/m2 or ≤ 32 kg/m2 | 5 | 531 | Odds Ratio (M‐H, Fixed, 95% CI) | 1.14 [0.78, 1.67] |
| 1.2 Participants with BMI ≥ 30 kg/m2 | 4 | 548 | Odds Ratio (M‐H, Fixed, 95% CI) | 1.28 [0.86, 1.91] |
| 2 Adverse events Show forest plot | 3 | 591 | Odds Ratio (M‐H, Fixed, 95% CI) | 3.97 [2.59, 6.08] |
| 2.1 Participants with BMI < 30 kg/m2 | 3 | 591 | Odds Ratio (M‐H, Fixed, 95% CI) | 3.97 [2.59, 6.08] |
| 3 Clinical pregnancy rate Show forest plot | 16 | 1529 | Odds Ratio (M‐H, Fixed, 95% CI) | 1.59 [1.27, 1.99] |
| 3.1 Participants with BMI < 30 kg/m2 | 9 | 834 | Odds Ratio (M‐H, Fixed, 95% CI) | 1.46 [1.08, 1.98] |
| 3.2 Participants with BMI ≥ 30 kg/m2 | 7 | 695 | Odds Ratio (M‐H, Fixed, 95% CI) | 1.76 [1.26, 2.47] |
| 4 Ovulation rate Show forest plot | 21 | 1624 | Odds Ratio (M‐H, Fixed, 95% CI) | 1.57 [1.28, 1.92] |
| 4.1 BMI < 30 kg/m2 | 11 | 755 | Odds Ratio (M‐H, Fixed, 95% CI) | 1.79 [1.32, 2.41] |
| 4.2 BMI ≥ 30 kg/m2 | 9 | 814 | Odds Ratio (M‐H, Fixed, 95% CI) | 1.52 [1.15, 2.01] |
| 4.3 BMI not reported | 1 | 55 | Odds Ratio (M‐H, Fixed, 95% CI) | 0.43 [0.13, 1.37] |
| 5 Ovulation rate: subgroup analysis by sensitivity to clomiphene citrate Show forest plot | 7 | 271 | Odds Ratio (M‐H, Fixed, 95% CI) | 4.69 [2.61, 8.44] |
| 5.1 PCOS and clomiphene‐sensitive | 1 | 56 | Odds Ratio (M‐H, Fixed, 95% CI) | 3.55 [0.65, 19.37] |
| 5.2 PCOS and clomiphene‐resistant | 6 | 215 | Odds Ratio (M‐H, Fixed, 95% CI) | 4.89 [2.62, 9.13] |
| 6 Miscarriage rate per woman Show forest plot | 9 | 1096 | Odds Ratio (M‐H, Fixed, 95% CI) | 1.59 [1.03, 2.46] |
| 6.1 Participants with BMI < 30 kg/m2 | 5 | 548 | Odds Ratio (M‐H, Fixed, 95% CI) | 1.41 [0.76, 2.62] |
| 6.2 Participants with BMI ≥ 30 kg/m2 | 4 | 548 | Odds Ratio (M‐H, Fixed, 95% CI) | 1.79 [0.97, 3.32] |
| 7 Sensitivity analysis: miscarriage rate per pregnancy Show forest plot | 8 | 400 | Odds Ratio (M‐H, Fixed, 95% CI) | 1.30 [0.80, 2.12] |
| 7.1 Participants with BMI < 30 kg/m2 | 4 | 228 | Odds Ratio (M‐H, Fixed, 95% CI) | 1.27 [0.65, 2.51] |
| 7.2 Participants with BMI ≥ 30 kg/m2 | 4 | 172 | Odds Ratio (M‐H, Fixed, 95% CI) | 1.34 [0.67, 2.68] |
| 8 Multiple pregnancy rate per woman Show forest plot | 6 | 1003 | Odds Ratio (M‐H, Fixed, 95% CI) | 0.56 [0.18, 1.68] |
| 8.1 Participants with BMI < 30 kg/m2 | 3 | 476 | Odds Ratio (M‐H, Fixed, 95% CI) | 0.50 [0.12, 2.04] |
| 8.2 Participants with BMI ≥ 30kg/m2 | 3 | 527 | Odds Ratio (M‐H, Fixed, 95% CI) | 0.66 [0.11, 4.01] |
| 9 Senstivity analysis: multiple pregnancy rate per pregnancy Show forest plot | 6 | 342 | Odds Ratio (M‐H, Fixed, 95% CI) | 0.46 [0.15, 1.42] |
| 9.1 Participants with BMI < 30 kg/m2 | 3 | 178 | Odds Ratio (M‐H, Fixed, 95% CI) | 0.43 [0.10, 1.85] |
| 9.2 Participants with BMI ≥ 30 kg/m2 | 3 | 164 | Odds Ratio (M‐H, Fixed, 95% CI) | 0.50 [0.08, 3.12] |
| Outcome or subgroup title | No. of studies | No. of participants | Statistical method | Effect size |
| 1 Live birth Show forest plot | 5 | 741 | Odds Ratio (M‐H, Fixed, 95% CI) | 0.71 [0.49, 1.01] |
| 1.1 Participants with BMI < 30 kg/m2 | 3 | 241 | Odds Ratio (M‐H, Fixed, 95% CI) | 1.71 [1.00, 2.94] |
| 1.2 Participants with BMI ≥ 30 kg/m2 | 2 | 500 | Odds Ratio (M‐H, Fixed, 95% CI) | 0.30 [0.17, 0.52] |
| 2 Clinical pregnancy rate Show forest plot | 7 | Odds Ratio (M‐H, Fixed, 95% CI) | Subtotals only | |
| 2.1 Participants with BMI < 30 kg/m2 | 5 | 490 | Odds Ratio (M‐H, Fixed, 95% CI) | 1.56 [1.05, 2.33] |
| 2.2 Participants with BMI ≥ 30 kg/m2 | 2 | 500 | Odds Ratio (M‐H, Fixed, 95% CI) | 0.34 [0.21, 0.55] |
| 3 Ovulation rate Show forest plot | 6 | Odds Ratio (M‐H, Fixed, 95% CI) | Subtotals only | |
| 3.1 Participants with BMI < 30 kg/m2 | 4 | 312 | Odds Ratio (M‐H, Fixed, 95% CI) | 0.81 [0.51, 1.28] |
| 3.2 Participants with BMI ≥ 30 kg/m2 | 2 | 500 | Odds Ratio (M‐H, Fixed, 95% CI) | 0.29 [0.20, 0.43] |
| 4 Miscarriage rate per woman Show forest plot | 5 | 741 | Odds Ratio (M‐H, Fixed, 95% CI) | 0.92 [0.50, 1.67] |
| 4.1 Participants with BMI < 30 kg/m2 | 3 | 241 | Odds Ratio (M‐H, Fixed, 95% CI) | 1.58 [0.61, 4.09] |
| 4.2 Participants with BMI ≥ 30 kg/m2 | 2 | 500 | Odds Ratio (M‐H, Fixed, 95% CI) | 0.61 [0.27, 1.38] |
| 5 Sensitivity analysis: miscarriage rate per pregnancy Show forest plot | 5 | Odds Ratio (M‐H, Fixed, 95% CI) | Totals not selected | |
| 5.1 Participants with BMI < 30 kg/m2 | 3 | Odds Ratio (M‐H, Fixed, 95% CI) | 0.0 [0.0, 0.0] | |
| 5.2 Participants with BMI ≥ 30 kg/m2 | 2 | Odds Ratio (M‐H, Fixed, 95% CI) | 0.0 [0.0, 0.0] | |
| 6 Multiple pregnancy rate per woman Show forest plot | 5 | 858 | Odds Ratio (M‐H, Fixed, 95% CI) | 0.29 [0.06, 1.43] |
| 6.1 Participants with BMI < 30 kg/m2 | 3 | 358 | Odds Ratio (M‐H, Fixed, 95% CI) | 0.46 [0.07, 3.16] |
| 6.2 Participants with BMI ≥ 30 kg/m2 | 2 | 500 | Odds Ratio (M‐H, Fixed, 95% CI) | 0.14 [0.01, 2.76] |
| 7 Sensitivity analysis: multiple pregnancy rate per pregnancy Show forest plot | 5 | 201 | Odds Ratio (M‐H, Fixed, 95% CI) | 0.33 [0.06, 1.68] |
| 7.1 Participants with BMI < 30 kg/m2 | 3 | 103 | Odds Ratio (M‐H, Fixed, 95% CI) | 0.32 [0.05, 2.24] |
| 7.2 Participants with BMI ≥ 30 kg/m2 | 2 | 98 | Odds Ratio (M‐H, Fixed, 95% CI) | 0.33 [0.02, 6.69] |
| Outcome or subgroup title | No. of studies | No. of participants | Statistical method | Effect size |
| 1 Ovulation Show forest plot | 2 | 327 | Odds Ratio (M‐H, Fixed, 95% CI) | 3.57 [1.72, 7.45] |
| 1.1 Participants with BMI < 30 kg/m2 | 2 | 327 | Odds Ratio (M‐H, Fixed, 95% CI) | 3.57 [1.72, 7.45] |
| 2 Body mass index (kg/m2) Show forest plot | 1 | 44 | Mean Difference (IV, Fixed, 95% CI) | 0.5 [‐0.86, 1.86] |
| 3 Waist‐hip ratio Show forest plot | 1 | 44 | Mean Difference (IV, Fixed, 95% CI) | ‐0.01 [‐0.05, 0.03] |
| 4 Blood pressure ‐ systolic (mm Hg) Show forest plot | 1 | 44 | Mean Difference (IV, Fixed, 95% CI) | ‐2.0 [‐5.85, 1.85] |
| 5 Blood pressure ‐ diastolic (mm Hg) Show forest plot | 1 | 44 | Mean Difference (IV, Fixed, 95% CI) | ‐4.0 [‐7.26, ‐0.74] |
| 6 Serum testosterone (nmol/L) Show forest plot | 1 | 44 | Mean Difference (IV, Fixed, 95% CI) | ‐0.63 [‐1.37, 0.11] |
| 7 Serum sex hormone‐binding globulin (nmol/L) Show forest plot | 1 | 44 | Mean Difference (IV, Fixed, 95% CI) | 69.44 [34.97, 103.91] |
| 8 Fasting glucose (mmol/L) Show forest plot | 1 | 44 | Mean Difference (IV, Fixed, 95% CI) | ‐0.28 [‐0.99, 0.43] |
| 9 Fasting insulin (mIU/L) Show forest plot | 1 | 44 | Mean Difference (IV, Fixed, 95% CI) | ‐20.0 [‐43.43, 3.43] |
| 10 Total cholesterol (mmol/L) Show forest plot | 1 | 44 | Mean Difference (IV, Fixed, 95% CI) | ‐0.23 [‐0.99, 0.53] |
| 11 Triglyceride levels (mmol/L) Show forest plot | 1 | 44 | Mean Difference (IV, Fixed, 95% CI) | ‐2.20 [‐6.23, 1.83] |
| Outcome or subgroup title | No. of studies | No. of participants | Statistical method | Effect size |
| 1 Ovulation rate Show forest plot | 1 | 64 | Odds Ratio (M‐H, Fixed, 95% CI) | 1.91 [0.70, 5.22] |
| 1.1 Participants with BMI ≥ 30 kg/m2 | 1 | 64 | Odds Ratio (M‐H, Fixed, 95% CI) | 1.91 [0.70, 5.22] |
| 2 Menstrual frequency Show forest plot | 2 | 100 | Odds Ratio (M‐H, Fixed, 95% CI) | 5.59 [2.20, 14.19] |
| 3 Body mass index (kg/m2) Show forest plot | 3 | 132 | Mean Difference (IV, Fixed, 95% CI) | 0.68 [0.40, 0.96] |
| 4 Waist‐hip ratio Show forest plot | 3 | 132 | Mean Difference (IV, Fixed, 95% CI) | ‐0.01 [‐0.02, ‐0.00] |
| 5 Blood pressure ‐ systolic (mm Hg) Show forest plot | 1 | 52 | Mean Difference (IV, Fixed, 95% CI) | ‐2.0 [‐3.95, ‐0.05] |
| 6 Blood pressure ‐ diastolic (mm Hg) Show forest plot | 1 | 52 | Mean Difference (IV, Fixed, 95% CI) | ‐0.20 [‐1.72, 1.32] |
| 7 Serum testosterone (nmol/L) Show forest plot | 1 | 54 | Mean Difference (IV, Fixed, 95% CI) | 0.20 [‐0.34, 0.74] |
| 8 Serum sex hormone‐binding globulin (nmol/L) Show forest plot | 3 | 132 | Mean Difference (IV, Fixed, 95% CI) | ‐0.69 [‐10.37, 8.98] |
| 9 Fasting glucose (mmol/L) Show forest plot | 3 | 132 | Mean Difference (IV, Fixed, 95% CI) | ‐0.21 [‐0.39, ‐0.04] |
| 10 Fasting insulin (mIU/L) Show forest plot | 2 | 80 | Mean Difference (IV, Fixed, 95% CI) | ‐3.98 [‐9.38, 1.42] |
| 11 Total cholesterol (mmol/L) Show forest plot | 2 | 80 | Mean Difference (IV, Fixed, 95% CI) | ‐0.20 [‐0.21, ‐0.19] |
| 12 Triglyceride levels (mmol/L) Show forest plot | 1 | 26 | Mean Difference (IV, Fixed, 95% CI) | 1.0 [0.89, 1.11] |
| Outcome or subgroup title | No. of studies | No. of participants | Statistical method | Effect size |
| 1 Menstrual frequency Show forest plot | 2 | 70 | Odds Ratio (M‐H, Fixed, 95% CI) | 8.88 [2.35, 33.61] |
| 1.1 Participants with BMI < 30 kg/m2 | 1 | 40 | Odds Ratio (M‐H, Fixed, 95% CI) | 10.23 [1.12, 93.34] |
| 1.2 Participants with BMI ≥ 30 kg/m2 | 1 | 30 | Odds Ratio (M‐H, Fixed, 95% CI) | 8.0 [1.52, 42.04] |
| 2 Body mass index (kg/m2) Show forest plot | 2 | 63 | Mean Difference (IV, Fixed, 95% CI) | 0.91 [‐1.88, 3.70] |
| 3 Waist‐hip ratio Show forest plot | 1 | 28 | Mean Difference (IV, Fixed, 95% CI) | 0.02 [‐0.02, 0.06] |
| 4 Serum testosterone (nmol/L) Show forest plot | 2 | 63 | Mean Difference (IV, Fixed, 95% CI) | ‐0.12 [‐0.53, 0.29] |
| 5 Serum sex hormone‐binding globulin (nmol/L) Show forest plot | 2 | 63 | Mean Difference (IV, Fixed, 95% CI) | 2.75 [‐5.26, 10.77] |
| 6 Fasting insulin (mIU/L) Show forest plot | 2 | 63 | Mean Difference (IV, Fixed, 95% CI) | ‐1.46 [‐3.97, 1.06] |