نقش داروهای حساس کننده انسولین (متفورمین، روزیگلیتازون، پیوگلیتازون، D‐کایرو‐اینوسیتول) برای زنان مبتلا به سندرم تخمدان پلیکیستیک، الیگوآمنوره و قدرت پائین باروری
چکیده
پیشینه
سندرم تخمدان پلیکیستیک (polycystic ovary syndrome; PCOS) با تخمکگذاری نادر یا عدم تخمکگذاری و سطوح بالایی از آندروژنها و انسولین (هیپرانسولینمی (hyperinsulinaemia)) تشخیص داده میشود. هیپرانسولینمی، در درجه دوم در مقاومت به انسولین رخ میدهد و با افزایش خطر بیماریهای قلبیعروقی و دیابت ملیتوس همراه است. عوامل حساس کننده انسولین مانند متفورمین ممکن است در درمان آنولاسیون (عدم تخمکگذاری) (anovulation) ناشی از PCOS موثر باشند.
اهداف
ارزیابی اثربخشی و ایمنی داروهای حساس کننده انسولین در بهبود باروری و پیامدهای متابولیک برای زنان مبتلا به PCOS تحت القای تخمکگذاری (ovulation).
روشهای جستوجو
ما بانکهای اطلاعاتی زیر را از ابتدا تا ژانویه 2017 جستوجو کردیم: پایگاه ثبت تخصصی گروه زنان و باروری در کاکرین؛ CENTRAL؛ MEDLINE؛ Embase؛ PsycINFO و CINAHL. پایگاه ثبت کارآزماییهای در حال انجام و فهرست منابع مطالعات مرتبط را جستوجو کردیم.
معیارهای انتخاب
کارآزماییهای تصادفیسازی و کنترل شده مربوط به داروهای حساس کننده انسولین را در مقایسه با دارونما (placebo)، عدم درمان، یا یک عامل القای تخمکگذاری برای زنان مبتلا به PCOS در معرض خطر الیگو یا آنولاسیون وارد کردیم.
گردآوری و تجزیهوتحلیل دادهها
دو نویسنده مرور بهطور مستقل از هم واجد شرایط بودن مطالعات و سوگیری (bias) را ارزیابی کردند. پیامدهای اولیه، نرخ زندهزایی و عوارض جانبی گوارشی بود. پیامدهای ثانویه عبارت بود از سایر پیامدهای بارداری، فراوانی قاعدگی و تاثیرات متابولیک. ما دادهها را برای محاسبه نسبتهای شانس (ORs) تجمعی و 95% فواصل اطمینان (CIs) ترکیب کردیم. ناهمگونی آماری را با استفاده از آماره I2 ارزیابی کردیم و با استفاده از متدولوژی درجهبندی توصیه، ارزیابی، توسعه و ارزشیابی (GRADE)، کیفیت شواهد مربوط به پیامدهای اولیه را گزارش کردیم.
نتایج اصلی
مداخلات متفورمین (metformin)، کلومیفن سیترات (clomiphene citrate)، متفورمین به همراه کلومیفن سیترات، D‐کایرو‐اینوسیتول (D‐chiro‐inositol)، روزیگلیتازون (rosiglitazone)، پیوگلیتازون (pioglitazone) را ارزیابی کردیم. این داروها را با یکدیگر، با دارونما یا عدم درمان مقایسه کردیم. 48 مطالعه را وارد کردیم (4451 زن)، که 42 مورد از این مطالعات متفورمین را بررسی کردند (4024 زن). کیفیت شواهد از بسیار پائین تا متوسط متغیر بود. محدودیتها عبارت بودند از خطر سوگیری (گزارشدهی ضعیف متدولوژی و دادههای ناقص پیامد)، عدم دقت و ناهمگونی.
متفورمین در برابر دارونما یا عدم درمان
شواهد نشان میدهد که متفورمین ممکن است در مقایسه با دارونما نرخ زندهزایی را بهبود ببخشد (OR: 1.59؛ 95% CI؛ 1.00 تا 2.51؛ 4 مطالعه؛ 435 زن؛ I2 = 0%، شواهد با کیفیت پائین). گروه متفورمین دچار عوارض جانبی گوارشی بیشتری شدند (OR: 4.76؛ 95% CI؛ 3.06 تا 7.41؛ 7 مطالعه؛ 670 زن؛ I2 = 61%، شواهد با کیفیت متوسط) اما نرخ بارداری بالینی (OR: 1.93؛ 95% CI؛ 1.42 تا 2.64؛ 9 مطالعه؛ 1027 زن؛ I2 = 43%؛ شواهد با کیفیت متوسط)، تخمکگذاری (OR: 2.55؛ 95% CI؛ 1.81 تا 3.59؛ 14 مطالعه؛ 701 زن؛ I2 = 58%، شواهد با کیفیت متوسط) و تعداد قاعدگی (OR: 1.72؛ 95% CI؛ 1.14 تا 2.61؛ 7 مطالعه؛ 427 زن؛ I2 = 54%؛ شواهد با کیفیت پائین) بالاتری داشتند. هیچ شواهد روشنی در مورد تفاوت در نرخ سقط جنین وجود نداشت (OR: 1.08؛ 95% CI؛ 0.50 تا 2.35؛ 4 مطالعه؛ 748 زن؛ I2 = 0%؛ شواهد با کیفیت پائین).
متفورمین به همراه کلومیفن سیترات در برابر کلومیفن سیترات به تنهایی
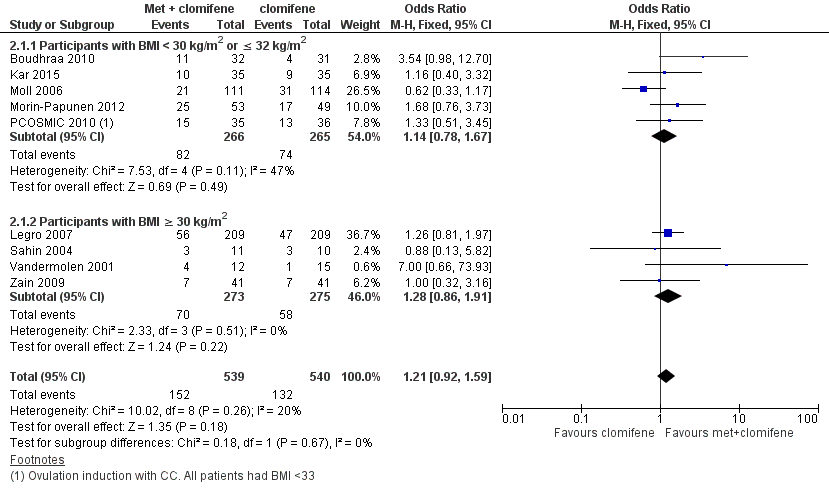
هیچ شواهد قانع کنندهای در مورد تفاوت بین گروهها از لحاظ نرخ زندهزایی وجود نداشت (OR: 1.21؛ 95% CI؛ 0.92 تا 1.59؛ 9 مطالعه؛ 1079 زن؛ I2 = 20%؛ شواهد با کیفیت پائین) اما عوارض جانبی گوارشی با درمان ترکیبی شایعتر بود (OR: 3.97؛ 95% CI؛ 2.59 تا 6.08؛ 3 مطالعه؛ 591 زن؛ I2 = 47%؛ شواهد با کیفیت متوسط). با این حال، گروه درمان ترکیبی دارای نرخ بارداری بالینی (OR: 1.59؛ 95% CI؛ 1.27 تا 1.99؛ 16 مطالعه؛ 1529 زن؛ I2 = 33%؛ شواهد با کیفیت متوسط) و تخمکگذاری (OR: 1.57؛ 95% CI؛ 1.28 تا 1.92؛ 21 مطالعه؛ 1624 زن؛ I2 = 64%، شواهد با کیفیت متوسط) بالاتری بود. تفاوت موجود در نرخ سقط جنین به ازای هر زن، با نرخ بالاتری در گروه درمان ترکیبی دارای اهمیت آماری بود (OR: 1.59؛ 95% CI؛ 1.03 تا 2.46؛ 9 مطالعه؛ 1096 زن؛ I2 = 0%؛ شواهد با کیفیت پائین) اما این امر به دلیل کیفیت پائین شواهد از اهمیت بالینی نامطلوبی برخوردار است و تفاوت روشنی بین گروهها در هنگام تجزیهوتحلیل سقط جنین در هر بارداری وجود نداشت (OR: 1.30؛ 95% CI؛ 0.80 تا 2.12؛ 8 مطالعه؛ 400 بارداری؛ I2 = 0%؛ شواهد با کیفیت پائین).
متفورمین در برابر کلومیفن سیترات
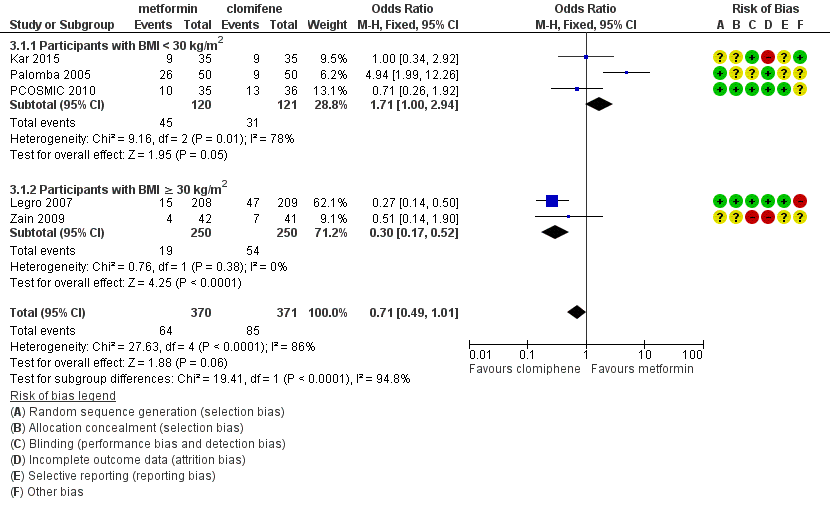
هنگامی که همه مطالعات ترکیب شدند، یافتههای مربوط به زندهزایی بینتیجه و متناقض بود (OR: 0.71؛ 95% CI؛ 0.49 تا 1.01؛ 5 مطالعه؛ 741 زن؛ I2 = 86%؛ شواهد با کیفیت بسیار پائین). در تجزیهوتحلیل زیر‐گروه دارای وضعیت چاقی، زنان چاق دارای نرخ تولد کمتری در گروه متفورمین بودند (OR: 0.30؛ 95% CI؛ 0.17 تا 0.52؛ 2 مطالعه؛ 500 زن؛ I2 = 0%؛ شواهد با کیفیت بسیار پائین)، در حالی که دادههای به دست آمده از گروه غیر‐چاق، یک مزیت احتمالی را برای متفورمین با ناهمگونی بالا نشان داد (OR: 1.71؛ 95% CI؛ 1.00 تا 2.94؛ 3 مطالعه؛ 241 زن؛ I2 = 78%؛ شواهد با کیفیت بسیار پائین). بهطور مشابه، میان زنان چاق مصرف کننده متفورمین نرخ پائینتر بارداری بالینی (OR: 0.34؛ 95% CI؛ 0.21 تا 0.55؛ 2 مطالعه؛ 500 زن؛ I2 = 0%؛ شواهد با کیفیت بسیار پائین) و تخمکگذاری وجود داشت (OR: 0.29؛ 95% CI؛ 0.20 تا 0.43؛ 2 مطالعه؛ 500 زن؛ I2 = 0%؛ شواهد با کیفیت پائین)، در حالی که در زنان غیر‐چاق، گروه دریافت کننده متفورمین دارای بارداری بیشتری بودند (OR: 1.56؛ 95% CI؛ 1.05 تا 2.33؛ 5 مطالعه؛ 490 زن؛ I2 = 41%؛ شواهد با کیفیت بسیار پائین) و هیچ تفاوت روشنی در نرخ تخمکگذاری وجود نداشت (OR: 0.81؛ 95% CI؛ 0.51 تا 1.28؛ 4 مطالعه؛ 312 زن؛ شواهد با کیفیت پائین؛ I2=0%). شواهد واضحی از تفاوت در نرخ سقط جنین وجود نداشت (به طور کلی: (OR: 0.92؛ 95% CI؛ 0.50 تا 1.67؛ 5 مطالعه؛ 741 زن؛ I2 = 52%؛ شواهد با کیفیت بسیار پائین).
D‐کایرو‐اینوسیتول (2 مطالعه)، روزیگلیتازون (1 مطالعه) یا پیوگلیتازون (1 مطالعه) در برابر دارونما یا عدم درمان
ما قادر به نتیجهگیری در مورد سایر داروهای حساس کننده انسولین نبودیم زیرا مطالعات پیامدهای اولیه را گزارش نکردند.
نتیجهگیریهای نویسندگان
مرور بهروز شده ما نشان میدهد که متفورمین به تنهایی ممکن است برای زندهزایی سودمندتر از دارونما باشد، اگرچه کیفیت این شواهد پائین است. هنگامی که متفورمین با کلومیفن سیترات مقایسه شد، دادههای مربوط به زندهزایی بینتیجه بودند و یافتههای ما به دلیل فقدان شواهد محدود شد. نتایج بر اساس شاخص توده بدنی (BMI)، متفاوت بود که بر اهمیت طبقهبندی نتایج بر اساس BMI تاکید میکند. بهبودی در بارداری بالینی و تخمکگذاری نشان میدهد که کلومیفن سیترات در زنان چاق مبتلا به PCOS نسبت به متفورمین برای القای تخمکگذاری مطلوبتر است.
نرخ بارداری بالینی بهبود یافته و تخمکگذاری با متفورمین و کلومیفن سیترات در برابر کلومیفن سیترات به تنهایی نشان میدهد که درمان ترکیبی ممکن است مفید باشد، اگر چه ما نمیدانیم که این درمان به افزایش موارد زندهزایی میانجامد یا خیر. به زنان مصرف کننده متفورمین به تنهایی یا همراه با درمان ترکیبی باید توصیه کرد که هیچ شواهدی برای افزایش سقط جنین وجود ندارد، اما احتمال عوارض جانبی گوارشی بیشتر است.
PICO
خلاصه به زبان ساده
داروهای حساس کننده انسولین برای زنان با تشخیص سندرم تخمدان پلیکیستیک و قدرت پائین باروری
سوال مطالعه مروری
محققین شواهد مربوط به اثربخشی و ایمنی متفورمین (metformin) و سایر داروهایی را که حساسیت بدن به انسولین را بهبود میبخشند، برای القای تخمکگذاری در زنان مبتلا به سندرم تخمدان پلیکیستیک (polycystic ovary syndrome; PCOS) مرور کردند. پیامدهای مطلوب عبارت بودند از نرخ زندهزایی، عوارض جانبی و باروری بیشتر و متابولیک.
پیشینه
زنان مبتلا به PCOS معمولا به علت کمبود تخمکگذاری، دارای قاعدگیهای نادر یا عدم وجود قاعدگی هستند و معمولا مبتلا به ناباروری میشوند. زنان مبتلا به PCOS همچنین در معرض خطر پیشرفت مشکلات متابولیک، مانند دیابت، فشار خون بالا و سطوح بالای کلسترول قرار دارند. به نظر میرسد که سطوح بالای انسولین در PCOS نقش داشته باشد و عموما با چاقی بدتر میشود. درمانهایی که حساسیت را به انسولین افزایش میدهند در این مرور عبارت بودند از متفورمین، روزیگلیتازون (rosiglitazone)، پیوگلیتازون (pioglitazone) و D‐کایرو‐اینوسیتول (D‐chiro‐inositol).
ویژگیهای مطالعه
جستوجو برای مطالعات مناسب در 12 ژانویه 2017 تکمیل شد. در مجموع 48 کارآزماییهای تصادفیسازی و کنترل شده (4451 زن) را در این مرور تجزیهوتحلیل کردیم. مرور بهروز شده فعلی شامل پنج مطالعه بیشتر بود، که همگی متفورمین را در زنان مبتلا به PCOS مورد بررسی قرار دادند. این مطالعات، داروهای حساس کننده انسولین را با دارونما (placebo)، عدم درمان، یا عامل القای تخمکگذاری، کلومیفن سیترات (clomiphene citrate) مقایسه کردند.
نتایج کلیدی
مرور بهروز شده ما نشان داد که متفورمین ممکن است در بهبود احتمال داشتن زندهزایی در مقایسه با عدم درمان یا دارونما مفید باشد. بر اساس شواهد موجود، روشن نیست که متفورمین یا کلومیفن سیترات برای نرخ زندهزایی برتر است یا خیر، اگرچه نرخ بارداری و تخمکگذاری با کلومیفن سیترات بهبود یافت و زنان مصرف کننده کلومیفن سیترات عوارض جانبی کمتری داشتند. با این حال این موضوع که شاخص توده بدنی زن بر درمانهایی که او برای دریافت مزیت بزرگتر مصرف میکنند تاثیر میگذارد امکانپذیر است، اگرچه پژوهش بیشتر در مورد این موضوع ضروری است. به نظر نمیرسد که متفورمین خطر بروز سقط جنین را افزایش دهد.
پیشرفت محدود در پیامدهای متابولیک با درمان متفورمین اهمیت کاهش وزن و تنظیم شیوه زندگی، به ویژه در زنان دارای اضافه وزن مبتلا به PCOS را پررنگتر میکند.
کیفیت شواهد
کیفیت شواهد از بسیار پائین تا متوسط متغیر بود. محدودیتهای اصلی عبارت بود از خطر سوگیری (bias) (همراه با گزارشدهی ضعیف متدولوژی مطالعه و دادههای ناقص پیامد)، عدم دقت و ناهمگونی.
Authors' conclusions
Summary of findings
| Metformin compared to placebo or no treatment for women with polycystic ovary syndrome, oligo amenorrhoea and subfertility | ||||||
| Patient or population: women with polycystic ovary syndrome, oligo amenorrhoea and subfertility | ||||||
| Outcomes | Illustrative comparative risks* (95% CI) | Relative effect | No of participants | Quality of the evidence | Comments | |
| Assumed risk | Corresponding risk | |||||
| Placebo or no treatment | Metformin | |||||
| Live birth rate per woman | 141 per 1000 | 208 per 1000 | OR 1.59 | 435 | ⊕⊕⊝⊝ | |
| Adverse events (gastrointestinal) per woman | 106 per 1000 | 362 per 1000 (267 to 469) | OR 4.76 (3.06 to 7.41) | 670 (7 studies) | ⊕⊕⊕⊝ | |
| Clinical pregnancy rate per woman | 110 per 1000 | 193 per 1000 | OR 1.93 | 1027 | ⊕⊕⊕⊝ | |
| Menstrual frequency per woman | 183 per 1000 | 278 per 1000 (203 to 368) | OR 1.72 (1.14 to 2.61) | 427 (7 studies) | ⊕⊕⊝⊝ | |
| Ovulation rate per woman | 200 per 1000 | 389 per 1000 | OR (1.81 to 3.59) | 701 | ⊕⊕⊕⊝ | |
| Miscarriage rate per woman | 40 per 1000 | 43per 1000 | OR 1.08 | 748 | ⊕⊕⊝⊝ | Miscarriage rate per pregnancy OR 0.58, 95% CI 0.25 to 1.34, 200 pregnancies |
| *The basis for the assumed risk is the median control group risk across studies. The corresponding risk (and its 95% confidence interval) is based on the assumed risk in the comparison group and the relative effect of the intervention (and its 95% CI). | ||||||
| GRADE Working Group grades of evidence High quality: we are very confident that the true effect lies close to that of the estimate of the effect Moderate quality: we are moderately confident in the effect estimate; the true effect is likely to be close to the estimate of effect, but there is a possibility that it is substantially different Low quality: our confidence in the effect estimate is limited; the true effect may be substantially different from the estimate of the effect Very low quality: we have very little confidence in the effect estimate; the true effect is likely to be substantially different from the estimate of effect | ||||||
| aDowngraded one level for serious risk of bias related to failure to report methods of randomisation and/or serious risk of attrition bias in some of the studies. | ||||||
| Metformin combined with clomiphene versus clomiphene alone for women with polycystic ovary syndrome | ||||||
| Population: women with polycystic ovary syndrome | ||||||
| Outcomes | Anticipated absolute effects* (95% CI) | Relative effect | № of participants | Quality of the evidence | Comments | |
| Risk with clomiphene alone | Risk with metformin combined with clomiphene | |||||
| Live birth rate per woman | 257 per 1000 | 295 per 1000 | OR 1.21 | 1079 | ⊕⊕⊝⊝ | |
| Adverse events (gastrointestinal) per woman | 134 per 1000 | 381 per 1000 | OR 3.97 | 591 | ⊕⊕⊕⊝ | |
| Clinical pregnancy rate per woman | 243 per 1000 | 338per 1000 | OR 1.59 | 1529 | ⊕⊕⊕⊝ | |
| Menstrual frequency per woman | Not reported by any of the included studies | |||||
| Ovulation rate per woman | 381per 1000 | 491 per 1000 | OR 1.57 (1.28 to 1.92) | 1624 | ⊕⊕⊕⊝ | |
| Miscarriage rate per woman | Median rates not calculable as there were no events in the control group in 5/8 studies | OR 1.59 | 1096 | ⊕⊕⊝⊝ | Miscarriage rate per pregnancy OR 1.30 95% CI 0.80 to 2.12, 400 pregnancies | |
| *The risk in the intervention group (and its 95% confidence interval) is based on the median risk in the comparison group and the relative effect of the intervention (and its 95% CI). | ||||||
| GRADE Working Group grades of evidence | ||||||
| aDowngraded one level for serious risk of bias related to failure to describe study methods and/or serious risk of attrition bias in several of the studies. | ||||||
| Metformin compared to clomiphene citrate for women with polycystic ovary syndrome | ||||||
| Population: women with polycystic ovary syndrome | ||||||
| Outcomes | Anticipated absolute effects* (95% CI) | Relative effect | № of participants | Quality of the evidence | Comments | |
| Risk with clomiphene citrate | Risk with metformin | |||||
| Live birth rate per woman Participants with BMI < 30 kg/m2 or ≤ 32 kg/m2a | 225 per 1000 | 171 per 1000 (124 to 227) | OR 1.71 (1.00 to 2.94) | 241 (3 studies) | ⊕⊝⊝⊝ very lowc,d | High heterogeneity (I2 = 78%) |
| Live birth rate per woman Participants with BMI ≥ 30 kg/m2a | 198 per 1000 | 69 per 1000 (40 to 114) | OR 0.30 (0.17 to 0.52) | 500 (2 studies) | ⊕⊝⊝⊝ | 74 events |
| Adverse events (gastrointestinal) | Not reported by any of the included studies | |||||
| Clinical pregnancy rate per woman Participants with BMI < 30 kg/m2 or ≤ 32 kg/m2a | 320 per 1000 | 423 per 1000 | OR 1.56 | 490 | ⊕⊝⊝⊝ | 103 events |
| Clinical pregnancy rate per woman Participants with BMI ≥ 30 kg/m2a | 234 per 1000 | 94 per 1000 | OR 0.34 | 500 | ⊕⊝⊝⊝ | 98 events |
| Menstrual frequency | Not reported by any of the included studies | |||||
| Ovulation rate per woman Participants with BMI < 30 kg/m2b | 625 per 1000 | 574 per 1000 | OR 0.81 | 312 | ⊕⊕⊝⊝ | |
| Ovulation rate per woman Participants with BMI ≥ 30 kg/m2b | 534per 1000 | 250per 1,000 | OR 0.29 | 500 | ⊕⊕⊝⊝ | |
| Miscarriage rate per woman | 29 per 1000 | 26 per 1000 (15 to 47) | OR 0.92 (0.50 to 1.67) | 741 | ⊕⊝⊝⊝ very lowc,e | High heterogeneity (I2 = 52%) |
| *The risk in the intervention group (and its 95% confidence interval) is based on the median risk in the comparison group and the relative effect of the intervention (and its 95% CI). | ||||||
| GRADE Working Group grades of evidence | ||||||
| aData subgrouped by BMI, as pooling of BMI groups resulted in high heterogeneity (I2 > 85%) with differing directions of effect. | ||||||
Background
Description of the condition
Polycystic ovary syndrome (PCOS) is a common endocrine disorder affecting at least 5% to 15% of women of reproductive age (Balen 2014; March 2010). The disorder is heterogeneous, encompassing a broad spectrum of signs and symptoms of ovarian dysfunction. The classic presentation, as described by Stein and Leventhal (Stein 1935), with features of obesity, amenorrhoea and hirsutism is one end of the spectrum that, at the other end, includes women with normal menstrual cyclicity and yet with ultrasound evidence of a polycystic ovarian appearance (Fauser 2012). Therefore, no single diagnostic criterion (such as hyperandrogenism or PCO) is sufficient for the clinical diagnosis. The 2003 Rotterdam consensus revised diagnostic criteria for a diagnosis of PCOS are as follows, with two of the following being required:
1. oligo or anovulation, or both, that is, menstrual disturbance;
2. clinical or biochemical signs, or both, of hyperandrogenism;
3. PCO on ultrasound;
4. exclusion of other aetiologies of menstrual disturbance and hyperandrogenism (such as congenital adrenal hyperplasia, androgen‐secreting tumours, Cushing's syndrome) (ESHRE/ASRM 2004). The Rotterdam consensus also defined the diagnostic criteria for ultrasound PCO morphology as either 12 or more follicles measuring 2 mm to 9 mm in diameter or increased ovarian volume, over 10 cm3, when using a transvaginal ultrasound scan (ESHRE/ASRM 2004).
Although PCOS is the commonest cause of anovulatory infertility (Balen 2014), many women may remain undiagnosed in the community. This was indicated by a prospective birth cohort study that investigated PCOS in 728 adult women and found that 69% of women with PCOS did not have a pre‐existing diagnosis (March 2010).
The expression of PCOS symptoms is multifaceted, and the reduced conception rates associated with PCOS may be related to hyperandrogenism, obesity and insulin resistance (Balen 2014). Over the last 20 years, the body of evidence indicating that increased insulin resistance and compensatory high insulin concentrations (hyperinsulinaemia) play a key role in the pathogenesis of PCOS has grown (Balen 2014; Diamanti‐Kandarakis 2010). Insulin resistance is more common in overweight women but can also occur in slim women with the disorder (Alebic 2014; Stepto 2013).
The insulin resistance associated with PCOS can worsen both women's symptom profile and their likelihood of achieving a live birth. Women with insulin resistance have a significantly higher level of testosterone and increased prevalence of hirsutism than women with non‐insulin resistant PCOS (Legro 2006a). In addition, Robinson 1993 reported that women with PCOS who developed menstrual disturbance had lower insulin sensitivity than controls; whilst those with regular cycles had normal insulin sensitivity, similar to controls. Insulin resistant women with PCOS also have a lower ovulation rate and are more likely to develop resistance to ovulation induction with clomiphene citrate compared with women with non‐insulin resistant PCOS.
The impaired glucose tolerance results in accelerated development of type 2 diabetes mellitus compared with the background population (Celik 2014). Celik 2014 conducted a prospective study of insulin resistance in 84 women with PCOS, with a mean follow‐up period of 2.6 years. Of those with normal glucose tolerance, 11.5% converted to insulin resistance (annual incidence rate 4.5%). This compares to 2.3% in the healthy control population (n = 45), with an annual progression of 0.9%. For women with impaired glucose tolerance at the outset, 33.3% developed diabetes (annual incidence rate 10.4%).
The prevalence of insulin resistance in women with PCOS is likely to be exacerbated by obesity; at least 50% of women with PCOS are obese (Balen 2014). Correspondingly, a Spanish study found a 28% prevalence of PCOS in obese women versus 5% in normal‐weight women (Alvarez‐Blasco 2006). Obesity, and particularly abdominal obesity as indicated by an increased waist to hip ratio, is correlated with reduced fecundity (Lord 2002; Pasquali 2003). A small study demonstrated increased preterm birth and low birth‐weight infants in obese versus normal‐weight women with PCOS (De Frene 2014). Weight loss has been shown to improve the endocrine profile, menstrual cyclicity and the likelihood of ovulation (Huber‐Buchholz 1999; Kiddy 1992). A meta‐analysis of six studies found that weight loss reduced testosterone and insulin resistance, although there was insufficient evidence to determine whether reproductive outcomes were improved (Moran 2011).
There is therefore considerable overlap between metabolic syndrome and the metabolic disturbances that feature in PCOS. Metabolic syndrome is a cluster of risk factors that confer an increased risk for cardiovascular disease and type II diabetes (Apridonidze 2005; Ford 2004). Women with metabolic syndrome may have a higher mortality from cardiovascular disease overall, coronary heart disease and stroke compared to women without the syndrome (Ford 2004). The prevalence of metabolic syndrome among women with PCOS was estimated to be nearly two‐fold higher than in the general population (43% versus 24%) (Apridonidze 2005). The prevalence also varies amongst different ethnic groups, which is likely to be influenced by the background prevalence of insulin resistance (Hahn 2007; Soares 2007; Weerakiet 2007). Furthermore, women with PCOS and metabolic syndrome tend to have a higher body mass index (kg/m2) (BMI), waist circumference, blood pressure, fasting glucose and insulin concentration than those without (Ehrmann 2006). PCOS therefore affects reproductive outcomes and confers significant long‐term health risks to patients. PCOS also has a significant psychological impact, with associated with low self esteem, anxiety and depression (Moran 2012).
With the increasing prevalence of obesity in society, the prevalence of PCOS is likely to rise. There are therefore significant financial implications for the funding of PCOS management by health care providers. A 2005 study calculated approximately USD 4.36 billion are spent on managing reproductive‐age women with PCOS, of which USD 533 million is related to infertility (Azziz 2005).
Description of the intervention
Metformin is an antihyperglycaemic biguanide drug, widely used for the treatment of type 2 diabetes mellitus. However, the exact mechanism of action through which metformin has its glucose‐lowering effect, is still being explored (Pernicova 2014). Metformin inhibits hepatic gluconeogenesis and reduces the action of glucagon, resulting in a reduction in circulating insulin and glucose. This is thought to occur via inhibition of mitochondrial complexes with downstream effects on cyclic (adenosine monophosphate) AMP and protein kinase signalling pathways. The effect on protein kinase may also modulate lipid synthesis. Metformin is known to exert its effect on several tissues affected by insulin resistance, including the liver, adipose tissue and the ovaries (Pernicova 2014).
The additional interventions considered in this review are thiazolidinediones including troglitazone, rosiglitazone and pioglitazone. Thiazolidinedione is a selective ligand of the nuclear transcription factor perioxisomes proliferator activated receptor γ. These are widely available, standard medications for the treatment of non‐insulin‐dependent diabetes mellitus (NIDDM). Whilst they lower elevated sugar levels in people with diabetes, when given to non‐diabetic people, insulin levels are lowered but blood glucose levels remain unchanged.
Troglitazone had been used as a therapy for people with diabetes and in some trials involving women with PCOS. However, rare cases of liver damage were reported during its marketed use. The liver damage was usually reversible but very rare cases of hepatic failure, leading to death or liver transplant, were reported (Graham 2003). Injury occurred after short‐ and long‐term troglitazone treatment, leading to its withdrawal from the market in March 2000 (FDA 2002).
Rosiglitazone and pioglitazone do not carry the same degree of risk of hepatotoxicity and are commonly used in clinical trials on women with PCOS. However, they are classified as pregnancy category C drugs according to the Food and Drug Administration (FDA) due to the potential risk of causing fetal growth restriction in animal experiments (Yki‐Jarvinen 2004). A high incidence of weight gain among the users further hampers their use in obese women with PCOS (Baillargeon 2004). Rosiglitazone is currently available in the USA but has been suspended from use in the European Union by the European Medicines Agency and has also been withdrawn from India, New Zealand and South Africa. Pioglitazone has been withdrawn from some countries due to an association with bladder cancer reported with long‐term use (EMA 2011).
How the intervention might work
Increased insulin resistance, hyperandrogenism and obesity have a significant impact on menstrual cyclicity and reproductive health. Metformin may therefore have beneficial effects on anovulatory infertility in PCOS, with reduced levels of circulating insulin acting on the ovaries. Within the ovary itself, metformin may also have a direct impact on cells to reduce excessive steroidogenesis and follicular growth, although the molecular mechanisms remain incompletely understood (Diamanti‐Kandarakis 2010).
As insulin resistance and resulting hyperinsulinaemia are key metabolic features in women with PCOS, their amelioration through either metformin or thiazolidinediones could improve PCOS‐associated symptoms and conception rates.
Why it is important to do this review
This is an update of a Cochrane Review first published in 2003, and previously updated in 2009 and 2012. For this third update, comparing the efficacy and safety of insulin‐sensitising drugs, such as metformin, against placebo or the commonly used clomiphene citrate, for ovulation induction in PCOS, remains clinically important and there are still unanswered questions. A focus of this review has been identifying high‐quality studies that report live birth as a primary outcome.
The first Cochrane Review on the use of insulin‐sensitising drugs for PCOS indicated that metformin was an effective treatment for anovulation in women with PCOS (Lord 2003). However, the study populations in the review had a wide range of BMI. It was therefore difficult to interpret the findings when the results were combined for analysis. Furthermore, most of the included studies had a relatively small sample size, with the highest number recruited (94 women) in the study by Fleming 2002. The first updated review (Tang 2009), included a number of large appropriately powered studies (Legro 2007; Moll 2006; Tang 2006). The current search has included studies up to January 2017. We have added five additional studies with a low risk of bias (Ayaz 2013; Begum 2014; Kar 2015; Machado 2012; Morin‐Papunen 2012). No new studies investigating thiazolidinediones were identified.
Details of abbreviations used in this review and conversion factors of biochemical results can be found in Table 1 and Table 2, respectively.
| Abbreviation | Definition |
| BMI | Body mass index |
| CC | Clomiphene citrate |
| CI | Confidence interval |
| CT | Computerised tomography scan |
| DHEAS | Dehydroepiandrosterone sulphate |
| FSH | Follicle stimulating hormone |
| GTT | Glucose tolerance test |
| HbA1C | Glycosylated haemoglobin |
| HDL | High‐density lipoprotein cholesterol |
| IGFBP‐1 | Insulin growth factor binding protein 1 |
| LDL | Low‐density lipoprotein cholesterol |
| LH | Luteinising hormone |
| NIDDM | Non insulin dependent diabetes mellitus |
| PAI‐1 | Plasminogen activator inhibitor 1 |
| PCO | Polycystic ovary |
| PCOS | Polycystic ovary syndrome |
| RCT | Randomised controlled trial |
| rFSH | Recombinant follicle stimulating hormone |
| SD | Standard deviation |
| SE | Standard error of the mean |
| SHBG | Sex hormone‐binding globulin |
| VLDL | Very low density lipoprotein cholesterol |
| vs | Versus |
| MD | Mean difference |
| Convert from | Convert to | Conversion factor | |
| Cholesterol | mg/dL | mmol/L | 0.026 |
| Triglycerides | mg/dL | mmol/L | 0.11 |
| Insulin | pmol/L | mIU/L (= microIU/mL) | 0.1667 |
| Glucose | mg/dL | mmol/L | 0.056 |
| Progesterone | ng/mL | nmol/L | 3.18 |
| Testosterone | ng/dL | nmol/L | 0.03467 |
| Androstenedione | ng/dL | nmol/L | 0.0349 |
| Estradiol | ng/dL | pmol/L | 36.71 |
| 17‐beta oestradiol | ng/dL | pmol/L | 36.71 |
| Dehydroepiandrosterone sulphate | microg/dL | micromol/L | 0.02714 |
| Sex hormone‐binding globulin | microg/dL | nmol/L | 34.7 |
| Standard deviation | Standard error | Standard deviation | Sqrt n |
| Confidence intervals | Confidence intervals | Standard error | (upper limit ‐ lower limit)/3.92 |
Objectives
To evaluate the effectiveness and safety of insulin‐sensitising drugs in improving reproductive and metabolic outcomes for women with PCOS undergoing ovulation induction.
Methods
Criteria for considering studies for this review
Types of studies
Published and unpublished randomised controlled trials (RCTs) were eligible for inclusion. We excluded non‐randomised and quasi‐randomised studies due to the high risk of bias. Cross‐over studies were included but we only included data from the first phase in meta‐analyses.
Types of participants
We included women with oligo and anovulatory PCOS, based on the diagnostic criteria set by the Rotterdam consensus (ESHRE/ASRM 2004), undergoing ovulation induction. Women having in vitro fertilisation (IVF) or intracytoplasmic spermatic injection (ICSI) were excluded, as this is covered in a separate Cochrane Review (Tso 2014).
Types of interventions
-
Metformin, rosiglitazone or pioglitazone versus placebo or no therapy
-
Metformin, rosiglitazone or pioglitazone in conjunction with an ovulation induction agent versus the ovulation induction agent
-
Metformin, rosiglitazone or pioglitazone versus clomiphene citrate
Since troglitazone has been withdrawn from the market, we excluded studies involving troglitazone from the current review. The use of gonadotrophins, contraceptive pills or aromatase inhibitors, such as letrozole, for the treatment of PCOS are the subject of separate Cochrane Reviews (Bordewijk 2017; Costello 2007; Franik 2014, respectively).
Types of outcome measures
Primary outcomes
1. Live birth rate, as defined by included studies
2. Adverse events (gastrointestinal side effects)
Secondary outcomes
3. Clinical pregnancy rate, as defined by included studies (biochemical pregnancies were excluded)
4. Ovulation rate, as defined by included studies
5. Menstrual frequency, as defined by included studies
6. Miscarriage, as defined by included studies
7. Multiple pregnancy
8. Anthropometric outcomes:
a) Body mass index (BMI)
b) Waist to hip ratio
c) Blood pressure
9. Endocrine outcomes
a) Serum testosterone
b) Serum sex hormone‐binding globulin
10. Metabolic outcomes
a) Fasting blood glucose
b) Fasting insulin
c) Cholesterol
d) Triglycerides
Search methods for identification of studies
We searched for all published and unpublished RCTs without language restriction and in consultation with Cochrane Gynaecology and Fertility's (CGF) Information Specialist. The original search was conducted in 2003. The first updated search was completed on 11 September 2008, the second update was completed on 3 October 2011 and the current search was completed on 12 January 2017.
Electronic searches
We searched the CGF Specialised Register of Controlled Trials, PROCITE platform (searched 12 January 2017) (Appendix 1); the Cochrane Central Register of Controlled Trials via the Cochrane Register of Studies Online (CRSO) (searched 12 January 2017) (Appendix 2); MEDLINE Ovid (from 1946 to 12 January 2017) (Appendix 3); Embase Ovid (from 1980 to 12 January 2017) (Appendix 4); PsycINFO Ovid (from 1806 to 12 January 2017) (Appendix 5); and CINAHL EBSCO platform (from 1961 to 12 January 2017) (Appendix 6).
We combined the MEDLINE search with the Cochrane highly sensitive search strategy for identifying randomised trials, which appears in the Cochrane Handbook of Systematic Reviews of Interventions (Lefebvre 2011). The Embase, PsycINFO and CINAHL searches were combined with trial filters developed by the Scottish Intercollegiate Guidelines Network (SIGN) www.sign.ac.uk/search‐filters.html.
Other electronic sources of trials included:
-
trial registers for ongoing and registered trials‐
-
World Health Organization (WHO) International Clinical Trials Registry Platform (ICTRP)
-
DARE (Database of Abstracts of Reviews of Effects) in the Cochrane Library
-
Web of Science (http://metodologia.lilacs.bvsalud.org/php/)
-
OpenGrey for unpublished literature from Europe (http://www.greynet.org/opengreyrepository.html)
-
LILACS database for trials in Portuguese and Spanish (http://metodologia.lilacs.bvsalud.org/php/)
-
PubMed and Google Scholar for recent trials not yet indexed in MEDLINE
Searching other resources
We handsearched the reference sections of all trials obtained. In liaison with the CGF Information Specialist we searched relevant journal articles and conference abstracts that are not covered in the CGF register.
Data collection and analysis
Selection of studies
The first review of this subject (Lord 2003) was undertaken by three review authors (JML, IHF and RJN), two of whom work in reproductive medicine (JML, RJN). Three review authors (TT, EY, AHB) updated the review (Tang 2009; Tang 2012). Three review authors (LCM, TT and AHB) performed the current update. We employed the search strategy described previously to obtain titles and, where possible, abstracts of studies that were potentially relevant to the review. Two review authors (LCM and TT) screened the titles and abstracts and then obtained copies of the relevant full‐text articles. Two review authors (LCM and TT) independently assessed whether the studies met the inclusion criteria, with disagreements resolved by discussion (for details of the screening and selection process see Figure 1; Figure 2).
Study flow diagram since publication

Study flow diagram 2017 update
Data extraction and management
Data collection process
Two review authors (LCM and TT) independently extracted data from eligible studies, and resolved any disagreements by discussion. We extracted data onto a pre‐designed form (see Data items). Further information was sought from the authors where papers contained insufficient information to make a decision about eligibility.
Data items
We have presented a summary of included trials in the table 'Characteristics of included studies'. This information includes the following:
-
Method of randomisation
-
Blinding to treatment allocation
-
Quality of allocation concealment
-
Number of women randomised
-
Location, duration and timing of the trial
Characteristics of women
-
Mean age, BMI, testosterone, fasting insulin and glucose levels
-
Study inclusion and exclusion criteria
-
Dropout rate
Interventions
-
Type of insulin‐sensitising drug
-
Co‐interventions such as clomiphene citrate or lifestyle advice
Outcomes
As stated under 'Types of outcome measures'
Assessment of risk of bias in included studies
We performed risk of bias assessment in accordance with the Cochrane 'Risk of bias' assessment tool (Higgins 2011).
We judged the following items and summarised them in the 'Risk of bias' table (Figure 3; Figure 4).

Risk of bias graph: review authors' judgements about each risk of bias item presented as percentages across all included studies

Risk of bias summary: review authors' judgements about each risk of bias item for each included study
-
Sequence generation
-
low risk (for example, computer‐generated random numbers, random number table)
-
high risk (systematic methods such as alternation; assignment based on case record number, date of presentation or date of birth)
-
unclear risk (insufficient information in the study or from the study author about the process of sequence generation)
-
-
Allocation concealment
-
low risk (for example, central randomisation, sequentially numbered, opaque, sealed envelopes)
-
high risk (for example, open‐label trial, assignment based on case record number, date of presentation or date of birth)
-
unclear risk (insufficient information in the study or from the study author about the process of allocation concealment)
-
-
Blinding
-
low risk (double‐blind study: participants, providers and assessors blinded)
-
high risk (unblinded)
-
unclear risk (insufficient information in the study or from the study author about the level of blinding)
-
-
Incomplete outcome data addressed
-
low risk (for example, no missing data, reasons for missing data were reported and were unlikely to influence the outcomes, or missing data were balanced across the groups)
-
high risk (for example, reasons for missing data were not addressed, missing data likely to affect the outcomes, or data analysed per protocol)
-
unclear risk (insufficient information in the study or from the author about the detail of incomplete outcome data)
-
-
Selective outcome reporting
-
low risk (for example, the study protocol was available, pre‐specified outcome measures were reported)
-
high risk (for example, the study protocol was unavailable and pre‐specified outcome measures were not reported)
-
unclear risk (insufficient information in the study or from the author about process of outcome reporting)
-
Measures of treatment effect
We used odds ratio (OR) as the measure of effect for each dichotomous outcome and the mean difference (MD) for each continuous outcome. We have presented 95% confidence intervals (CI) for all outcomes.
Unit of analysis issues
The primary unit of analysis was each woman, for example, we calculated ovulation rate as rate of women in whom ovulation was confirmed. Where studies reported 'per‐cycle' data, we contacted the study authors to request 'per‐woman' data. When these data were not available, we have not pooled the per‐cycle ovulation data but presented them in additional tables (Table 3; Table 4; Table 5; Table 6; Table 7). The exceptions to this were miscarriage and multiple pregnancy rates, which we analysed per woman, followed by a sensitivity analysis using per‐pregnancy data.
| Study ID | Metformin | Placebo | P value | ||
| Events | Cycles | Events | Cycles | ||
| BMI < 30 kg/m2 | |||||
| 27 | 32 | 11 | 32 | ||
| 7 | 12 | 3 | 12 | ||
| 3 | 9 | 3 | 9 | ||
| 17 | 153 | 20 | 150 | ||
| 6 | 16 | 1 | 16 | ||
| BMI ≥ 30 kg/m2 | |||||
| 37 | 45 | 30 | 47 | ||
| 3 | 9 | 6 | 11 | ||
| 4 | 9 | 3 | 9 | ||
| 8 | 28 | 0 | 28 | ||
| 9 | 22 | 9 | 22 | ||
| 12 | 35 | 1 | 26 | ||
| 5 | 63 | 5 | 51 | ||
| 7 | 14 | 6 | 15 | ||
| 17 | 32 | 13 | 33 | ||
| 0 | 12 | 1 | 14 | ||
| 1 | 12 | 1 | 15 | ||
| Study ID | Metformin + | Clomiphene | P value | ||
| Events | Cycles | Events | Cycles | ||
| BMI < 30 kg/m2 | |||||
| 16 | 21 | 8 | 21 | ||
| 10 | 16 | 6 | 16 | ||
| 17 | 32 | 10 | 31 | ||
| 35 | 45 | 29 | 45 | ||
| 17 | 40 | 5 | 40 | ||
| 15 | 21 | 5 | 15 | ||
| 11 | 16 | 3 | 12 | ||
| 84 | 141 | 98 | 168 | ||
| 4 | 9 | 1 | 9 | ||
| 27 | 35 | 23 | 36 | ||
| BMI ≥ 30 kg/m2 | |||||
| 26 | 28 | 22 | 28 | ||
| 7 | 16 | 1 | 15 | ||
| 582 | 964 | 462 | 942 | ||
| 19 | 21 | 2 | 25 | ||
| 38 | 51 | 34 | 55 | ||
| 34 | 52 | 36 | 55 | ||
| 5 | 12 | 4 | 14 | ||
| 9 | 12 | 4 | 15 | ||
| 38 | 41 | 24 | 41 | ||
| Metformin | Clomiphene citrate | ||||
| Study ID | Events | Cycles | Events | Cycles | P value |
| BMI < 30 kg/m2 | |||||
| 129 | 205 | 148 | 221 | ||
| 23 | 35 | 23 | 36 | ||
| BMI ≥ 30 kg/m2 | |||||
| 296 | 1019 | 462 | 942 | ||
| 4 | 42 | 7 | 41 | ||
| Inositol | Placebo | ||||
| Study ID | Events | Cycles | Events | Cycles | P value |
| BMI < 30 kg/m2 | |||||
| 128 | 136 | 130 | 147 | ||
| 19 | 22 | 6 | 22 | ||
| Rosiglitazone | Placebo | ||||
| Study ID | Events | Cycles | Events | Cycles | P value |
| BMI ≥ 30 kg/m2 | |||||
| 16 | 32 | 11 | 32 | ||
In order to reduce a carry‐over of treatment effect in cross‐over trials, we only used data from the first phase (such as before cross‐over) when the washout period was less than two months. The rationale is that oligo amenorrhoea is usually accepted as a menstrual cycle length over five to eight weeks. Therefore, the washout period of treatment effect on ovulation should ideally be more than eight weeks.
Dealing with missing data
We analysed the data on an intention‐to‐treat basis where possible and sought any missing data from the study authors.
When this information was not available, we performed the analysis using the original number of women randomised.
Assessment of heterogeneity
Heterogeneity reflects any type of variability among the studies in a systematic review. A consistent treatment effect among the included studies suggests there is sufficient homogeneity for pooled analysis. We used the I2 statistic (Higgins 2003) to quantify the inconsistency among the studies. We regarded an I2 statistic of over 50% as indicative of substantial heterogeneity (Deeks 2011).
Assessment of reporting biases
In view of the difficulty of detecting and correcting for publication bias and other reporting biases, we aimed to minimise the potential impact by ensuring a comprehensive search for eligible studies and by being alert for duplication of data. We planned to produce funnel plots for the primary outcome, live birth, which explore the possibility of small study effects (a tendency for estimates of the intervention effect to be more beneficial in smaller studies) (Sterne 2011).
Data synthesis
We performed statistical analyses according to the statistical guidelines for review authors developed by Cochrane and published in the Cochrane Handbook for Systematic Reviews of Interventions (Deeks 2011). We used Review Manager 5 (RevMan 5) to perform all the statistical analyses (RevMan 2014).
We used odds ratio (OR), with 95% confidence interval (CI), as the measure of effect for each dichotomous outcome using the Mantel‐Haenszel method; whilst we presented continuous outcome differences between the two groups as mean difference (MD) with 95% CI. We employed a fixed‐effect model in the analysis, and have commented on significant heterogeneity where it occurred.
For clinical outcomes, we stratified comparisons by BMI, divided into obese and non‐obese groups, with an additional stratum for studies in which BMI was not reported. We defined 'obese' as BMI equal to or over 30 kg/m2.
Subgroup analysis and investigation of heterogeneity
As noted above, we subgrouped the primary analysis by BMI (obese or non‐obese), in order to assess any differences in effect within these subgroups.
We also conducted subgroup analyses by sensitivity to clomiphene citrate (sensitive or resistant), in relevant analyses (i.e. including clomiphene citrate group) where substantial heterogeneity was detected (I2 over 50%).
We also planned to explore other possible explanations where heterogeneity was substantial, by examining other clinical or methodological differences between the studies.
Sensitivity analysis
To determine that the conclusions of this review were robust, we performed sensitivity analyses after excluding studies with unclear or high risk of bias in sequence generation, allocation concealment or blinding method. We also performed a sensitivity analysis to compare the effect of reporting miscarriage and multiple pregnancy data 'per pregnancy'.
Overall quality of the body of evidence: 'Summary of findings' table
We prepared 'Summary of findings' tables using GRADEpro GDT software (GRADEpro GDT 2015). These tables evaluated the overall quality of the body of evidence for the main review outcomes (live birth, adverse events, clinical pregnancy, menstrual frequency, ovulation and miscarriage) with respect to the most clinically relevant comparisons (metformin versus placebo or no treatment, metformin with clomiphene citrate versus clomiphene citrate alone, metformin versus clomiphene citrate). Two review authors working independently evaluated the quality of the evidence using GRADE criteria (study limitations (i.e. risk of bias), consistency of effect, imprecision, indirectness and publication bias). Judgements about evidence quality (high, moderate, low or very low) were justified, documented, and incorporated into reporting of results for each outcome (Schünemann 2011; Schünemann 2013). We resolved any disagreements by consensus.
For one of our comparisons (metformin versus clomiphene citrate), there was high heterogeneity for some outcomes which was associated with BMI status, so for this comparison we decided as a post hoc measure to present the data by BMI subgroup.
Details of abbreviations used in this review and conversion factors of biochemical results can be found in Table 1 and Table 2, respectively.
Results
Description of studies
See Characteristics of included studies and Characteristics of excluded studies for full details of the trials.
Results of the search
In this updated review there are 48 included studies and 35 excluded studies(Figure 2).
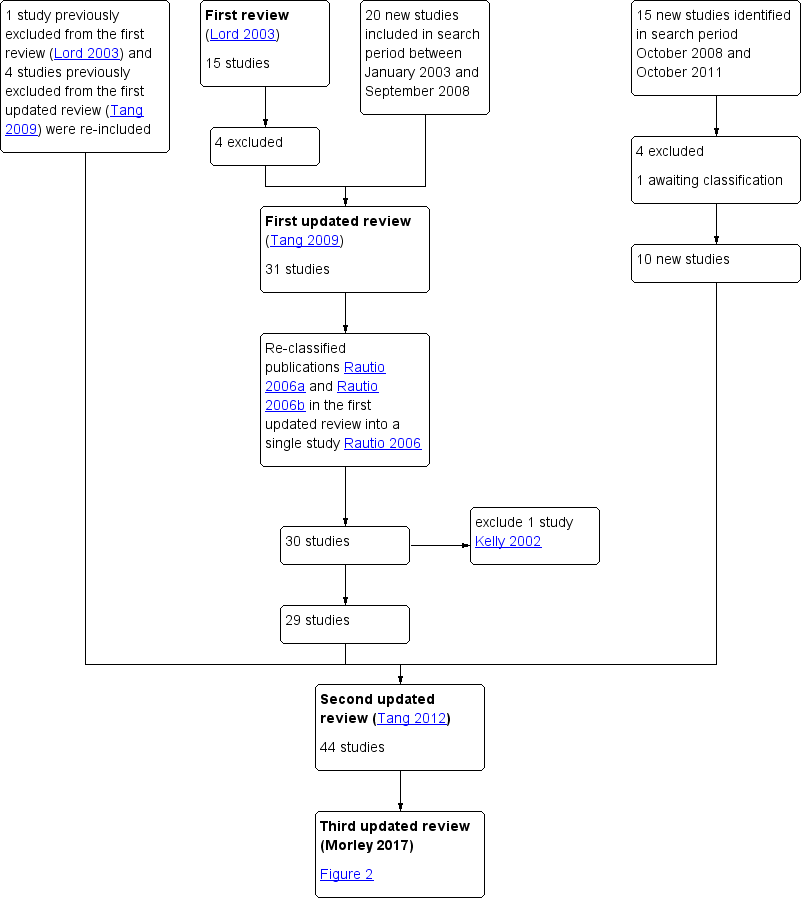
In the first review (Lord 2003), 24 RCTs met the initial eligibility criteria. Nine studies were excluded, leaving 15 to be included in the analysis.
In the first update of the review (Tang 2009) (search period January 2003 to September 2008), the review authors identified 37 RCTs, of which 20 were suitable for inclusion. They excluded four previously included studies (Azziz 2001; Kocak 2002; Nestler 1996; Pasquali 2000). Including the studies in the first review (Lord 2003; total amended to 11 studies), Tang 2009 included 31 studies in the analysis (Figure 1).
In the second update of the review (Tang 2012) (search period October 2008 to October 2011), the review authors identified 15 studies. They excluded four studies and one study awaited classification. Therefore, 10 new studies were identified for inclusion (Ben Ayed 2009; Boudhraa 2010; Karimzadeh 2010; Ladson 2011; Lam 2011; Otta 2010; PCOSMIC 2010; Romualdi 2010; Siebert 2009; Williams 2009) (Figure 1). After further consideration, they re‐included five previously excluded studies (Brettenthaler 2004; Carmina 2004; Khorram 2006; Pasquali 2000; Sahin 2004). Furthermore, they re‐classified two publications in the first updated review (Tang 2009) into a single study (Rautio 2006; formerly Rautio 2006a and Rautio 2006b) and removed Kelly 2002, after a protocol update removed hirsutism from secondary outcomes. Hence, Tang 2012 included a total of 44 studies in the analysis (Figure 1).
In the current review update, (third update, search period January 2011 to January 2017), we considered the full texts of 13 articles (Figure 2). Of these, we excluded nine (Abuelghar 2013; Curi 2012; Chaudhry 2016; Heathcote 2013;Leanza 2014; Palomba 2011; Papaleo 2009; Salman 2014; Unfer 2011) and included four (Ayaz 2013; Machado 2012; Kar 2015; Begum 2014). Morin‐Papunen 2012 was the study awaiting classification from the previous update, and we have now included it in this update, therefore we have included a total of five additional studies in this review.
Included studies
Study design and Setting
The newly included studies for this current update (Ayaz 2013; Begum 2014; Kar 2015; Machado 2012;Morin‐Papunen 2012) all recorded pregnancy outcomes following treatment. In these studies, metformin was investigated with, and without the addition of clomiphene citrate.
Twenty‐three of the included studies were documented as being double blind. Five studies were not double blind: Hwu 2005;Khorram 2006;Nestler 1998;Siebert 2009;Zain 2009; and the remainder were classified as unclear.
Two of the studies were cross‐over trials (Sturrock 2002; Trolle 2007). We only analysed the first phase from Sturrock 2002 as we considered the washout period to be short (four weeks). Although the study by Trolle 2007 was also a cross‐over study, there was an eight‐week washout period and no women became pregnant during the trial period. We therefore decided to include the published data of this study after the cross‐over period (second phase).
The included studies originated from a number of countries, including Argentina, Bangladesh, Brazil, Denmark, Egypt, Finland, Germany, Hong Kong, India, Iran, Italy, Malaysia, the Netherlands, New Zealand, Saudi Arabia, South Africa, Tunisia, Turkey, UK, USA and Venezuela.
Participants
The number of women in the studies ranged from 19 to 626. In total, 4451 women (4014 participants had metformin, 497 participants had other insulin‐sensitising drugs) were included in this updated review. The range of BMI in included participants was (24.3 to 39.4 kg/m2).
All the women had a diagnosis of PCOS based upon standardised criteria; two out of three of PCOS on ultrasound, oligo or anovulation, clinical or biochemical signs of hyperandrogenism (ESHRE/ASRM 2004). The age range of participants was 24.2 to 32.8 years with the range of fasting insulin concentrations between 6.3 and 54.67 mIU/L and testosterone levels of 1.3 to 4.67 nmol/L. However, several studies did not provide these data.
Most women recruited in the studies using rosiglitazone, pioglitazone or D‐chiro‐inositol (Brettenthaler 2004; Glintborg 2005; Lam 2011; Rautio 2006) were not planning a pregnancy due to the uncertainty of the safety of using these products in pregnancy.
Interventions
In total, including the first review and the last update, 42 out of 48 trials assessed the benefits of using metformin for women with PCOS. Eighteen trials compared metformin alone with placebo or no treatment (Baillargeon 2004; Carmina 2004; Fleming 2002; Hoeger 2004; Jakubowicz 2001; Karimzadeh 2007; Karimzadeh 2010; Lord 2006; Morin‐Papunen 2012; Nestler 1998; Ng 2001; Onalan 2005; Otta 2010; Pasquali 2000; PCOSMIC 2010; Tang 2006; Vandermolen 2001; Yarali 2002).
Twenty‐two studies investigated the benefits of using metformin combined with clomiphene citrate on reproductive outcomes (Ayaz 2013; Ben Ayed 2009; Boudhraa 2010; El‐Biely 2001; Hwu 2005; Jakubowicz 2001; Kar 2015; Karimzadeh 2010; Khorram 2006; Legro 2007; Machado 2012; Malkawi 2002; Moll 2006; Nestler 1998; Ng 2001; PCOSMIC 2010; Sahin 2004, Siebert 2009; Sturrock 2002; Vandermolen 2001; Williams 2009; Zain 2009). Five studies compared metformin versus clomiphene citrate (Begum 2014; Karimzadeh 2010; Legro 2007; Palomba 2005; Zain 2009).
Specific advice on lifestyle modification was included in the study protocol in ten trials (Ben Ayed 2009; Boudhraa 2010; Brettenthaler 2004; Hoeger 2004; Karimzadeh 2010; Otta 2010; Pasquali 2000; PCOSMIC 2010; Romualdi 2010; Tang 2006).
The duration of the trials ranged from 4 to 48 weeks with an average of 19.5 weeks. The median daily dose of metformin used in the trials was 1500 mg.
Outcomes
Most trials reported clinical pregnancy rate but only 11 studies reported live birth rates (Boudhraa 2010; Kar 2015; Legro 2007; Moll 2006; Morin‐Papunen 2012; Ng 2001; PCOSMIC 2010; Sahin 2004; Vandermolen 2001; Yarali 2002; Zain 2009). The four studies listed largest studies reporting live birth rate were Legro 2007; Moll 2006; Morin‐Papunen 2012; PCOSMIC 2010. Only two studies (Legro 2007; PCOSMIC 2010) identified live birth rate as a primary outcome measure. Eight studies that were suitable for meta‐analysis reported adverse events (Fleming 2002; Moghetti 2000; Moll 2006; Morin‐Papunen 2012; Ng 2001; PCOSMIC 2010; Trolle 2007; Yarali 2002).
Excluded studies
In the previous update of the review (Tang 2012), the review authors excluded a total of 22 studies. Of these, they excluded two studies due to lack of randomisation (Aroda 2009; Santonocito 2009) and four studies (Azziz 2001; Azziz 2003; Dunaif 1996; Mantzoros 1997) because troglitazone had been withdrawn from the market. Another study, Kelly 2002 was excluded because the revised protocol had removed hirsutism from the outcomes.
In this third update of the review, we excluded four of the studies previously awaiting classification due to inadequate information (Chaudhury 2008; Constantino 2009; Farzadi 2006;Refaie 2005). In the updated search (January 2011 to January 2017), we identified 13 studies for possible inclusion, of which nine were excluded (Abuelghar 2013; Chaudhry 2016; Curi 2012; Heathcote 2013; Leanza 2014; Palomba 2011; Papaleo 2009; Salman 2014; Unfer 2011). We excluded Palomba 2011 as participants were undergoing in vitro fertilisation, which does not meet the inclusion criteria for this review (Types of participants).
A summary of studies included and excluded in the different versions of this review can be found in Figure 2.
Risk of bias in included studies
See Figure 3 for risk of bias and Figure 4 for a summary of the risk of bias.
We carried out sensitivity analysis by including data only from studies with low risk of bias, determined by sequence generation, allocation concealment and blinding method. Only 18 out of 48 studies met this criterion (Baillargeon 2004; Chou 2003; Eisenhardt 2006; Fleming 2002; Glintborg 2005; Hoeger 2004; Karimzadeh 2007; Lam 2011; Legro 2007; Lord 2006; Machado 2012; Maciel 2004; Moll 2006; Morin‐Papunen 2012; Ng 2001; Pasquali 2000; PCOSMIC 2010; Tang 2006) with 15 out of the 18 studies investigating the effects of metformin. Three out of the 10 newly included studies, in the search period between October 2008 and October 2011, met this criterion (Ladson 2011; Lam 2011; PCOSMIC 2010). Two studies from the January 2011 to January 2017 update met the criteria for subgroup analysis; Machado 2012 and Morin‐Papunen 2012.
Allocation
Sequence generation
Sequence generation was unclear in 18 studies (Ayaz 2013; Begum 2014; Ben Ayed 2009; Boudhraa 2010; Brettenthaler 2004; Carmina 2004; Jakubowicz 2001; Kar 2015; Karimzadeh 2010; Malkawi 2002; Moghetti 2000; Nestler 1998; Nestler 1999; Romualdi 2010; Sahin 2004; Sturrock 2002; Williams 2009; Zain 2009).
Allocation concealment
Allocation concealment was unclear in 25 studies (Begum 2014; Ben Ayed 2009; Boudhraa 2010; Brettenthaler 2004; Carmina 2004; El‐Biely 2001; Gerli 2003; Hwu 2005; Kar 2015; Karimzadeh 2010; Khorram 2006; Malkawi 2002; Nestler 1998; Onalan 2005; Otta 2010; Palomba 2005; Rautio 2006; Sahin 2004; Siebert 2009; Sturrock 2002; Trolle 2007; Vandermolen 2001; Williams 2009; Yarali 2002; Zain 2009). We included one open label‐trial (Hwu 2005).
Blinding
The majority of the studies (38/48) were described as double‐blinded. However, the risk of bias related to the method of blinding was unclear for 18 of the 48 (Ayaz 2013; Begum 2014; Ben Ayed 2009; Boudhraa 2010; Brettenthaler 2004; Carmina 2004; El‐Biely 2001; Gerli 2003; Karimzadeh 2010; Malkawi 2002; Onalan 2005; Otta 2010; Palomba 2005; Rautio 2006; Sahin 2004;Sturrock 2002; Williams 2009; Yarali 2002). We clarified allocation concealment and blinding in the Machado 2012 study through correspondence with the study authors. We classified the risk of bias in five studies as high for this domain (Hwu 2005; Khorram 2006; Nestler 1998; Siebert 2009; Zain 2009).
Incomplete outcome data
Fifteen studies were at high risk of attrition bias due to high dropout rates, unequal dropouts between the groups, reasons of missing data not provided or use of per‐protocol analysis (Baillargeon 2004; Brettenthaler 2004; Chou 2003; Fleming 2002; Gerli 2003; Jakubowicz 2001; Kar 2015; Lam 2011; Nestler 1998; Onalan 2005; Otta 2010; Pasquali 2000; Sturrock 2002; Tang 2006; Zain 2009). Nineteen studies were at low risk of attrition bias (Ayaz 2013; Glintborg 2005; Hoeger 2004; Hwu 2005; Khorram 2006; Legro 2007; Machado 2012; Maciel 2004; Malkawi 2002; Moghetti 2000; Morin‐Papunen 2012; Nestler 1999; Palomba 2005; PCOSMIC 2010; Rautio 2006; Romualdi 2010; Siebert 2009; Trolle 2007; Yarali 2002).
Selective reporting
Low risk of selective reporting was found in fifteen studies (Eisenhardt 2006; Glintborg 2005; Hoeger 2004; Karimzadeh 2010; Lam 2011; Legro 2007; Lord 2006; Moghetti 2000; Moll 2006; Ng 2001; Pasquali 2000; PCOSMIC 2010; Romualdi 2010; Tang 2006; Trolle 2007).
Other potential sources of bias
Overall four studies appeared to be at high risk of other sources of bias (Hwu 2005; Legro 2007; Moghetti 2000; Trolle 2007) although the majority of the studies did not provide sufficient information for analysis. We have presented forest plots for the primary outcome live birth rate in Figure 5; Figure 6; Figure 7, for Analysis 1.1, Analysis 2.1 and Analysis 3.1, respectively.

Forest plot of comparison: 1 Metformin versus placebo or no treatment, outcome: 1.1 Live birth rate
Forest plot of comparison: 2 Metformin combined with clomiphene citrate versus clomiphene citrate alone, outcome: 2.1 Live birth rate
Forest plot of comparison: 3 Metformin versus clomiphene citrate, outcome: 3.1 Live birth.
Effects of interventions
See: Summary of findings for the main comparison Metformin compared to placebo or no treatment for women with polycystic ovary syndrome; Summary of findings 2 Metformin combined with clomiphene citrate versus clomiphene citrate alone for women with polycystic ovary syndrome; Summary of findings 3 Metformin compared to clomiphene citrate for women with polycystic ovary syndrome
1. Metformin versus placebo or no treatment
1.1 Live birth rate
When we compared metformin to placebo, only a limited number of studies reported live birth rate (Morin‐Papunen 2012; Ng 2001; PCOSMIC 2010; Yarali 2002). When we pooled these four studies, there was marginal evidence of a difference in live birth rate favouring metformin, with a number needed to treat for an additional beneficial outcome of 13 women (OR 1.59, 95% CI 1.00 to 2.51, 4 studies, 435 women, I2 = 0%, low‐quality evidence (Analysis 1.1). However, the wide‐ranging confidence intervals and low evidence quality make the advantage offered by metformin difficult to interpret clinically.
In the subgroup analysis by obesity status the test for subgroup differences showed no evidence of a difference between the subgroups. There was no clear evidence of a difference in live birth rate in either subgroup (BMI of < 30 kg/m2: OR 1.51, 95% CI 0.94 to 2.44, 3 studies, 370 women, I2 = 0% or BMI > 30 kg/m2: OR 2.87, 95% CI 0.51 to 16.01, 1 study, 65 women, I2 = 0%) (Analysis 1.1). However, the broad confidence intervals due to reducing the number of combined studies for this analysis, render the results unclear. A sensitivity analysis, which excluded studies with unclear or high risk of bias left two studies remaining (Morin‐Papunen 2012; PCOSMIC 2010) (OR 1.64, 95% CI 1.02 to 2.63, 2 studies, 385 women, I2 = 0%). It should be noted that the women in these two studies had a BMI greater than 30 kg/m2. The large and good‐quality study by Morin‐Papunen 2012 contributed 93.8% of the weight of the result (OR 0.95, 95% CI 0.95 to 2.55, 320 women). These results therefore suggest a potential benefit in live birth rate when using metformin compared with placebo, although the number of studies were small.
1.2 Adverse events
Women in the metformin group experienced a higher incidence of gastrointestinal side effects than the placebo group (OR 4.76, 95% CI 3.06 to 7.41, 7 studies, 670 women, I2 = 61%, moderate‐quality evidence). In the subgroup analysis by obesity status, the test for subgroup differences showed no evidence of a difference between the subgroups. Sensitivity analysis, which excluded studies with unclear or high risk of bias did not change the inference.
1.3 Clinical pregnancy rate
Nine trials reported clinical pregnancy rates (Fleming 2002; Karimzadeh 2007; Karimzadeh 2010; Lord 2006; Morin‐Papunen 2012; Ng 2001; PCOSMIC 2010; Tang 2006; Yarali 2002) (Analysis 1.3). Pregnancy rates were higher in the metformin arm (OR 1.93, 95% CI 1.42 to 2.64, 9 studies, 1027 women, I2 = 43%, moderate‐quality evidence). In subgroup analysis by obesity status the test for subgroup differences showed no evidence of a difference between the subgroups. In an attempt to improve heterogeneity we performed a sensitivity analysis, which excluded studies with unclear or high risk of bias, including the following studies (Fleming 2002; Karimzadeh 2007; Lord 2006; Machado 2012; Morin‐Papunen 2012; Ng 2001; PCOSMIC 2010; Tang 2006). However, this did not alter the inference or improve heterogeneity.
1.4 Ovulation rate
There was evidence of a benefit from metformin with respect to the ovulation rate per participant (OR 2.55, 95% CI 1.81 to 3.59, 14 studies, 701 women, I2 = 58%, moderate‐quality evidence). We have presented ovulation rate per cycle in an additional table (Table 3). Subgroup analysis by obesity status suggested a significant difference between the subgroups (test for subgroup differences: Chi² = 4.11, df = 1, P = 0.04, I² = 75.7%), with a stronger benefit from metformin in the non‐obese group (OR 4.15, 95% CI 2.31 to 7.45). However heterogeneity in this subgroup was very high (I2 = 82%) and was attributable to a single study (Baillargeon 2004); when this study was excluded from analysis there was no longer any suggestion of a difference between the subgroups (I2 = 0%). When both subgroups were pooled, heterogeneity was improved after sensitivity analysis by study quality, which included only five studies (Fleming 2002; Hoeger 2004; Lord 2006; Ng 2001; PCOSMIC 2010), with an overall I2 of 0% . However, the overall inference remained unchanged.
1.5 Menstrual frequency
There was evidence of a beneficial effect of metformin on menstrual frequency with an OR of 1.72 (95% CI 1.14 to 2.61, 7 studies, 427 women, I2 = 54%). Due to only one trial in the non‐obese group, subgroup analysis did not improve the heterogeneity. In subgroup analysis by obesity status the test for subgroup differences showed no evidence of a difference between the subgroups. Sensitivity analysis, which excluded studies with unclear or high risk of bias, included five studies (Chou 2003; Eisenhardt 2006; Fleming 2002; Hoeger 2004; Tang 2006); this did not improve heterogeneity and did not change the inference.
1.6 Miscarriage
Four studies reported on miscarriage and there was no conclusive evidence of a difference between metformin and placebo in miscarriage rate per woman (OR 1.08, 95% CI 0.50 to 2.35, 4 studies, 748 women, I2 = 0%). A sensitivity analysis using per pregnancy rates was also inconclusive (OR 0.58, 95% CI 0.25 to 1.34, 4 studies, 200 pregnancies, I2 = 0%, low‐quality evidence). A subgroup analysis by obesity status showed no evidence of a difference between the subgroups. However, only one study was available with women with BMI more than 30 kg/m2 (PCOSMIC 2010).
1.7 Multiple pregnancy
Data were not available for this outcome.
1.8 Anthropometric outcomes
BMI
There was no clear evidence of an effect of metformin on BMI (MD ‐0.08, 95% CI ‐0.33 to 0.17, 16 studies, 827 women, I2 = 2%) (Analysis 1.8) with an average duration of treatment of 5.75 months and average dose of 1500 mg. Baillargeon 2004 provided 82% of the weight of this analysis, which found no significant evidence of a difference in BMI (MD 0.00, 95% CI ‐0.28 to 0.28). The other studies are smaller as reflected in their broader confidence intervals. Overall heterogeneity was low (I2 = 2%); but was moderately high in the non‐obese group (I2 = 54%). Sensitivity analysis by study quality (Baillargeon 2004; Chou 2003; Fleming 2002; Hoeger 2004; Lord 2006; Maciel 2004; Morin‐Papunen 2012; Ng 2001; Pasquali 2000; Tang 2006) improved heterogeneity (non‐obese group I2 = 0%; obese group I2 = 0%) but did not change the inference.
Waist to hip ratio
There was evidence of a marginal benefit from metformin on waist to hip ratio (MD ‐0.01, 95% CI ‐0.01 to 0.00, 11 studies, 702 women) (Analysis 1.9). The magnitude of heterogeneity was low in both the non‐obese and the obese subgroups (I2 = 0% and I2 = 12%, respectively). The sensitivity analysis by study quality (Baillargeon 2004; Chou 2003; Fleming 2002; Lord 2006; Morin‐Papunen 2012; Pasquali 2000; Tang 2006) demonstrated a similar inference.
Blood pressure
Metformin reduced systolic blood pressure with a mean difference of ‐3.59 mm Hg (95% CI ‐5.13 to ‐2.04, 7 studies, 379 women) (Analysis 1.10) and significant heterogeneity (I2 = 57%). However, we did not observe a similar benefit in the diastolic blood pressure (MD ‐0.14, 95% CI ‐1.35 to 1.07, 6 studies, 292 women, I2 = 21% (Analysis 1.11). Furthermore, neither subgroup analysis (Analysis 1.10) nor sensitivity analysis by study quality (Baillargeon 2004; Chou 2003; Lord 2006; Maciel 2004; Tang 2006) improved heterogeneity in the systolic blood pressure analysis.
1.9 Endocrine outcomes
Testosterone
There was evidence that metformin reduced serum total testosterone levels with a MD of ‐0.49 nmol/L (95% CI ‐0.59 to ‐0.39, 15 studies, 863 women, I2 = 92%) (Analysis 1.12). However, we observed high heterogeneity (I2 = 92%). In subgroup analysis by BMI, there was evidence of a difference between the subgroups (test for subgroup differences: Chi² = 15.68, df = 1, P = < 0.00001, I2 = 93.6%) with metformin having a stronger effect in the non‐obese group (MD ‐0.71 versus ‐0.29 nmol/L). Linear regression analysis did not demonstrate any correlation between the baseline mean BMI and the mean fasting insulin concentrations among all the included studies (data not shown). Furthermore, we did not observe a positive correlation between the baseline mean fasting insulin concentrations and the mean testosterone concentrations (data not shown). These data suggested that the heterogeneity may have been caused by the different background prevalence in hyperandrogenism and insulin resistance among different study populations (Wijeyaratne 2002; Wijeyaratne 2004). Furthermore, different biochemical assays used in different studies could contribute towards this heterogeneity. Sensitivity analysis by study quality did not improve the heterogeneity. However, removing the two extreme results (Baillargeon 2004; Jakubowicz 2001) improved heterogeneity (non‐obese group I2 = 49%; obese group I2 = 44%) without altering the inference.
Sex hormone‐binding globulin
There was no convincing evidence of an effect of metformin on serum sex hormone‐binding globulin levels (MD 0.49, 95% CI ‐1.82 to 2.81, 15 studies, 823 women, I2 = 62%) (Analysis 1.13). Neither the subgroup analysis nor the sensitivity analysis by study quality improved heterogeneity or changed the inference.
1.10 Metabolic outcomes
Glucose
There was evidence of a reduction in fasting glucose levels with metformin compared to placebo (MD ‐0.14 mmol/L, 95% CI ‐0.21 to ‐0.07, 15 studies, 849 women, I2 = 38%) (Analysis 1.14). Subgroup analysis only improved heterogeneity in the obese group (I2 = 14%) without changing the inference. Sensitivity analysis by study quality (Baillargeon 2004; Chou 2003; Fleming 2002; Hoeger 2004; Maciel 2004; Morin‐Papunen 2012; Pasquali 2000; Tang 2006) eliminated overall heterogeneity (I2 = 0%) and the results indicated no evidence of metformin on fasting glucose concentrations (MD 0 mmol/L, 95% CI ‐0.13 to 0.12).
Insulin
Metformin reduced fasting insulin levels with a MD of ‐4.13 mIU/L (95% CI ‐5.67 to ‐2.58, 14 studies, 573 women) (Analysis 1.15) but with significant heterogeneity (I2 = 63%). In subgroup analysis by BMI the test for subgroup differences showed no evidence of a difference between the subgroups. Sensitivity analysis by study quality (Chou 2003; Fleming 2002; Hoeger 2004; Lord 2006; Maciel 2004; Morin‐Papunen 2012; Ng 2001; Pasquali 2000; Tang 2006) did not improve the heterogeneity. Once again, the heterogeneity was likely to be caused by variations in background prevalences of hyperandrogenism and insulin resistance among different study populations.
Cholesterol
When we combined 11 studies, there was no conclusive evidence of a difference in serum cholesterol with the use of metformin (MD ‐0.14 mmol/L, 95% CI ‐0.31 to 0.02, 11 studies, 562 women, I2 = 62%, Analysis 1.16). However, in subgroup analysis by BMI,the test for subgroup differences showed no conclusive evidence of a difference between the subgroups (test for subgroup differences: Chi² = 2.02, df = 1, P = 0.15, I² = 50.6%).
Triglycerides
In general, the current review showed that there was no conclusive evidence of a difference in serum triglycerides with the use of metformin (MD 0.14 mmol/L, 95% CI ‐0.05 to 0.32, 7 studies, 309 women, I2 = 0%) (Analysis 1.17). Neither subgroup analysis nor sensitivity analysis by study quality changed the inference, however the number of participants was low, and the results show broad confidence intervals.
2. Metformin with clomiphene citrate versus clomiphene citrate alone
2.1 Live birth rate
There was no conclusive evidence of a difference in live births when metformin in combination with clomiphene citrate was compared with clomiphene citrate alone (OR 1.21, 95% CI 0.92 to 1.59, 9 studies, 1079 women, I2 = 20%, low‐quality evidence).
In subgroup analysis, the test for subgroup differences showed no evidence of a difference between the subgroups: obese group (OR 1.28, 95% CI 0.86 to 1.91, 4 studies, 548 women), non‐obese group (OR 1.14, 95% CI 0.78 to 1.67, 5 studies, 531 women).
Sensitivity analysis by evidence quality (Legro 2007; Moll 2006; Morin‐Papunen 2012; PCOSMIC 2010), with 816 women, also did not change the inference nor improve heterogeneity.
2.2 Adverse events
There was evidence of more frequent gastrointestinal side effects in the metformin group, including nausea and vomiting (OR 3.97, 95% CI 2.59 to 6.08, 3 studies, 591 women, I2 = 47%, moderate‐quality evidence) compared with the control group. All participants in this analysis were non‐obese. Sensitivity analysis by study quality did not change our findings.
2.3 Clinical pregnancy rate
When combined with clomiphene citrate, there was evidence that metformin had a beneficial effect on pregnancy rate compared to clomiphene citrate alone (OR 1.59, 95% CI 1.27 to 1.99, 16 studies, 1529 women, I2 = 33%, moderate‐quality evidence).
In subgroup analysis, the test for subgroup differences showed no evidence of a difference between the subgroups: the effect on pregnancy rates was seen in both analyses: obese group (OR 1.76, 95% CI 1.26 to 2.47, 7 studies, 695 women) and non‐obese group (OR 1.46, 95% CI 1.08 to 1.98, 9 studies, 834 women). Sensitivity analysis by study quality (Legro 2007; Moll 2006; Morin‐Papunen 2012), with 745 participants, did not change the inference or improve heterogeneity.
2.4 Ovulation rate
There was evidence of a beneficial effect for metformin combined with clomiphene citrate versus clomiphene citrate alone on ovulation per woman, (OR 1.57, 95% CI 1.28 to 1.92, 21 studies, 1624 women, I2 = 64%, moderate‐quality evidence). We have presented ovulation rate per cycle in an additional table (Table 4). In subgroup analysis, the test for subgroup differences showed no evidence of a difference between the subgroups. Heterogenity remained high (I2 = 70%) in the obese sub group, but the direction of effect was consistent. We conducted a subgroup analysis based on sensitivity to clomiphene citrate. Seven studies were available that had recorded clomiphene citrate‐resistance status. Six of these included women with clomiphene citrate resistance (Hwu 2005; Machado 2012; Malkawi 2002; Ng 2001; Sturrock 2002; Vandermolen 2001). This analysis showed an improvement in ovulation rate with combined therapy (OR 4.89, 95% CI 2.62 to 9.13, 6 studies, 215 women, I2 = 0%, moderate‐quality evidence). Only one small study of clomiphene citrate‐sensitive women was available, and a conclusion cannot be drawn from the result (OR 3.55, 95% CI 0.65 to 19.37, 56 women). Sensitivity analysis by study quality (Legro 2007; Moll 2006; Ng 2001; PCOSMIC 2010) did not alter our findings.
2.5 Menstrual frequency
Data were not available for this outcome.
2.6 Miscarriage rate
When we pooled the data from nine studies, we detected a difference in miscarriage rate per woman (OR 1.59, 95% CI 1.03 to 2.46, 9 studies, 1096 women I2 = 0%, low‐quality evidence). This suggests that the likelihood of miscarriage may be greater with combined therapy than when clomiphene citrate is used alone. When we analysed a subgroup by BMI, the test for subgroup differences showed no evidence of a difference between the subgroups. When we performed an analysis of miscarriage rate per pregnancy, there was no clear evidence of a difference between the groups (OR 1.30, 95% CI 0.80 to 2.12, 400 pregnancies, I2 = 0%), still with no evidence of a difference between the BMI subgroups. Sensitivity analysis by study quality (Legro 2007; Moll 2006; Morin‐Papunen 2012; PCOSMIC 2010) also did not alter the inference. Any increase in miscarriage conferred by using clomiphene citrate therapy in isolation is therefore difficult to interpret and apply clinically.
2.7 Multiple pregnancy rate
There was no conclusive evidence of a difference between metformin combined with clomiphene citrate versus clomiphene citrate alone (OR 0.56, 95% CI 0.18 to 1.68, 6 studies, 1003 women, I2=0%). Sensitivity analysis using per pregnancy rates did not produce different findings
(OR 0.46, 95% CI 0.15 to 1.42, 6 studies, 342 pregnancies, I2 = 0%). Sensitivity analysis by study quality (Legro 2007; Moll 2006; PCOSMIC 2010) did not alter the inference either.
Other outcomes
Data were not available for anthropometric, endocrine or metabolic outcomes.
3. Metformin versus clomiphene citrate
3.1 Live birth rate
When we combined the data from five studies (Kar 2015; Legro 2007; Palomba 2005; PCOSMIC 2010; Zain 2009), there was no conclusive evidence of a difference between the groups, with high heterogeneity (OR 0.71, 95% CI 0.49 to 1.01, 5 studies, 741 women, I2 = 86%, very low‐quality evidence) (Analysis 3.1). However, in the subgroup analysis by obesity status, there was evidence of a difference between the subgroups (test for subgroup differences: Chi² = 19.41, df = 1, P < 0.0001, I2 = 94.8%). Among obese women, live births were lower in the metformin group (OR 0.30, 95% CI 0.17 to 0.52, 2 studies, 500 women); 62% of the weight of this finding was provided by a single study (Legro 2007). In the non‐obese subgroup the direction of effect favoured metformin with high heterogeneity (OR 1.71, 95% CI 1.00 to 2.94, 3 studies, 241 women, I2 = 78%, very low‐quality evidence).
3.2 Adverse events
Data were not available for this outcome.
3.3 Clinical pregnancy rate
The overall heterogeneity was high (I2 = 86%) and the data were not appropriate to be pooled. However, subgroup analysis by obesity status showed evidence of a difference between the subgroups (test for subgroup differences: Chi² = 22.94, df = 1, P < 0.00001, I2 = 95.6%). In the non‐obese group, there was evidence of higher pregnancy rates in women who took metformin compared to those who took clomiphene citrate (OR 1.56, 95% CI 1.05 to 2.33, 5 studies, 490 women, I2 = 41%, very low‐quality evidence) whilst a different effect was observed in the obese group (OR 0.34, 95% CI 0.21 to 0.55, 2 studies, 500 women, I2 = 0%, very low‐quality evidence). Sensitivity analysis by study quality did not change the inference.
3.4 Ovulation rate
The overall heterogeneity was high (I2 = 74%) and the data were not appropriate to be pooled.
Subgroup analysis by obesity status again showed evidence of a difference between the subgroups (test for subgroup differences: Chi² = 11.23, df = 1, P = 0.0008, I² = 91.1%). In the obese group, combining the results from Legro 2007 and Zain 2009 found improved ovulation rates with clomiphene citrate therapy (OR 0.29, 95% CI 0.20 to 0.43, 2 studies, 500 women, 2044 cycles, I2 = 0%). In the non‐obese group, the data were inconclusive. Sensitivity analysis by study quality did not change the inference. We have presented ovulation rate per cycle in an additional table (Table 5).
3.5 Menstrual frequency
Data were not available for this outcome.
3.6 Miscarriage rate
The data regarding miscarriage rate with either clomiphene citrate or metformin treatment were inconclusive across both BMI groups (OR 0.92, 95% CI 0.50 to 1.67, 5 studies, 741 women, I2 = 52%).
Per‐pregnancy data were unsuitable for pooling in a subgroup analysis due to high heterogeneity (I2 = 78%) and differing directions of effect, so no conclusions could be drawn. Neither subgroup analysis by obesity status nor sensitivity analysis by study quality improved the heterogeneity in the per‐pregnancy analysis.
3.7 Multiple pregnancy rate
There was no conclusive evidence of a difference between the groups (0.29, 95% CI 0.06 to 1.43, 5 studies, 858 women, I2 = 0%). In the subgroup analysis by obesity status, there was no evidence of a difference between the subgroups. Sensitivity analysis by study quality did not change the inference.
Other outcomes
Data were not available for anthropometric, endocrine or metabolic outcomes.
4 D‐chiro‐inositol versus placebo or no treatment
Although two trials were included (Gerli 2003; Nestler 1999), the number of women in the analysis remained small. Furthermore, one of the trials (Gerli 2003) reported analysable data for only one outcome of interest (ovulation rate, moderate‐quality evidence). It would be difficult to make any conclusions based on the current findings.
4.1 Live birth
Data were not available for this outcome.
4.2 Adverse events
Data were not available for this outcome.
4.3 Clinical pregnancy
Data were not available for this outcome.
4.4 Ovulation rate
The data suggested that D‐chiro‐inositol may improve ovulation rates per woman (OR 3.57, 95% CI 1.72 to 7.45; 2 studies, 327 women, I2 = 81%), however there were only two studies and the results correspondingly show very wide confidence intervals. Neither a subgroup analysis nor sensitivity analysis were possible due to the inadequate number of studies. We have presented ovulation rate per cycle in an additional table (Table 6).
Other outcomes
Data were not available for other reproductive outcomes.
1.8 Anthropometric outcomes
(Analysis 4.2; Analysis 4.3; Analysis 4.4; Analysis 4.5)
Only one study, with 44 women (Nestler 1999) was included in the analysis. There was no conclusive evidence that D‐chiro‐inositol had an effect on BMI, waist to hip ratio or blood pressure.
1.9, 1.10 Endocrine and metabolic outcomes
(Analysis 4.6; Analysis 4.7; Analysis 4.8; Analysis 4.9; Analysis 4.10; Analysis 4.11)
Only one study (Nestler 1999) was included in the analysis. There was no conclusive evidence that D‐chiro‐inositol had an effect on these parameters (i.e. testosterone, sex hormone‐binding globulin, fasting glucose, fasting insulin, lipids (total cholesterol, triglycerides) except for serum sex hormone‐binding globulin levels.
5 Rosiglitazone versus placebo or no treatment
Three trials were included in the current review. Due to the withdrawal of troglitazone from the market, the drug used in the trials was either rosiglitazone or pioglitazone.
Data were not available for primary outcomes, but were available for some secondary outcomes, including ovulation rate, menstrual frequency and anthropometric, endocrine and metabolic outcomes.
5.4 Ovulation rate
Only the Baillargeon 2004 study of 64 women was available for this outcome (OR 1.91, 95% CI 0.70 to 5.22, 64 women, very low‐quality evidence), so no conclusions can be drawn. We have presented ovulation rate per cycle in an additional table (Table 7).
5.5 Menstrual frequency
Evidence of an improvement in menstrual pattern with rosiglitazone was observed in two studies (OR 5.59, 95% CI 2.20 to 14.19; 2 studies, 100 women, I2 = 12%).
5.8 Anthropometric outcomes
Women who took rosiglitazone were found to have an increased BMI (MD 0.68, 95% CI 0.40 to 0.96, 3 studies, 132 women, I2 = 15%) (Analysis 5.3 ).
Rosiglitazone was found to have a marginal benefit on waist to hip ratio (MD ‐0.01, 95% CI ‐0.02 to 0.00, 3 studies, 132 women, I2 = 0%, Analysis 5.4).
Based on one study (Baillargeon 2004), the effect on blood pressure was small (Analysis 5.5; Analysis 5.6).
5.9, 5.10 Endocrine and metabolic outcomes
The effects on testosterone, sex hormone‐binding globulin, insulin, glucose, cholesterol and triglyceride were found to be minimal (Analysis 5.7; Analysis 5.8; Analysis 5.9; Analysis 5.10; Analysis 5.11; Analysis 5.12).
6 Pioglitazone versus placebo or no treatment
Data were not available for primary outcomes, but were available for some secondary outcomes, including menstrual frequency and anthropometric, endocrine and metabolic outcomes. There was evidence that pioglitazone improved the menstrual pattern (OR 8.88, 95% CI 2.35 to 33.61, 2 studies, 70 women, I2 = 0%, moderate‐quality evidence) (Analysis 6.1). The studies differed in obesity status (only one study in each category), and both found an benefit in the intervention group.
There was no evidence of a difference between the groups for anthropometric outcomes (BMI (Analysis 6.2); waist to hip ratio (Analysis 6.3)), endocrine outcomes (testosterone (Analysis 6.4); sex hormone‐binding globulin (Analysis 6.5)) or metabolic outcomes (fasting insulin (Analysis 6.6)).
Publication bias
We planned to assess publication bias using a funnel plot but no analyses of primary outcomes had sufficient included studies.
Discussion
Summary of main results
Our findings suggest that metformin is associated with a beneficial effect on ovulation and clinical pregnancy rates, regardless of BMI, when compared with placebo. The addition of newer data to this review shows a potential benefit of metformin over placebo for live birth rate. However, more high‐quality studies that report live birth as a primary outcome are required. When comparing outcomes following the use of metformin or clomiphene citrate, higher ovulation rates suggest that clomiphene citrate is beneficial over metformin, alongside a reduced side‐effect profile. However, there was no evidence to suggest that either treatment would increase the likelihood of a live birth over the other. Further data stratified by the BMI of participants are required to determine the subgroups of women who may achieve improved outcomes with metformin or clomiphene citrate treatment.
Women who are known to be resistant to clomiphene citrate therapy may benefit from improved ovulation with the addition of metformin to clomiphene citrate. However, data were not available to determine if this would improve live birth rates in this group of women. Women taking metformin should be advised that there does not appear to be an increased miscarriage risk with treatment, but the likelihood of gastrointestinal side effects is higher than with placebo or clomiphene citrate. The use of metformin needs to be placed in the context of the principal first line therapies for ovulation induction for anovulatory women with PCOS, namely the use of clomiphene citrate and the aromatase inhibitor (letrozole) (Balen 2016).
Reproductive outcomes
When compared with placebo, the results suggest a possible benefit from using metformin treatment in improving live birth rates (Analysis 1.1). One high‐quality study included in this updated review contributed the majority of the weight to this finding (Morin‐Papunen 2012). However, the wide‐ranging confidence intervals and lower‐quality evidence when the Morin‐Papunen 2012 results were combined with other included studies, makes the advantage offered by metformin difficult to interpret clinically. However, clinical pregnancy rates were higher with the use of metformin for ovulation induction (Analysis 1.3). Menstrual frequency also appeared to be improved with metformin versus placebo (Analysis 1.5). This resulted in a benefit in ovulation rate, which persisted following a subgroup analysis by BMI (Analysis 1.4).
There was no conclusive evidence that adding metformin in combination with clomiphene citrate, increased live birth compared to clomiphene citrate monotherapy (Analysis 2.1). However, clinical pregnancy and ovulation rates were improved with combination treatment in both BMI groups (Analysis 2.3; Analysis 2.4). We attempted to analyse data depending on whether women were known to be sensitive or resistant to clomiphene citrate. Unfortunately, these data were only available for ovulation rate (Analysis 2.5). The test for subgroup differences showed no evidence of a difference between the subgroups.
When metformin was compared to clomiphene citrate, findings were complicated by a difference based on the obesity status of the participants. Here, women in the non‐obese group were more likely to achieve a live birth rate with metformin, whilst the obese women appeared to benefit from clomiphene citrate therapy. This pattern was also evident for clinical pregnancy and ovulation rate, although these analyses were hampered by a paucity of data (Analysis 3.2; Analysis 3.3).
Miscarriage was not commonly reported as an outcome in the studies included in this review. When analysing the available data, the use of metformin monotherapy did not appear to increase the rate of miscarriage (Analysis 1.6). The comparison between metformin and clomiphene citrate found no conclusive evidence of a difference in the likelihood of miscarriage between the two treatments (Analysis 3.4). There was evidence to suggest an increase in miscarriage when clomiphene citrate was combined with metformin rather than used in isolation , although this effect did not persist after subgroup analysis per pregnancy, by BMI or study quality (Analysis 2.6; Analysis 2.7). Any increase in miscarriage conferred by using combined clomiphene citrate therapy is therefore difficult to interpret and apply clinically.
For the outcome multiple pregnancy, there was no available data regarding metformin versus placebo. The results were inconclusive for combination therapy versus clomiphene citrate monotherapy, and for the comparison between metformin and clomiphene citrate (Analysis 2.8; Analysis 3.6).
Adverse effects
There was evidence that use of metformin was associated with higher rates of gastrointestinal disturbance than placebo, and that adding in metformin therapy increased rates of gastrointestinal side effects compared with clomiphene citrate alone (Analysis 1.2; Analysis 2.2). Data on adverse effects comparing metformin versus clomiphene citrate were not available.
Metabolic and anthropometric outcomes
Data on the effect of metformin on anthropometric outcomes were only available for the comparison between metformin and placebo. There was no conclusive evidence that metformin resulted in reduction in BMI, although there was an effect on waist to hip ratio (Analysis 1.8; Analysis 1.9). Similarly, there was an effect on systolic blood pressure, but the evidence was not conclusive for diastolic blood pressure (Analysis 1.10; Analysis 1.11) or cholesterol (Analysis 1.16).
With regards to endocrine outcomes, we observed a treatment effect on serum testosterone concentration, although this was seen only in the non‐obese women (Analysis 1.12). We also found an effect on reducing fasting insulin levels in both BMI groups (Analysis 1.15). There was no conclusive evidence of an effect of metformin on serum lipid profiles (Analysis 1.17).
It is therefore unclear whether these metabolic and endocrine effects would be of any clinical benefit to women with PCOS. The data on these outcomes also tended to be associated with high heterogeneity.
The role of metformin in reducing the risk of developing metabolic syndrome in women with PCOS remains unclear. Given the significant negative impact of obesity on pregnancy outcomes (Cedergren 2004; Legro 2007) and longer‐term cardiovascular health, anovulatory obese women with PCOS should still be advised to undergo lifestyle changes before any fertility treatment (ESHRE/ASRM 2008).
Limitations
See Quality of the evidence and Potential biases in the review process.
Overall completeness and applicability of evidence
This review includes a large number of women, all meeting the Rotterdam diagnostic criteria for PCOS (ESHRE/ASRM 2004). However, we still observed significant heterogeneity in many of the analyses. This was particularly evident in the biochemical outcomes, even after adjustment for BMI, dosage of metformin and duration of treatment. Heterogeneity remained unchanged after sensitivity analysis by study quality. However, the prevalence and magnitude of insulin resistance are influenced by ethnicity (Wijeyaratne 2002; Wijeyaratne 2004), therefore, combining trials from different study populations would introduce heterogeneity despite all meeting the diagnostic criteria of PCOS. Another factor is the range of biochemical assays used in different studies, which may introduce some heterogeneity
The efficacy of metformin in PCOS was first described by Velazquez 1997. A number of small, and often short‐duration, observational studies followed, which showed variable outcomes. Indeed, in a systematic review by Costello 2003 nine out of the 12 published studies on the effects of metformin alone on the menstrual cycle in women with PCOS had a sample size of fewer than 30 women. The first Cochrane Review by Lord 2003 included nearly 1000 women from 15 RCTs. However, most of the studies had relatively small sample sizes with the largest one containing 94 women (Fleming 2002). In this third updated review, we included 48 RCTs (4451 women) with the two largest studies of high quality being by Morin‐Papunen 2012 and Legro 2007, with sample sizes of 320 and 626 women, respectively.
Reproductive outcomes
The primary outcome of this updated review is the effect of metformin for ovulation induction on live birth rate. When compared to placebo, there was a potential benefit in live birth when using metformin, with a number needed to treat for an additional beneficial outcome of 13. This is supported by the corresponding increase in clinical pregnancy rate, ovulation rate and menstrual frequency with treatment. These results were seen in both obese and non‐obese BMI groupings. As such, BMI does not appear to be a discriminatory factor in predicting ovulation success with metformin treatment compared with placebo, although the moderate degree of heterogeneity observed in the data should be noted. The heterogeneity between the non‐obese and the obese groups could be explained by the limited effect of metformin on reducing serum insulin concentrations in the obese group compared with the non‐obese group of women with PCOS (Analysis 1.4). Furthermore, obese women with PCOS have a higher insulin resistance (higher serum insulin concentrations) than non‐obese women with PCOS (Tang 2006).
The suggestion of an improvement in live births with metformin differs from the previous review, due to the inclusion of the new, high‐quality study, Morin‐Papunen 2012. However, there are still only four studies reporting live birth available for analysis, and the overall quality of the evidence is low. Given the wide‐ranging confidence intervals and evidence quality, the advantage offered by metformin remains difficult to interpret clinically. Therefore more high‐quality studies are required investigating the use of metformin, with live birth rate as the primary outcome.
Clomiphene citrate is traditionally employed as the first line ovulation induction therapy for anovulatory women with PCOS. However, there was a paucity of data comparing the efficacy and safety of metformin against clomiphene citrate therapy. When we combined the five available studies, we regarded the data as very low quality and with high heterogeneity. The results here differed by BMI, whereby clomiphene citrate appeared to increase live births in the obese group, with a large weighting attributed to the study by Legro 2007. In the non‐obese group however, metformin was superior, although this analysis included only small studies of low quality. As such, more high‐quality studies with a larger number of participants are required to assess metformin versus clomiphene citrate for live birth rate.
The beneficial effect of combination treatment with metformin and clomiphene citrate versus clomiphene citrate alone on live birth rate was not supported by the current evidence. Combination therapy appeared to improve clinical pregnancy rate and ovulation per woman. In our subgroup analysis, women who previously developed clomiphene citrate resistance had a larger effect with combined therapy than women who were clomiphene citrate sensitive or of undefined status. In addition, heterogeneity was low in the analysis of ovulation rates in the clomiphene citrate resistant group (I2 = 0%). Therefore, clomiphene citrate resistance can be a useful discriminatory factor to predict the response to the combined therapy. Future studies of the effect of metformin and clomiphene citrate on live birth rate should therefore be presenting the clomiphene citrate sensitivity of participants. In a subgroup analysis by BMI, the level of heterogeneity was very high in both groups. In addition, the number of women needed to treat to achieve ovulation in both the non‐obese and obese groups was high, 7.7 and 10 respectively. This compares to a number of women needed to treat of 3 in women with known clomiphene citrate resistance. Given that, in clinical practice, women would often receive only six cycles of clomiphene citrate treatment, the benefit afforded by metformin co‐therapy may be limited.
A large proportion of the women included in this review fall into the high‐BMI grouping. Given that the aim is for a pregnancy in these women, and that metformin does not have a conclusive effect on BMI, it is worth considering the impact of obesity on their reproductive outcomes. Cedergren 2004 conducted a prospective population‐based study on over 3000 morbidly obese mothers (BMI > 40 kg/m2) and demonstrated higher incidences of adverse pregnancy outcomes compared with a group of normal weight, including pre‐eclampsia, stillbirth, large‐for‐gestational‐age babies, fetal distress and early neonatal death. This emphasises the importance of weight loss in any obese women aiming for a pregnancy, alongside any additional treatment for ovulation induction. Lifestyle modification should therefore form an integral part of managing obese PCOS women suffering from anovulatory infertility (Tang 2006).
In this review, there was no convincing evidence of an effect on miscarriage or multiple pregnancy rates attributable to metformin. However, women should be counselled on the increased side‐effect profile with metformin, which may hamper clinical compliance, and the longer duration of treatment required with metformin.
Metabolic and anthropometric outcomes
There is yet to be any long‐term data on the use of metformin for women with PCOS in reducing the risk of developing diabetes or metabolic syndrome. Our analyses found no evidence of an effect of metformin on reducing BMI or improving lipid profiles. There was however, a reduction in cholesterol compared to placebo and reduced waist to hip ratio in the non‐obese group. There was also reduction in fasting glucose and fasting insulin levels when compared to placebo. However, the clinical relevance of these differences for the long‐term prevention of diabetes remains unclear. We saw an effect on systolic blood pressure but the magnitude of effect (MD ‐3.59 mm Hg) is unlikely to be clinically significant.
Metformin had a beneficial effect on serum testosterone, with a greater mean difference in the non‐obese group. However, meta‐regression did not support any effect of the daily dose or the duration of metformin treatment on the magnitude of the reduction in testosterone levels. High insulin levels stimulate an increase in androgen production from the ovaries and therefore an inadequate reduction of insulin concentrations induced by metformin in obese women with PCOS may be a reason why the reduction of testosterone was less marked in the obese group. The effect of metformin on serum testosterone could therefore benefit women with hirsutism. However, a Cochrane Review (Costello 2007) indicated that limited data were available comparing the effects of metformin with combined oral contraceptives for hirsutism. Given the increased efficacy of combined oral contraceptives at reducing serum testosterone (MD 0.54, 95% CI 0.22 to 0.86) and the free androgen index (MD 3.69, 95% CI 2.56 to 4.83) in their review, metformin is unlikely to become a first‐line therapy for hirsutism.
In respect to the use of rosiglitazone and pioglitazone in women with PCOS, our analysis, with a limited number of trials, showed that these drugs improve ovulation rate without evidence of an effect on biochemical parameters. Given that these drugs are classified as category C (FDA 2002) and hence most recruited women were not planning a pregnancy, it would be difficult to assess pregnancy outcomes. Furthermore, a high incidence of weight gain (Analysis 5.3) among the users further hampers their use in obese women with PCOS (Baillargeon 2004). There is also concern about links between rosiglitazone and increased risk of myocardial infarction (Lago 2007).
Quality of the evidence
Overall, we graded only 18 out of the 48 included studies as having low risk of bias related to sequence generation, allocation concealment and blinding. The main limitation of the comparisons in this review is therefore the risk of bias and imprecision within the included studies, as discussed in summary of findings Table for the main comparison; summary of findings Table 2; summary of findings Table 3 and Figure 3 and Figure 4. However, sensitivity analysis on the studies with adequate sequence generation, allocation concealment and blinding method did not alter the clinical findings, except on fasting serum glucose concentrations. We classified the overall quality of evidence for metformin versus placebo as low for live birth rate and ovulation rate, and moderate for clinical pregnancy and miscarriage rate (summary of findings Table for the main comparison). This was due to a moderate risk of bias, marginal effect size and statistical imprecision. The evidence for D‐chiro‐inositol, rosiglitazone and pioglitazone was of moderate quality. The overall quality of evidence for metformin versus clomiphene citrate and for metformin plus clomiphene citrate versus clomiphene citrate alone was moderate.
Potential biases in the review process
We conducted a thorough search, used sound methodology and are not aware of any biases in the review process.
Agreements and disagreements with other studies or reviews
Reproductive outcomes
A 2015 systematic review investigating the efficacy of metformin in women with anovulatory infertility for the improvement of reproductive outcomes (Abu Hashim 2016). For metformin versus placebo, only a previous version of this Cochrane Review was identified. The authors reviewed two meta‐analyses comparing metformin with clomiphene citrate for ovulation induction (Palomba 2009 and Siebert 2012). In accordance with our findings, they found improved ovulation rates with clomiphene citrate rather than metformin. There was no conclusive benefit of either treatment on clinical pregnancy or live birth rate, with wide confidence intervals noted. They therefore conclude that clomiphene citrate remains the "gold standard first‐line pharmacological treatment for ovulation induction in anovulatory infertile women with PCOS". An analysis of four studies that compared metformin with clomiphene citrate in non‐obese women found no significant difference in reproductive outcomes (Misso 2013). The conclusions drawn by Abu Hashim 2016 echo the ESHRE consensus, which documented that the first line treatment for anovulatory infertility is clomiphene citrate, whilst obese women should be advised to undergo lifestyle modifications (ESHRE/ASRM 2008).
When evaluating the Palomba 2009 and Siebert 2012 meta‐analyses, Abu Hashim 2016 found no evidence of an improvement in live birth when metformin was used in combination with clomiphene citrate. Our review also found no conclusive evidence of a difference in live birth rate, although clinical pregnancy and ovulation were improved with co‐therapy. Given the increased side‐effect profile with metformin, as found in our review, Abu Hashim 2016 do not recommend adding in metformin to clomiphene citrate therapy. However, their results are not stratified by BMI.
Metabolic and anthropometric outcomes
Our review found mixed evidence of an effect of metformin on metabolic outcomes, which is of unclear clinical significance for the prevention of diabetes in the long term. These findings are supported by Diabetes Prevention Program Research group study of over 3000 obese women (mean BMI 34 kg/m2) with an average follow‐up period of 2.8 years (Knowler 2002). They reported that both metformin and lifestyle‐intervention groups (7.8 and 4.8 cases per 100 person years respectively) had a lower incidence of diabetes compared with placebo (11 per 100 person years). However, the lifestyle‐intervention group achieved a significantly better weight reduction compared with the metformin (58% versus 31%). Furthermore, the initial modest weight loss in the metformin group was not sustainable after three years of follow‐up. In contrast, in the lifestyle group an average of 4% weight loss was still maintained after four years. Likewise, the Finnish Diabetes Prevention Study demonstrated that weight loss improved insulin sensitivity, waist circumference and serum triglyceride levels compared with controls in 150 obese women with impaired glucose tolerance (Uusitupa 2000). A 2007 meta‐analysis also concluded that the lifestyle interventions are more effective than metformin in obese women (Gillies 2007).

Study flow diagram since publication
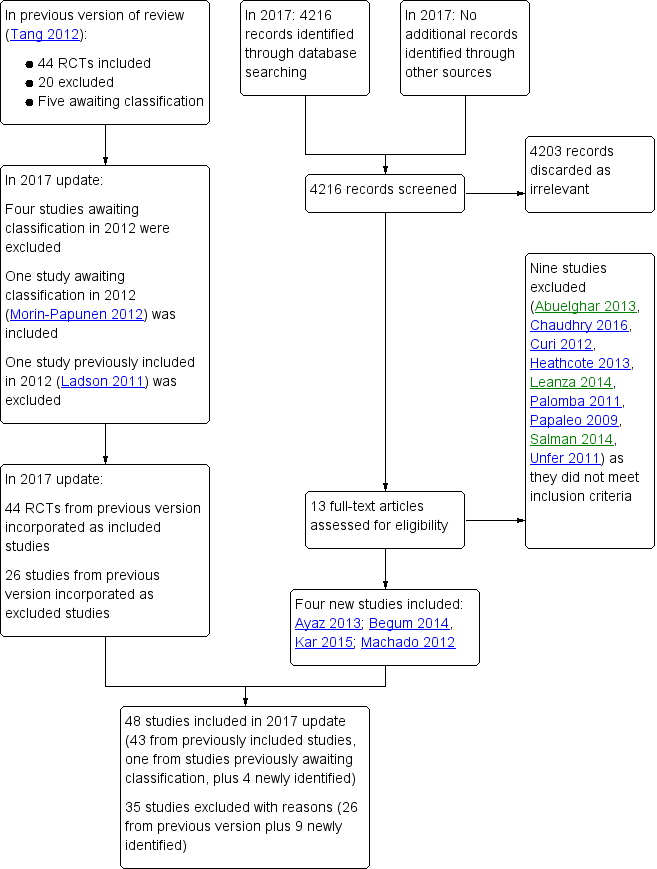
Study flow diagram 2017 update
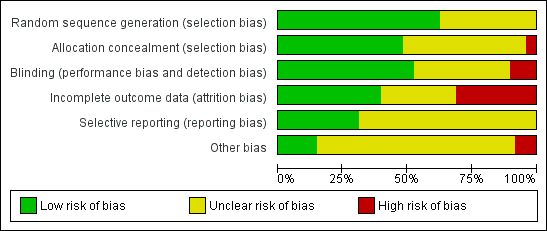
Risk of bias graph: review authors' judgements about each risk of bias item presented as percentages across all included studies

Risk of bias summary: review authors' judgements about each risk of bias item for each included study

Forest plot of comparison: 1 Metformin versus placebo or no treatment, outcome: 1.1 Live birth rate

Forest plot of comparison: 2 Metformin combined with clomiphene citrate versus clomiphene citrate alone, outcome: 2.1 Live birth rate

Forest plot of comparison: 3 Metformin versus clomiphene citrate, outcome: 3.1 Live birth.

Comparison 1 Metformin versus placebo or no treatment, Outcome 1 Live birth rate.

Comparison 1 Metformin versus placebo or no treatment, Outcome 2 Adverse events (gastrointestinal side effects).
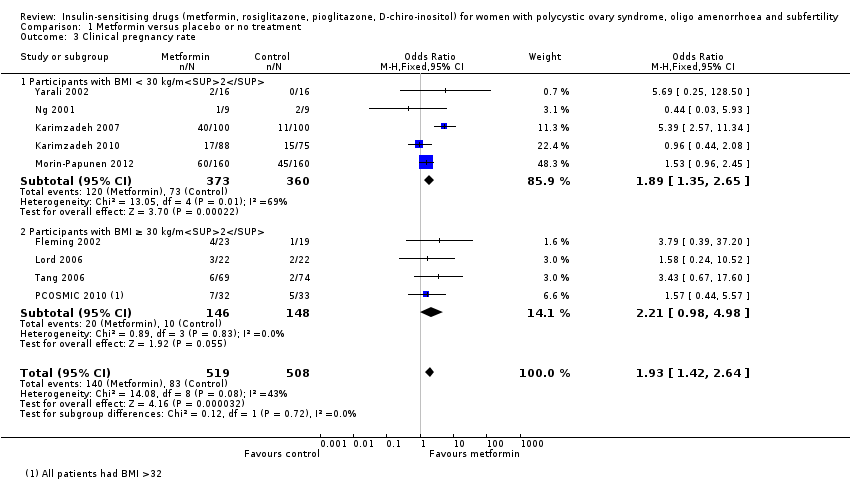
Comparison 1 Metformin versus placebo or no treatment, Outcome 3 Clinical pregnancy rate.
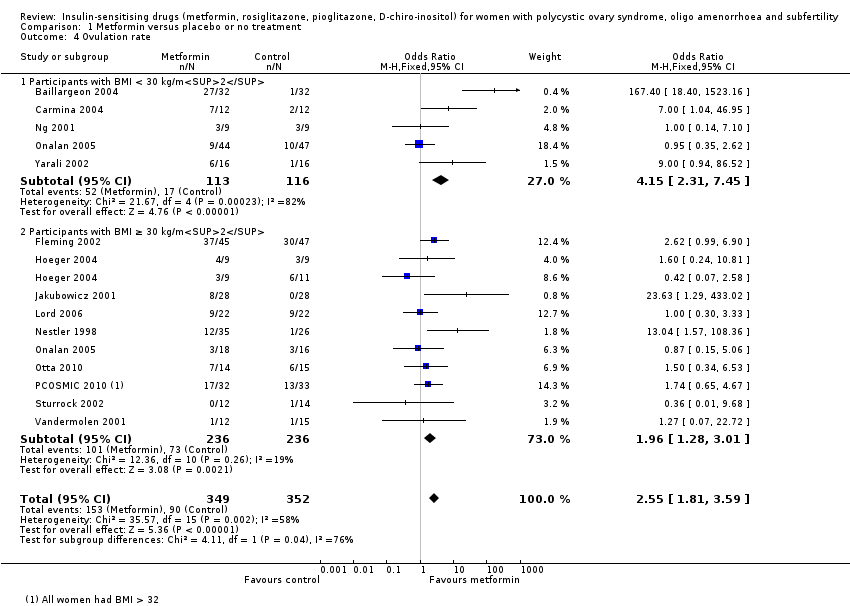
Comparison 1 Metformin versus placebo or no treatment, Outcome 4 Ovulation rate.
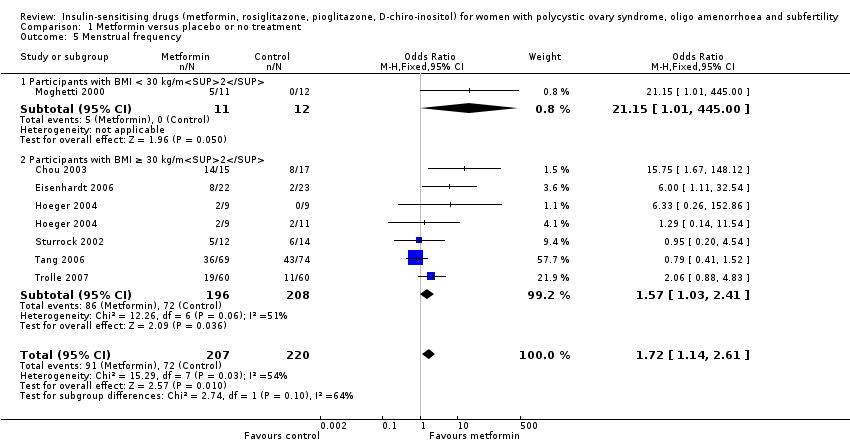
Comparison 1 Metformin versus placebo or no treatment, Outcome 5 Menstrual frequency.

Comparison 1 Metformin versus placebo or no treatment, Outcome 6 Miscarriage rate per woman.

Comparison 1 Metformin versus placebo or no treatment, Outcome 7 Sensitivity analysis: miscarriage rate per pregnancy.

Comparison 1 Metformin versus placebo or no treatment, Outcome 8 Body mass index (kg/m2).

Comparison 1 Metformin versus placebo or no treatment, Outcome 9 Waist‐hip ratio.
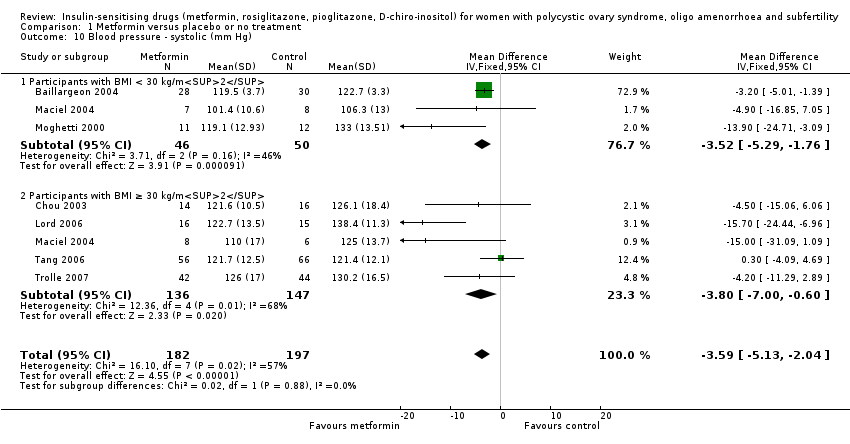
Comparison 1 Metformin versus placebo or no treatment, Outcome 10 Blood pressure ‐ systolic (mm Hg).
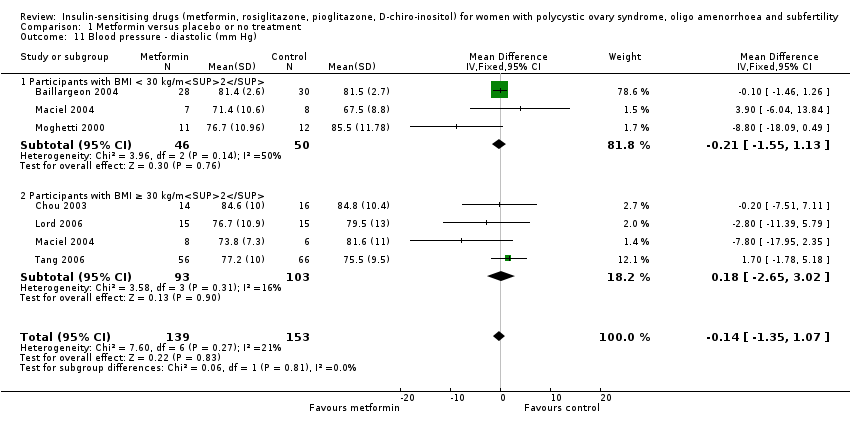
Comparison 1 Metformin versus placebo or no treatment, Outcome 11 Blood pressure ‐ diastolic (mm Hg).

Comparison 1 Metformin versus placebo or no treatment, Outcome 12 Serum testosterone (nmol/L).

Comparison 1 Metformin versus placebo or no treatment, Outcome 13 Serum sex hormone‐binding globulin (nmol/L).

Comparison 1 Metformin versus placebo or no treatment, Outcome 14 Fasting glucose (mmol/L).
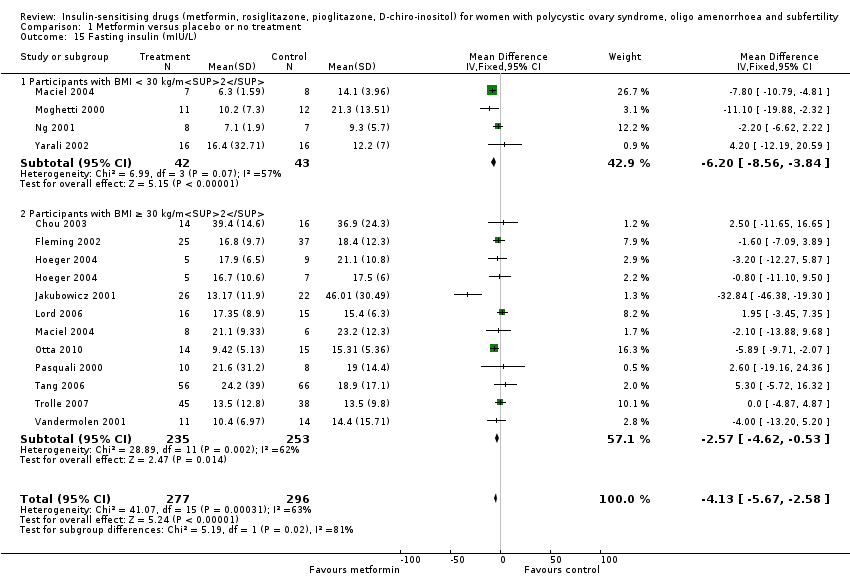
Comparison 1 Metformin versus placebo or no treatment, Outcome 15 Fasting insulin (mIU/L).

Comparison 1 Metformin versus placebo or no treatment, Outcome 16 Total cholesterol (mmol/L).
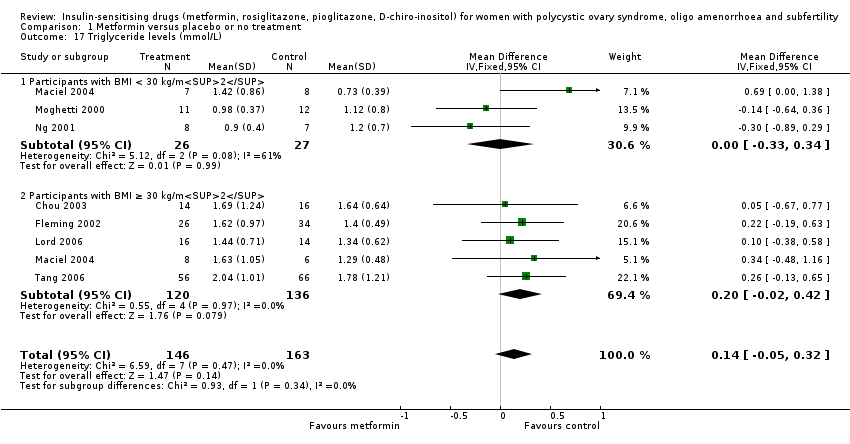
Comparison 1 Metformin versus placebo or no treatment, Outcome 17 Triglyceride levels (mmol/L).

Comparison 2 Metformin combined with clomiphene citrate versus clomiphene citrate alone, Outcome 1 Live birth rate.

Comparison 2 Metformin combined with clomiphene citrate versus clomiphene citrate alone, Outcome 2 Adverse events.

Comparison 2 Metformin combined with clomiphene citrate versus clomiphene citrate alone, Outcome 3 Clinical pregnancy rate.

Comparison 2 Metformin combined with clomiphene citrate versus clomiphene citrate alone, Outcome 4 Ovulation rate.

Comparison 2 Metformin combined with clomiphene citrate versus clomiphene citrate alone, Outcome 5 Ovulation rate: subgroup analysis by sensitivity to clomiphene citrate.

Comparison 2 Metformin combined with clomiphene citrate versus clomiphene citrate alone, Outcome 6 Miscarriage rate per woman.

Comparison 2 Metformin combined with clomiphene citrate versus clomiphene citrate alone, Outcome 7 Sensitivity analysis: miscarriage rate per pregnancy.
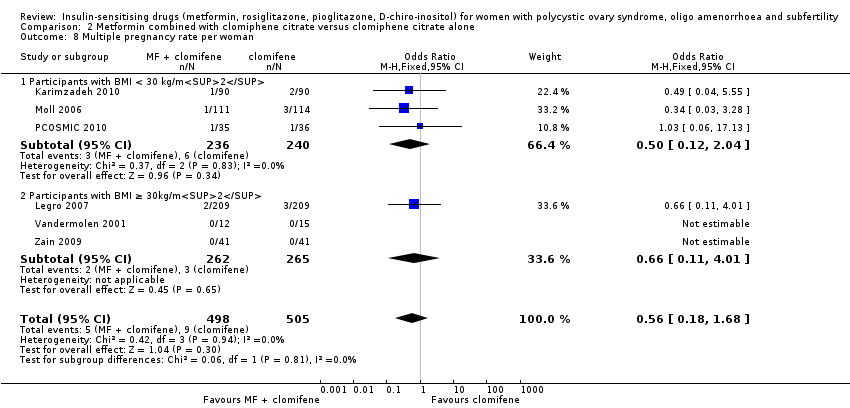
Comparison 2 Metformin combined with clomiphene citrate versus clomiphene citrate alone, Outcome 8 Multiple pregnancy rate per woman.
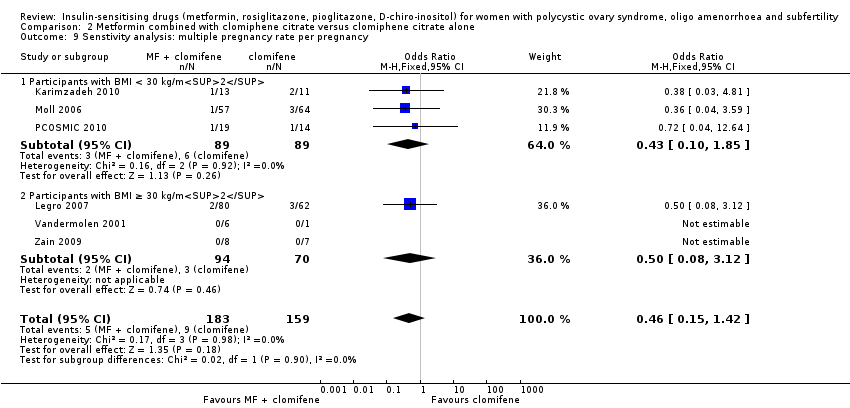
Comparison 2 Metformin combined with clomiphene citrate versus clomiphene citrate alone, Outcome 9 Senstivity analysis: multiple pregnancy rate per pregnancy.
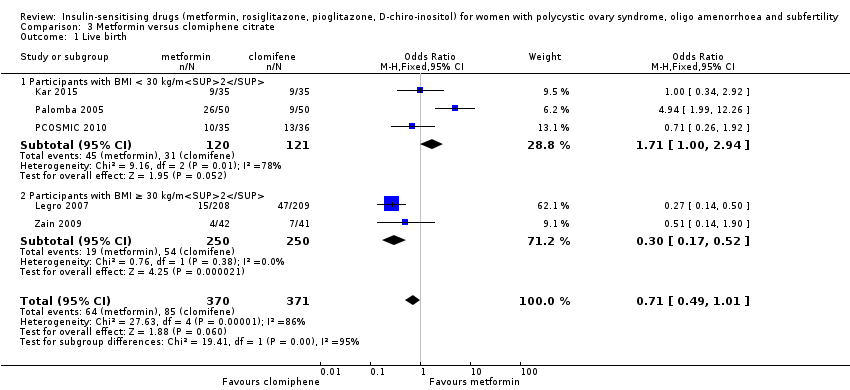
Comparison 3 Metformin versus clomiphene citrate, Outcome 1 Live birth.

Comparison 3 Metformin versus clomiphene citrate, Outcome 2 Clinical pregnancy rate.

Comparison 3 Metformin versus clomiphene citrate, Outcome 3 Ovulation rate.

Comparison 3 Metformin versus clomiphene citrate, Outcome 4 Miscarriage rate per woman.
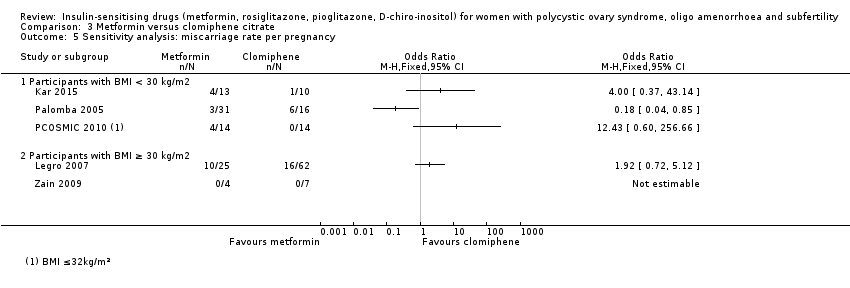
Comparison 3 Metformin versus clomiphene citrate, Outcome 5 Sensitivity analysis: miscarriage rate per pregnancy.

Comparison 3 Metformin versus clomiphene citrate, Outcome 6 Multiple pregnancy rate per woman.
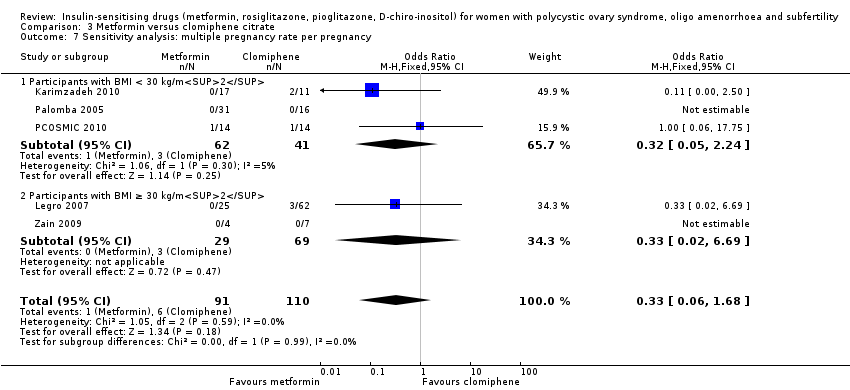
Comparison 3 Metformin versus clomiphene citrate, Outcome 7 Sensitivity analysis: multiple pregnancy rate per pregnancy.
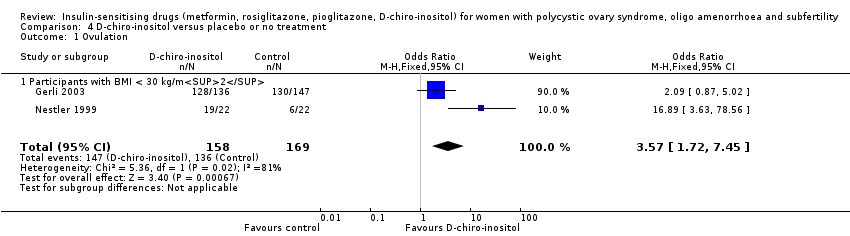
Comparison 4 D‐chiro‐inositol versus placebo or no treatment, Outcome 1 Ovulation.

Comparison 4 D‐chiro‐inositol versus placebo or no treatment, Outcome 2 Body mass index (kg/m2).

Comparison 4 D‐chiro‐inositol versus placebo or no treatment, Outcome 3 Waist‐hip ratio.

Comparison 4 D‐chiro‐inositol versus placebo or no treatment, Outcome 4 Blood pressure ‐ systolic (mm Hg).
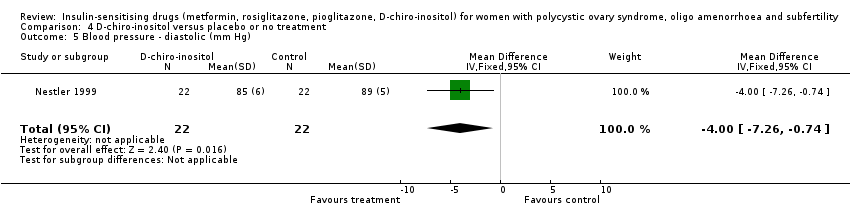
Comparison 4 D‐chiro‐inositol versus placebo or no treatment, Outcome 5 Blood pressure ‐ diastolic (mm Hg).

Comparison 4 D‐chiro‐inositol versus placebo or no treatment, Outcome 6 Serum testosterone (nmol/L).
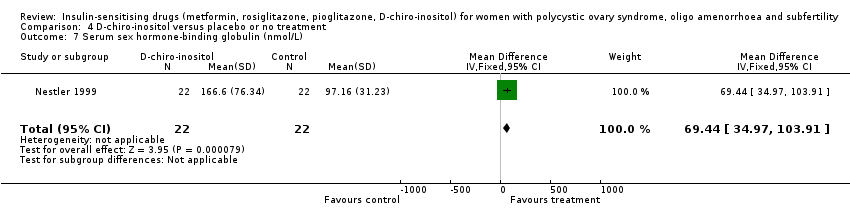
Comparison 4 D‐chiro‐inositol versus placebo or no treatment, Outcome 7 Serum sex hormone‐binding globulin (nmol/L).

Comparison 4 D‐chiro‐inositol versus placebo or no treatment, Outcome 8 Fasting glucose (mmol/L).

Comparison 4 D‐chiro‐inositol versus placebo or no treatment, Outcome 9 Fasting insulin (mIU/L).
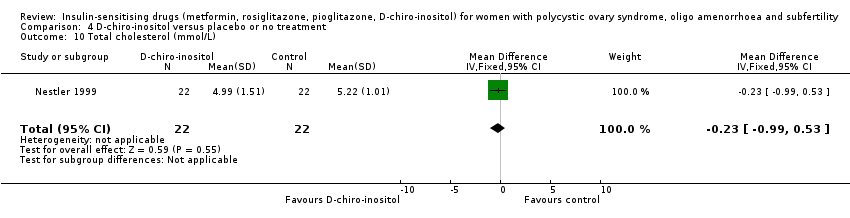
Comparison 4 D‐chiro‐inositol versus placebo or no treatment, Outcome 10 Total cholesterol (mmol/L).

Comparison 4 D‐chiro‐inositol versus placebo or no treatment, Outcome 11 Triglyceride levels (mmol/L).

Comparison 5 Rosiglitazone versus placebo or no treatment, Outcome 1 Ovulation rate.

Comparison 5 Rosiglitazone versus placebo or no treatment, Outcome 2 Menstrual frequency.

Comparison 5 Rosiglitazone versus placebo or no treatment, Outcome 3 Body mass index (kg/m2).
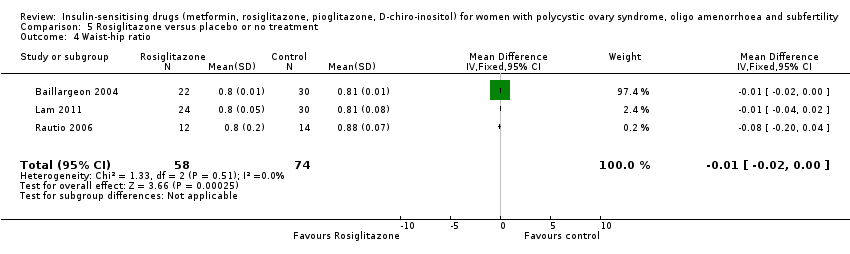
Comparison 5 Rosiglitazone versus placebo or no treatment, Outcome 4 Waist‐hip ratio.

Comparison 5 Rosiglitazone versus placebo or no treatment, Outcome 5 Blood pressure ‐ systolic (mm Hg).

Comparison 5 Rosiglitazone versus placebo or no treatment, Outcome 6 Blood pressure ‐ diastolic (mm Hg).
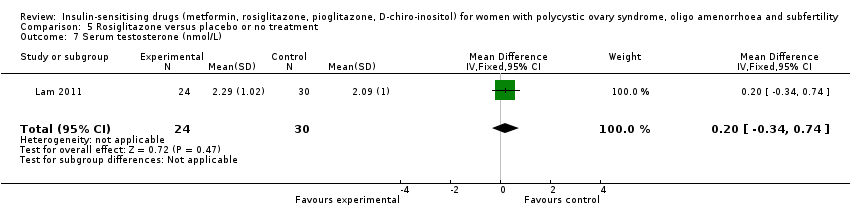
Comparison 5 Rosiglitazone versus placebo or no treatment, Outcome 7 Serum testosterone (nmol/L).
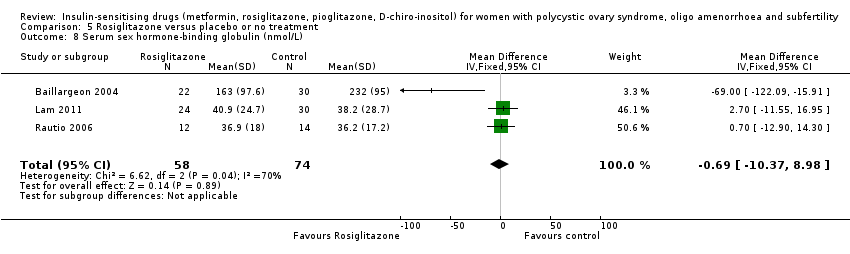
Comparison 5 Rosiglitazone versus placebo or no treatment, Outcome 8 Serum sex hormone‐binding globulin (nmol/L).

Comparison 5 Rosiglitazone versus placebo or no treatment, Outcome 9 Fasting glucose (mmol/L).

Comparison 5 Rosiglitazone versus placebo or no treatment, Outcome 10 Fasting insulin (mIU/L).

Comparison 5 Rosiglitazone versus placebo or no treatment, Outcome 11 Total cholesterol (mmol/L).

Comparison 5 Rosiglitazone versus placebo or no treatment, Outcome 12 Triglyceride levels (mmol/L).
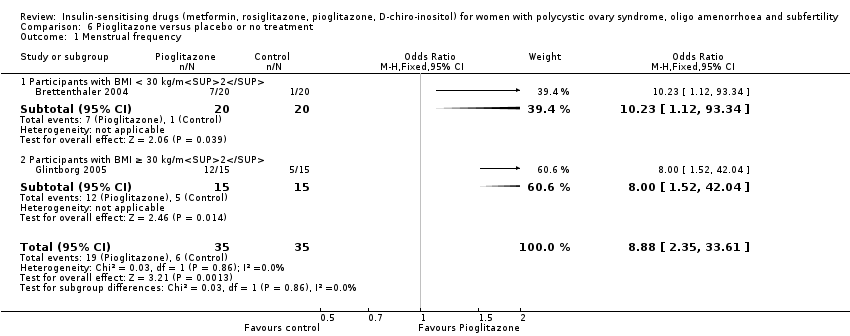
Comparison 6 Pioglitazone versus placebo or no treatment, Outcome 1 Menstrual frequency.

Comparison 6 Pioglitazone versus placebo or no treatment, Outcome 2 Body mass index (kg/m2).
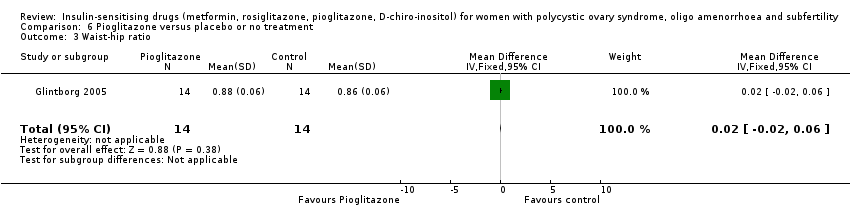
Comparison 6 Pioglitazone versus placebo or no treatment, Outcome 3 Waist‐hip ratio.

Comparison 6 Pioglitazone versus placebo or no treatment, Outcome 4 Serum testosterone (nmol/L).

Comparison 6 Pioglitazone versus placebo or no treatment, Outcome 5 Serum sex hormone‐binding globulin (nmol/L).

Comparison 6 Pioglitazone versus placebo or no treatment, Outcome 6 Fasting insulin (mIU/L).
| Metformin compared to placebo or no treatment for women with polycystic ovary syndrome, oligo amenorrhoea and subfertility | ||||||
| Patient or population: women with polycystic ovary syndrome, oligo amenorrhoea and subfertility | ||||||
| Outcomes | Illustrative comparative risks* (95% CI) | Relative effect | No of participants | Quality of the evidence | Comments | |
| Assumed risk | Corresponding risk | |||||
| Placebo or no treatment | Metformin | |||||
| Live birth rate per woman | 141 per 1000 | 208 per 1000 | OR 1.59 | 435 | ⊕⊕⊝⊝ | |
| Adverse events (gastrointestinal) per woman | 106 per 1000 | 362 per 1000 (267 to 469) | OR 4.76 (3.06 to 7.41) | 670 (7 studies) | ⊕⊕⊕⊝ | |
| Clinical pregnancy rate per woman | 110 per 1000 | 193 per 1000 | OR 1.93 | 1027 | ⊕⊕⊕⊝ | |
| Menstrual frequency per woman | 183 per 1000 | 278 per 1000 (203 to 368) | OR 1.72 (1.14 to 2.61) | 427 (7 studies) | ⊕⊕⊝⊝ | |
| Ovulation rate per woman | 200 per 1000 | 389 per 1000 | OR (1.81 to 3.59) | 701 | ⊕⊕⊕⊝ | |
| Miscarriage rate per woman | 40 per 1000 | 43per 1000 | OR 1.08 | 748 | ⊕⊕⊝⊝ | Miscarriage rate per pregnancy OR 0.58, 95% CI 0.25 to 1.34, 200 pregnancies |
| *The basis for the assumed risk is the median control group risk across studies. The corresponding risk (and its 95% confidence interval) is based on the assumed risk in the comparison group and the relative effect of the intervention (and its 95% CI). | ||||||
| GRADE Working Group grades of evidence High quality: we are very confident that the true effect lies close to that of the estimate of the effect Moderate quality: we are moderately confident in the effect estimate; the true effect is likely to be close to the estimate of effect, but there is a possibility that it is substantially different Low quality: our confidence in the effect estimate is limited; the true effect may be substantially different from the estimate of the effect Very low quality: we have very little confidence in the effect estimate; the true effect is likely to be substantially different from the estimate of effect | ||||||
| aDowngraded one level for serious risk of bias related to failure to report methods of randomisation and/or serious risk of attrition bias in some of the studies. | ||||||
| Metformin combined with clomiphene versus clomiphene alone for women with polycystic ovary syndrome | ||||||
| Population: women with polycystic ovary syndrome | ||||||
| Outcomes | Anticipated absolute effects* (95% CI) | Relative effect | № of participants | Quality of the evidence | Comments | |
| Risk with clomiphene alone | Risk with metformin combined with clomiphene | |||||
| Live birth rate per woman | 257 per 1000 | 295 per 1000 | OR 1.21 | 1079 | ⊕⊕⊝⊝ | |
| Adverse events (gastrointestinal) per woman | 134 per 1000 | 381 per 1000 | OR 3.97 | 591 | ⊕⊕⊕⊝ | |
| Clinical pregnancy rate per woman | 243 per 1000 | 338per 1000 | OR 1.59 | 1529 | ⊕⊕⊕⊝ | |
| Menstrual frequency per woman | Not reported by any of the included studies | |||||
| Ovulation rate per woman | 381per 1000 | 491 per 1000 | OR 1.57 (1.28 to 1.92) | 1624 | ⊕⊕⊕⊝ | |
| Miscarriage rate per woman | Median rates not calculable as there were no events in the control group in 5/8 studies | OR 1.59 | 1096 | ⊕⊕⊝⊝ | Miscarriage rate per pregnancy OR 1.30 95% CI 0.80 to 2.12, 400 pregnancies | |
| *The risk in the intervention group (and its 95% confidence interval) is based on the median risk in the comparison group and the relative effect of the intervention (and its 95% CI). | ||||||
| GRADE Working Group grades of evidence | ||||||
| aDowngraded one level for serious risk of bias related to failure to describe study methods and/or serious risk of attrition bias in several of the studies. | ||||||
| Metformin compared to clomiphene citrate for women with polycystic ovary syndrome | ||||||
| Population: women with polycystic ovary syndrome | ||||||
| Outcomes | Anticipated absolute effects* (95% CI) | Relative effect | № of participants | Quality of the evidence | Comments | |
| Risk with clomiphene citrate | Risk with metformin | |||||
| Live birth rate per woman Participants with BMI < 30 kg/m2 or ≤ 32 kg/m2a | 225 per 1000 | 171 per 1000 (124 to 227) | OR 1.71 (1.00 to 2.94) | 241 (3 studies) | ⊕⊝⊝⊝ very lowc,d | High heterogeneity (I2 = 78%) |
| Live birth rate per woman Participants with BMI ≥ 30 kg/m2a | 198 per 1000 | 69 per 1000 (40 to 114) | OR 0.30 (0.17 to 0.52) | 500 (2 studies) | ⊕⊝⊝⊝ | 74 events |
| Adverse events (gastrointestinal) | Not reported by any of the included studies | |||||
| Clinical pregnancy rate per woman Participants with BMI < 30 kg/m2 or ≤ 32 kg/m2a | 320 per 1000 | 423 per 1000 | OR 1.56 | 490 | ⊕⊝⊝⊝ | 103 events |
| Clinical pregnancy rate per woman Participants with BMI ≥ 30 kg/m2a | 234 per 1000 | 94 per 1000 | OR 0.34 | 500 | ⊕⊝⊝⊝ | 98 events |
| Menstrual frequency | Not reported by any of the included studies | |||||
| Ovulation rate per woman Participants with BMI < 30 kg/m2b | 625 per 1000 | 574 per 1000 | OR 0.81 | 312 | ⊕⊕⊝⊝ | |
| Ovulation rate per woman Participants with BMI ≥ 30 kg/m2b | 534per 1000 | 250per 1,000 | OR 0.29 | 500 | ⊕⊕⊝⊝ | |
| Miscarriage rate per woman | 29 per 1000 | 26 per 1000 (15 to 47) | OR 0.92 (0.50 to 1.67) | 741 | ⊕⊝⊝⊝ very lowc,e | High heterogeneity (I2 = 52%) |
| *The risk in the intervention group (and its 95% confidence interval) is based on the median risk in the comparison group and the relative effect of the intervention (and its 95% CI). | ||||||
| GRADE Working Group grades of evidence | ||||||
| aData subgrouped by BMI, as pooling of BMI groups resulted in high heterogeneity (I2 > 85%) with differing directions of effect. | ||||||
| Abbreviation | Definition |
| BMI | Body mass index |
| CC | Clomiphene citrate |
| CI | Confidence interval |
| CT | Computerised tomography scan |
| DHEAS | Dehydroepiandrosterone sulphate |
| FSH | Follicle stimulating hormone |
| GTT | Glucose tolerance test |
| HbA1C | Glycosylated haemoglobin |
| HDL | High‐density lipoprotein cholesterol |
| IGFBP‐1 | Insulin growth factor binding protein 1 |
| LDL | Low‐density lipoprotein cholesterol |
| LH | Luteinising hormone |
| NIDDM | Non insulin dependent diabetes mellitus |
| PAI‐1 | Plasminogen activator inhibitor 1 |
| PCO | Polycystic ovary |
| PCOS | Polycystic ovary syndrome |
| RCT | Randomised controlled trial |
| rFSH | Recombinant follicle stimulating hormone |
| SD | Standard deviation |
| SE | Standard error of the mean |
| SHBG | Sex hormone‐binding globulin |
| VLDL | Very low density lipoprotein cholesterol |
| vs | Versus |
| MD | Mean difference |
| Convert from | Convert to | Conversion factor | |
| Cholesterol | mg/dL | mmol/L | 0.026 |
| Triglycerides | mg/dL | mmol/L | 0.11 |
| Insulin | pmol/L | mIU/L (= microIU/mL) | 0.1667 |
| Glucose | mg/dL | mmol/L | 0.056 |
| Progesterone | ng/mL | nmol/L | 3.18 |
| Testosterone | ng/dL | nmol/L | 0.03467 |
| Androstenedione | ng/dL | nmol/L | 0.0349 |
| Estradiol | ng/dL | pmol/L | 36.71 |
| 17‐beta oestradiol | ng/dL | pmol/L | 36.71 |
| Dehydroepiandrosterone sulphate | microg/dL | micromol/L | 0.02714 |
| Sex hormone‐binding globulin | microg/dL | nmol/L | 34.7 |
| Standard deviation | Standard error | Standard deviation | Sqrt n |
| Confidence intervals | Confidence intervals | Standard error | (upper limit ‐ lower limit)/3.92 |
| Study ID | Metformin | Placebo | P value | ||
| Events | Cycles | Events | Cycles | ||
| BMI < 30 kg/m2 | |||||
| 27 | 32 | 11 | 32 | ||
| 7 | 12 | 3 | 12 | ||
| 3 | 9 | 3 | 9 | ||
| 17 | 153 | 20 | 150 | ||
| 6 | 16 | 1 | 16 | ||
| BMI ≥ 30 kg/m2 | |||||
| 37 | 45 | 30 | 47 | ||
| 3 | 9 | 6 | 11 | ||
| 4 | 9 | 3 | 9 | ||
| 8 | 28 | 0 | 28 | ||
| 9 | 22 | 9 | 22 | ||
| 12 | 35 | 1 | 26 | ||
| 5 | 63 | 5 | 51 | ||
| 7 | 14 | 6 | 15 | ||
| 17 | 32 | 13 | 33 | ||
| 0 | 12 | 1 | 14 | ||
| 1 | 12 | 1 | 15 | ||
| Study ID | Metformin + | Clomiphene | P value | ||
| Events | Cycles | Events | Cycles | ||
| BMI < 30 kg/m2 | |||||
| 16 | 21 | 8 | 21 | ||
| 10 | 16 | 6 | 16 | ||
| 17 | 32 | 10 | 31 | ||
| 35 | 45 | 29 | 45 | ||
| 17 | 40 | 5 | 40 | ||
| 15 | 21 | 5 | 15 | ||
| 11 | 16 | 3 | 12 | ||
| 84 | 141 | 98 | 168 | ||
| 4 | 9 | 1 | 9 | ||
| 27 | 35 | 23 | 36 | ||
| BMI ≥ 30 kg/m2 | |||||
| 26 | 28 | 22 | 28 | ||
| 7 | 16 | 1 | 15 | ||
| 582 | 964 | 462 | 942 | ||
| 19 | 21 | 2 | 25 | ||
| 38 | 51 | 34 | 55 | ||
| 34 | 52 | 36 | 55 | ||
| 5 | 12 | 4 | 14 | ||
| 9 | 12 | 4 | 15 | ||
| 38 | 41 | 24 | 41 | ||
| Metformin | Clomiphene citrate | ||||
| Study ID | Events | Cycles | Events | Cycles | P value |
| BMI < 30 kg/m2 | |||||
| 129 | 205 | 148 | 221 | ||
| 23 | 35 | 23 | 36 | ||
| BMI ≥ 30 kg/m2 | |||||
| 296 | 1019 | 462 | 942 | ||
| 4 | 42 | 7 | 41 | ||
| Inositol | Placebo | ||||
| Study ID | Events | Cycles | Events | Cycles | P value |
| BMI < 30 kg/m2 | |||||
| 128 | 136 | 130 | 147 | ||
| 19 | 22 | 6 | 22 | ||
| Rosiglitazone | Placebo | ||||
| Study ID | Events | Cycles | Events | Cycles | P value |
| BMI ≥ 30 kg/m2 | |||||
| 16 | 32 | 11 | 32 | ||
| Outcome or subgroup title | No. of studies | No. of participants | Statistical method | Effect size |
| 1 Live birth rate Show forest plot | 4 | 435 | Odds Ratio (M‐H, Fixed, 95% CI) | 1.59 [1.00, 2.51] |
| 1.1 Participants with BMI < 30 kg/m2 | 3 | 370 | Odds Ratio (M‐H, Fixed, 95% CI) | 1.51 [0.94, 2.44] |
| 1.2 Participants with BMI ≥ 30 kg/m2 | 1 | 65 | Odds Ratio (M‐H, Fixed, 95% CI) | 2.87 [0.51, 16.01] |
| 2 Adverse events (gastrointestinal side effects) Show forest plot | 7 | 670 | Odds Ratio (M‐H, Fixed, 95% CI) | 4.76 [3.06, 7.41] |
| 2.1 Participants with BMI < 30 kg/m2 | 4 | 393 | Odds Ratio (M‐H, Fixed, 95% CI) | 5.61 [2.89, 10.88] |
| 2.2 Participants with BMI ≥ 30 kg/m2 | 3 | 277 | Odds Ratio (M‐H, Fixed, 95% CI) | 4.13 [2.28, 7.49] |
| 3 Clinical pregnancy rate Show forest plot | 9 | 1027 | Odds Ratio (M‐H, Fixed, 95% CI) | 1.93 [1.42, 2.64] |
| 3.1 Participants with BMI < 30 kg/m2 | 5 | 733 | Odds Ratio (M‐H, Fixed, 95% CI) | 1.89 [1.35, 2.65] |
| 3.2 Participants with BMI ≥ 30 kg/m2 | 4 | 294 | Odds Ratio (M‐H, Fixed, 95% CI) | 2.21 [0.98, 4.98] |
| 4 Ovulation rate Show forest plot | 14 | 701 | Odds Ratio (M‐H, Fixed, 95% CI) | 2.55 [1.81, 3.59] |
| 4.1 Participants with BMI < 30 kg/m2 | 5 | 229 | Odds Ratio (M‐H, Fixed, 95% CI) | 4.15 [2.31, 7.45] |
| 4.2 Participants with BMI ≥ 30 kg/m2 | 10 | 472 | Odds Ratio (M‐H, Fixed, 95% CI) | 1.96 [1.28, 3.01] |
| 5 Menstrual frequency Show forest plot | 7 | 427 | Odds Ratio (M‐H, Fixed, 95% CI) | 1.72 [1.14, 2.61] |
| 5.1 Participants with BMI < 30 kg/m2 | 1 | 23 | Odds Ratio (M‐H, Fixed, 95% CI) | 21.15 [1.01, 445.00] |
| 5.2 Participants with BMI ≥ 30 kg/m2 | 6 | 404 | Odds Ratio (M‐H, Fixed, 95% CI) | 1.57 [1.03, 2.41] |
| 6 Miscarriage rate per woman Show forest plot | 4 | 748 | Odds Ratio (M‐H, Fixed, 95% CI) | 1.08 [0.50, 2.35] |
| 6.1 Participants with BMI < 30 kg/m2 | 3 | 683 | Odds Ratio (M‐H, Fixed, 95% CI) | 1.19 [0.52, 2.71] |
| 6.2 Participants with BMI ≥ 30 kg/m2 | 1 | 65 | Odds Ratio (M‐H, Fixed, 95% CI) | 0.5 [0.04, 5.80] |
| 7 Sensitivity analysis: miscarriage rate per pregnancy Show forest plot | 4 | 200 | Odds Ratio (M‐H, Fixed, 95% CI) | 0.58 [0.25, 1.34] |
| 7.1 Participants with BMI < 30 kg/m2 | 3 | 188 | Odds Ratio (M‐H, Fixed, 95% CI) | 0.63 [0.26, 1.53] |
| 7.2 Participants with BMI ≥ 30 kg/m2 | 1 | 12 | Odds Ratio (M‐H, Fixed, 95% CI) | 0.25 [0.02, 4.00] |
| 8 Body mass index (kg/m2) Show forest plot | 16 | 827 | Mean Difference (IV, Fixed, 95% CI) | ‐0.08 [‐0.33, 0.17] |
| 8.1 Participants with BMI < 30 kg/m2 | 7 | 419 | Mean Difference (IV, Fixed, 95% CI) | ‐0.06 [‐0.33, 0.21] |
| 8.2 Participants with BMI ≥ 30 kg/m2 | 10 | 408 | Mean Difference (IV, Fixed, 95% CI) | ‐0.20 [‐0.92, 0.52] |
| 9 Waist‐hip ratio Show forest plot | 11 | 702 | Mean Difference (IV, Fixed, 95% CI) | ‐0.01 [‐0.01, ‐0.00] |
| 9.1 Participants with BMI < 30 kg/m2 | 5 | 389 | Mean Difference (IV, Fixed, 95% CI) | ‐0.01 [‐0.01, ‐0.00] |
| 9.2 Participants with BMI ≥ 30 kg/m2 | 6 | 313 | Mean Difference (IV, Fixed, 95% CI) | ‐0.01 [‐0.02, 0.01] |
| 10 Blood pressure ‐ systolic (mm Hg) Show forest plot | 7 | 379 | Mean Difference (IV, Fixed, 95% CI) | ‐3.59 [‐5.13, ‐2.04] |
| 10.1 Participants with BMI < 30 kg/m2 | 3 | 96 | Mean Difference (IV, Fixed, 95% CI) | ‐3.52 [‐5.29, ‐1.76] |
| 10.2 Participants with BMI ≥ 30 kg/m2 | 5 | 283 | Mean Difference (IV, Fixed, 95% CI) | ‐3.80 [‐5.00, ‐0.60] |
| 11 Blood pressure ‐ diastolic (mm Hg) Show forest plot | 6 | 292 | Mean Difference (IV, Fixed, 95% CI) | ‐0.14 [‐1.35, 1.07] |
| 11.1 Participants with BMI < 30 kg/m2 | 3 | 96 | Mean Difference (IV, Fixed, 95% CI) | ‐0.21 [‐1.55, 1.13] |
| 11.2 Participants with BMI ≥ 30 kg/m2 | 4 | 196 | Mean Difference (IV, Fixed, 95% CI) | 0.18 [‐2.65, 3.02] |
| 12 Serum testosterone (nmol/L) Show forest plot | 15 | 863 | Mean Difference (IV, Fixed, 95% CI) | ‐0.49 [‐0.59, ‐0.39] |
| 12.1 Participants with BMI < 30 kg/m2 | 7 | 419 | Mean Difference (IV, Fixed, 95% CI) | ‐0.71 [‐0.86, ‐0.56] |
| 12.2 Participants with BMI ≥ 30 kg/m2 | 9 | 444 | Mean Difference (IV, Fixed, 95% CI) | ‐0.29 [‐0.44, ‐0.15] |
| 13 Serum sex hormone‐binding globulin (nmol/L) Show forest plot | 15 | 823 | Mean Difference (IV, Fixed, 95% CI) | 0.49 [‐1.82, 2.81] |
| 13.1 Participants with BMI < 30 kg/m2 | 6 | 387 | Mean Difference (IV, Fixed, 95% CI) | ‐0.22 [‐6.73, 6.28] |
| 13.2 Participants with BMI ≥ 30 kg/m2 | 10 | 436 | Mean Difference (IV, Fixed, 95% CI) | 0.60 [‐1.88, 3.07] |
| 14 Fasting glucose (mmol/L) Show forest plot | 15 | 849 | Mean Difference (IV, Fixed, 95% CI) | ‐0.14 [‐0.21, ‐0.07] |
| 14.1 Participants with BMI < 30 kg/m2 | 5 | 364 | Mean Difference (IV, Fixed, 95% CI) | ‐0.13 [‐0.22, ‐0.04] |
| 14.2 Participants with BMI ≥ 30 kg/m2 | 11 | 485 | Mean Difference (IV, Fixed, 95% CI) | ‐0.16 [‐0.27, ‐0.05] |
| 15 Fasting insulin (mIU/L) Show forest plot | 14 | 573 | Mean Difference (IV, Fixed, 95% CI) | ‐4.13 [‐5.67, ‐2.58] |
| 15.1 Participants with BMI < 30 kg/m2 | 4 | 85 | Mean Difference (IV, Fixed, 95% CI) | ‐6.20 [‐8.56, ‐3.84] |
| 15.2 Participants with BMI ≥ 30 kg/m2 | 11 | 488 | Mean Difference (IV, Fixed, 95% CI) | ‐2.57 [‐4.62, ‐0.53] |
| 16 Total cholesterol (mmol/L) Show forest plot | 10 | 562 | Mean Difference (IV, Fixed, 95% CI) | ‐0.14 [‐0.31, 0.02] |
| 16.1 Participants with BMI < 30 kg/m2 | 5 | 276 | Mean Difference (IV, Fixed, 95% CI) | ‐0.02 [‐0.26, 0.22] |
| 16.2 Participants with BMI ≥ 30 kg/m2 | 6 | 286 | Mean Difference (IV, Fixed, 95% CI) | ‐0.26 [‐0.48, ‐0.03] |
| 17 Triglyceride levels (mmol/L) Show forest plot | 7 | 309 | Mean Difference (IV, Fixed, 95% CI) | 0.14 [‐0.05, 0.32] |
| 17.1 Participants with BMI < 30 kg/m2 | 3 | 53 | Mean Difference (IV, Fixed, 95% CI) | 0.00 [‐0.33, 0.34] |
| 17.2 Participants with BMI ≥ 30 kg/m2 | 5 | 256 | Mean Difference (IV, Fixed, 95% CI) | 0.20 [‐0.02, 0.42] |
| Outcome or subgroup title | No. of studies | No. of participants | Statistical method | Effect size |
| 1 Live birth rate Show forest plot | 9 | 1079 | Odds Ratio (M‐H, Fixed, 95% CI) | 1.21 [0.92, 1.59] |
| 1.1 Participants with BMI < 30 kg/m2 or ≤ 32 kg/m2 | 5 | 531 | Odds Ratio (M‐H, Fixed, 95% CI) | 1.14 [0.78, 1.67] |
| 1.2 Participants with BMI ≥ 30 kg/m2 | 4 | 548 | Odds Ratio (M‐H, Fixed, 95% CI) | 1.28 [0.86, 1.91] |
| 2 Adverse events Show forest plot | 3 | 591 | Odds Ratio (M‐H, Fixed, 95% CI) | 3.97 [2.59, 6.08] |
| 2.1 Participants with BMI < 30 kg/m2 | 3 | 591 | Odds Ratio (M‐H, Fixed, 95% CI) | 3.97 [2.59, 6.08] |
| 3 Clinical pregnancy rate Show forest plot | 16 | 1529 | Odds Ratio (M‐H, Fixed, 95% CI) | 1.59 [1.27, 1.99] |
| 3.1 Participants with BMI < 30 kg/m2 | 9 | 834 | Odds Ratio (M‐H, Fixed, 95% CI) | 1.46 [1.08, 1.98] |
| 3.2 Participants with BMI ≥ 30 kg/m2 | 7 | 695 | Odds Ratio (M‐H, Fixed, 95% CI) | 1.76 [1.26, 2.47] |
| 4 Ovulation rate Show forest plot | 21 | 1624 | Odds Ratio (M‐H, Fixed, 95% CI) | 1.57 [1.28, 1.92] |
| 4.1 BMI < 30 kg/m2 | 11 | 755 | Odds Ratio (M‐H, Fixed, 95% CI) | 1.79 [1.32, 2.41] |
| 4.2 BMI ≥ 30 kg/m2 | 9 | 814 | Odds Ratio (M‐H, Fixed, 95% CI) | 1.52 [1.15, 2.01] |
| 4.3 BMI not reported | 1 | 55 | Odds Ratio (M‐H, Fixed, 95% CI) | 0.43 [0.13, 1.37] |
| 5 Ovulation rate: subgroup analysis by sensitivity to clomiphene citrate Show forest plot | 7 | 271 | Odds Ratio (M‐H, Fixed, 95% CI) | 4.69 [2.61, 8.44] |
| 5.1 PCOS and clomiphene‐sensitive | 1 | 56 | Odds Ratio (M‐H, Fixed, 95% CI) | 3.55 [0.65, 19.37] |
| 5.2 PCOS and clomiphene‐resistant | 6 | 215 | Odds Ratio (M‐H, Fixed, 95% CI) | 4.89 [2.62, 9.13] |
| 6 Miscarriage rate per woman Show forest plot | 9 | 1096 | Odds Ratio (M‐H, Fixed, 95% CI) | 1.59 [1.03, 2.46] |
| 6.1 Participants with BMI < 30 kg/m2 | 5 | 548 | Odds Ratio (M‐H, Fixed, 95% CI) | 1.41 [0.76, 2.62] |
| 6.2 Participants with BMI ≥ 30 kg/m2 | 4 | 548 | Odds Ratio (M‐H, Fixed, 95% CI) | 1.79 [0.97, 3.32] |
| 7 Sensitivity analysis: miscarriage rate per pregnancy Show forest plot | 8 | 400 | Odds Ratio (M‐H, Fixed, 95% CI) | 1.30 [0.80, 2.12] |
| 7.1 Participants with BMI < 30 kg/m2 | 4 | 228 | Odds Ratio (M‐H, Fixed, 95% CI) | 1.27 [0.65, 2.51] |
| 7.2 Participants with BMI ≥ 30 kg/m2 | 4 | 172 | Odds Ratio (M‐H, Fixed, 95% CI) | 1.34 [0.67, 2.68] |
| 8 Multiple pregnancy rate per woman Show forest plot | 6 | 1003 | Odds Ratio (M‐H, Fixed, 95% CI) | 0.56 [0.18, 1.68] |
| 8.1 Participants with BMI < 30 kg/m2 | 3 | 476 | Odds Ratio (M‐H, Fixed, 95% CI) | 0.50 [0.12, 2.04] |
| 8.2 Participants with BMI ≥ 30kg/m2 | 3 | 527 | Odds Ratio (M‐H, Fixed, 95% CI) | 0.66 [0.11, 4.01] |
| 9 Senstivity analysis: multiple pregnancy rate per pregnancy Show forest plot | 6 | 342 | Odds Ratio (M‐H, Fixed, 95% CI) | 0.46 [0.15, 1.42] |
| 9.1 Participants with BMI < 30 kg/m2 | 3 | 178 | Odds Ratio (M‐H, Fixed, 95% CI) | 0.43 [0.10, 1.85] |
| 9.2 Participants with BMI ≥ 30 kg/m2 | 3 | 164 | Odds Ratio (M‐H, Fixed, 95% CI) | 0.50 [0.08, 3.12] |
| Outcome or subgroup title | No. of studies | No. of participants | Statistical method | Effect size |
| 1 Live birth Show forest plot | 5 | 741 | Odds Ratio (M‐H, Fixed, 95% CI) | 0.71 [0.49, 1.01] |
| 1.1 Participants with BMI < 30 kg/m2 | 3 | 241 | Odds Ratio (M‐H, Fixed, 95% CI) | 1.71 [1.00, 2.94] |
| 1.2 Participants with BMI ≥ 30 kg/m2 | 2 | 500 | Odds Ratio (M‐H, Fixed, 95% CI) | 0.30 [0.17, 0.52] |
| 2 Clinical pregnancy rate Show forest plot | 7 | Odds Ratio (M‐H, Fixed, 95% CI) | Subtotals only | |
| 2.1 Participants with BMI < 30 kg/m2 | 5 | 490 | Odds Ratio (M‐H, Fixed, 95% CI) | 1.56 [1.05, 2.33] |
| 2.2 Participants with BMI ≥ 30 kg/m2 | 2 | 500 | Odds Ratio (M‐H, Fixed, 95% CI) | 0.34 [0.21, 0.55] |
| 3 Ovulation rate Show forest plot | 6 | Odds Ratio (M‐H, Fixed, 95% CI) | Subtotals only | |
| 3.1 Participants with BMI < 30 kg/m2 | 4 | 312 | Odds Ratio (M‐H, Fixed, 95% CI) | 0.81 [0.51, 1.28] |
| 3.2 Participants with BMI ≥ 30 kg/m2 | 2 | 500 | Odds Ratio (M‐H, Fixed, 95% CI) | 0.29 [0.20, 0.43] |
| 4 Miscarriage rate per woman Show forest plot | 5 | 741 | Odds Ratio (M‐H, Fixed, 95% CI) | 0.92 [0.50, 1.67] |
| 4.1 Participants with BMI < 30 kg/m2 | 3 | 241 | Odds Ratio (M‐H, Fixed, 95% CI) | 1.58 [0.61, 4.09] |
| 4.2 Participants with BMI ≥ 30 kg/m2 | 2 | 500 | Odds Ratio (M‐H, Fixed, 95% CI) | 0.61 [0.27, 1.38] |
| 5 Sensitivity analysis: miscarriage rate per pregnancy Show forest plot | 5 | Odds Ratio (M‐H, Fixed, 95% CI) | Totals not selected | |
| 5.1 Participants with BMI < 30 kg/m2 | 3 | Odds Ratio (M‐H, Fixed, 95% CI) | 0.0 [0.0, 0.0] | |
| 5.2 Participants with BMI ≥ 30 kg/m2 | 2 | Odds Ratio (M‐H, Fixed, 95% CI) | 0.0 [0.0, 0.0] | |
| 6 Multiple pregnancy rate per woman Show forest plot | 5 | 858 | Odds Ratio (M‐H, Fixed, 95% CI) | 0.29 [0.06, 1.43] |
| 6.1 Participants with BMI < 30 kg/m2 | 3 | 358 | Odds Ratio (M‐H, Fixed, 95% CI) | 0.46 [0.07, 3.16] |
| 6.2 Participants with BMI ≥ 30 kg/m2 | 2 | 500 | Odds Ratio (M‐H, Fixed, 95% CI) | 0.14 [0.01, 2.76] |
| 7 Sensitivity analysis: multiple pregnancy rate per pregnancy Show forest plot | 5 | 201 | Odds Ratio (M‐H, Fixed, 95% CI) | 0.33 [0.06, 1.68] |
| 7.1 Participants with BMI < 30 kg/m2 | 3 | 103 | Odds Ratio (M‐H, Fixed, 95% CI) | 0.32 [0.05, 2.24] |
| 7.2 Participants with BMI ≥ 30 kg/m2 | 2 | 98 | Odds Ratio (M‐H, Fixed, 95% CI) | 0.33 [0.02, 6.69] |
| Outcome or subgroup title | No. of studies | No. of participants | Statistical method | Effect size |
| 1 Ovulation Show forest plot | 2 | 327 | Odds Ratio (M‐H, Fixed, 95% CI) | 3.57 [1.72, 7.45] |
| 1.1 Participants with BMI < 30 kg/m2 | 2 | 327 | Odds Ratio (M‐H, Fixed, 95% CI) | 3.57 [1.72, 7.45] |
| 2 Body mass index (kg/m2) Show forest plot | 1 | 44 | Mean Difference (IV, Fixed, 95% CI) | 0.5 [‐0.86, 1.86] |
| 3 Waist‐hip ratio Show forest plot | 1 | 44 | Mean Difference (IV, Fixed, 95% CI) | ‐0.01 [‐0.05, 0.03] |
| 4 Blood pressure ‐ systolic (mm Hg) Show forest plot | 1 | 44 | Mean Difference (IV, Fixed, 95% CI) | ‐2.0 [‐5.85, 1.85] |
| 5 Blood pressure ‐ diastolic (mm Hg) Show forest plot | 1 | 44 | Mean Difference (IV, Fixed, 95% CI) | ‐4.0 [‐7.26, ‐0.74] |
| 6 Serum testosterone (nmol/L) Show forest plot | 1 | 44 | Mean Difference (IV, Fixed, 95% CI) | ‐0.63 [‐1.37, 0.11] |
| 7 Serum sex hormone‐binding globulin (nmol/L) Show forest plot | 1 | 44 | Mean Difference (IV, Fixed, 95% CI) | 69.44 [34.97, 103.91] |
| 8 Fasting glucose (mmol/L) Show forest plot | 1 | 44 | Mean Difference (IV, Fixed, 95% CI) | ‐0.28 [‐0.99, 0.43] |
| 9 Fasting insulin (mIU/L) Show forest plot | 1 | 44 | Mean Difference (IV, Fixed, 95% CI) | ‐20.0 [‐43.43, 3.43] |
| 10 Total cholesterol (mmol/L) Show forest plot | 1 | 44 | Mean Difference (IV, Fixed, 95% CI) | ‐0.23 [‐0.99, 0.53] |
| 11 Triglyceride levels (mmol/L) Show forest plot | 1 | 44 | Mean Difference (IV, Fixed, 95% CI) | ‐2.20 [‐6.23, 1.83] |
| Outcome or subgroup title | No. of studies | No. of participants | Statistical method | Effect size |
| 1 Ovulation rate Show forest plot | 1 | 64 | Odds Ratio (M‐H, Fixed, 95% CI) | 1.91 [0.70, 5.22] |
| 1.1 Participants with BMI ≥ 30 kg/m2 | 1 | 64 | Odds Ratio (M‐H, Fixed, 95% CI) | 1.91 [0.70, 5.22] |
| 2 Menstrual frequency Show forest plot | 2 | 100 | Odds Ratio (M‐H, Fixed, 95% CI) | 5.59 [2.20, 14.19] |
| 3 Body mass index (kg/m2) Show forest plot | 3 | 132 | Mean Difference (IV, Fixed, 95% CI) | 0.68 [0.40, 0.96] |
| 4 Waist‐hip ratio Show forest plot | 3 | 132 | Mean Difference (IV, Fixed, 95% CI) | ‐0.01 [‐0.02, ‐0.00] |
| 5 Blood pressure ‐ systolic (mm Hg) Show forest plot | 1 | 52 | Mean Difference (IV, Fixed, 95% CI) | ‐2.0 [‐3.95, ‐0.05] |
| 6 Blood pressure ‐ diastolic (mm Hg) Show forest plot | 1 | 52 | Mean Difference (IV, Fixed, 95% CI) | ‐0.20 [‐1.72, 1.32] |
| 7 Serum testosterone (nmol/L) Show forest plot | 1 | 54 | Mean Difference (IV, Fixed, 95% CI) | 0.20 [‐0.34, 0.74] |
| 8 Serum sex hormone‐binding globulin (nmol/L) Show forest plot | 3 | 132 | Mean Difference (IV, Fixed, 95% CI) | ‐0.69 [‐10.37, 8.98] |
| 9 Fasting glucose (mmol/L) Show forest plot | 3 | 132 | Mean Difference (IV, Fixed, 95% CI) | ‐0.21 [‐0.39, ‐0.04] |
| 10 Fasting insulin (mIU/L) Show forest plot | 2 | 80 | Mean Difference (IV, Fixed, 95% CI) | ‐3.98 [‐9.38, 1.42] |
| 11 Total cholesterol (mmol/L) Show forest plot | 2 | 80 | Mean Difference (IV, Fixed, 95% CI) | ‐0.20 [‐0.21, ‐0.19] |
| 12 Triglyceride levels (mmol/L) Show forest plot | 1 | 26 | Mean Difference (IV, Fixed, 95% CI) | 1.0 [0.89, 1.11] |
| Outcome or subgroup title | No. of studies | No. of participants | Statistical method | Effect size |
| 1 Menstrual frequency Show forest plot | 2 | 70 | Odds Ratio (M‐H, Fixed, 95% CI) | 8.88 [2.35, 33.61] |
| 1.1 Participants with BMI < 30 kg/m2 | 1 | 40 | Odds Ratio (M‐H, Fixed, 95% CI) | 10.23 [1.12, 93.34] |
| 1.2 Participants with BMI ≥ 30 kg/m2 | 1 | 30 | Odds Ratio (M‐H, Fixed, 95% CI) | 8.0 [1.52, 42.04] |
| 2 Body mass index (kg/m2) Show forest plot | 2 | 63 | Mean Difference (IV, Fixed, 95% CI) | 0.91 [‐1.88, 3.70] |
| 3 Waist‐hip ratio Show forest plot | 1 | 28 | Mean Difference (IV, Fixed, 95% CI) | 0.02 [‐0.02, 0.06] |
| 4 Serum testosterone (nmol/L) Show forest plot | 2 | 63 | Mean Difference (IV, Fixed, 95% CI) | ‐0.12 [‐0.53, 0.29] |
| 5 Serum sex hormone‐binding globulin (nmol/L) Show forest plot | 2 | 63 | Mean Difference (IV, Fixed, 95% CI) | 2.75 [‐5.26, 10.77] |
| 6 Fasting insulin (mIU/L) Show forest plot | 2 | 63 | Mean Difference (IV, Fixed, 95% CI) | ‐1.46 [‐3.97, 1.06] |