| 1 Live birth rate Show forest plot | 3 | 115 | Odds Ratio (M‐H, Fixed, 95% CI) | 1.80 [0.52, 6.16] |
|
| 2 Adverse events (gastrointestinal side effects) Show forest plot | 6 | | Odds Ratio (M‐H, Fixed, 95% CI) | Subtotals only |
|
| 2.1 Nausea and vomiting | 3 | 73 | Odds Ratio (M‐H, Fixed, 95% CI) | 3.91 [0.98, 15.64] |
| 2.2 Gastrointestinal disturbance (other than nausea and vomiting) | 5 | 318 | Odds Ratio (M‐H, Fixed, 95% CI) | 4.27 [2.40, 7.59] |
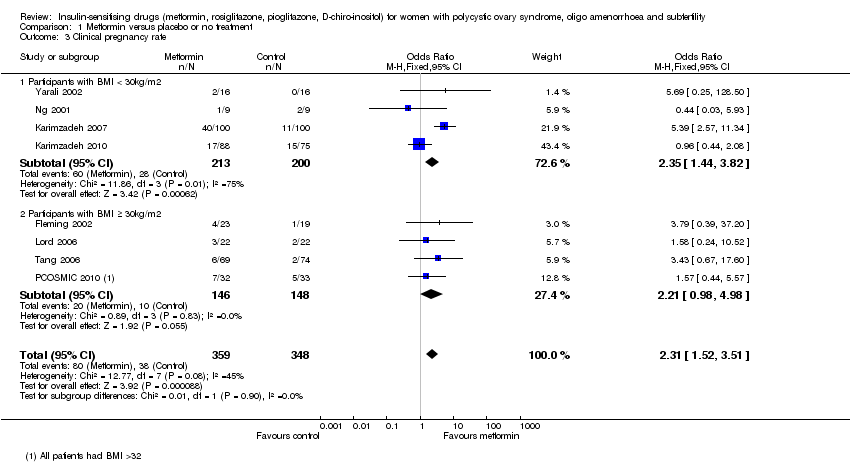
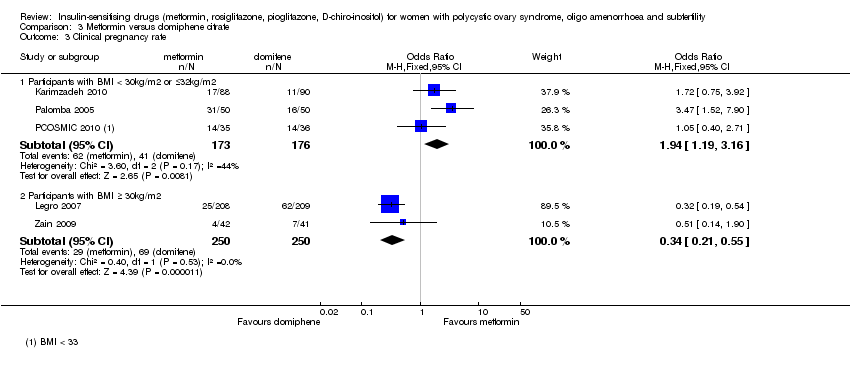
| 3 Clinical pregnancy rate Show forest plot | 8 | 707 | Odds Ratio (M‐H, Fixed, 95% CI) | 2.31 [1.52, 3.51] |
|
| 3.1 Participants with BMI < 30kg/m2 | 4 | 413 | Odds Ratio (M‐H, Fixed, 95% CI) | 2.35 [1.44, 3.82] |
| 3.2 Participants with BMI ≥ 30kg/m2 | 4 | 294 | Odds Ratio (M‐H, Fixed, 95% CI) | 2.21 [0.98, 4.98] |
| 4 Ovulation rate Show forest plot | 15 | 1208 | Odds Ratio (M‐H, Random, 95% CI) | 1.81 [1.13, 2.93] |
|
| 4.1 Participants with BMI < 30kg/m2 | 5 | 441 | Odds Ratio (M‐H, Random, 95% CI) | 2.94 [0.81, 10.61] |
| 4.2 Participants with BMI ≥ 30kg/m2 | 11 | 767 | Odds Ratio (M‐H, Random, 95% CI) | 1.50 [0.95, 2.37] |
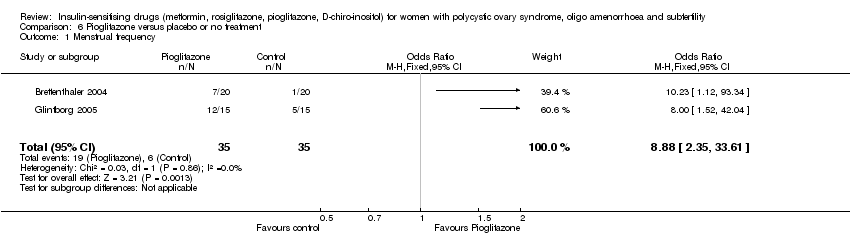
| 5 Menstrual frequency Show forest plot | 7 | 427 | Odds Ratio (M‐H, Fixed, 95% CI) | 1.72 [1.14, 2.61] |
|
| 5.1 Participants with BMI <30 kg/m2 | 1 | 23 | Odds Ratio (M‐H, Fixed, 95% CI) | 21.15 [1.01, 445.00] |
| 5.2 Participants with BMI ≥ 30kg/m2 | 6 | 404 | Odds Ratio (M‐H, Fixed, 95% CI) | 1.57 [1.03, 2.41] |
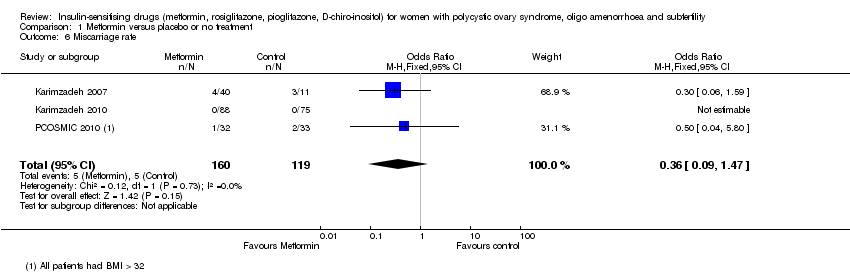
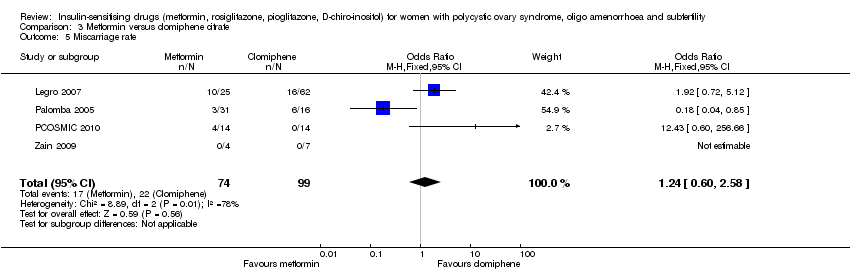
| 6 Miscarriage rate Show forest plot | 3 | 279 | Odds Ratio (M‐H, Fixed, 95% CI) | 0.36 [0.09, 1.47] |
|
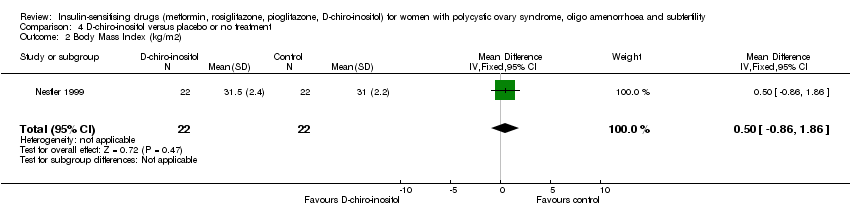
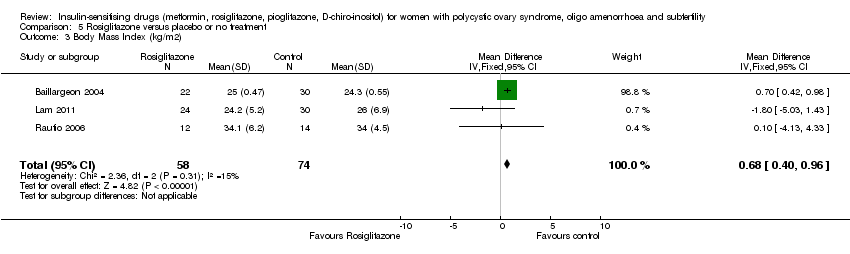
| 7 Body Mass Index (kg/m2) Show forest plot | 16 | 630 | Mean Difference (IV, Fixed, 95% CI) | ‐0.05 [‐0.31, 0.20] |
|
| 7.1 Participants with BMI < 30kg/m2 | 6 | 166 | Mean Difference (IV, Fixed, 95% CI) | ‐0.04 [‐0.31, 0.23] |
| 7.2 Participants with BMI ≥ 30kg/m2 | 11 | 464 | Mean Difference (IV, Fixed, 95% CI) | ‐0.15 [‐0.86, 0.55] |
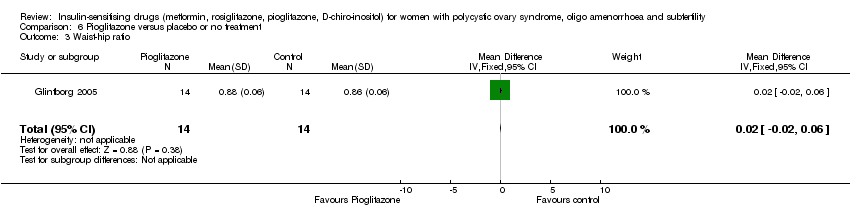
| 8 Waist‐hip ratio Show forest plot | 10 | 449 | Mean Difference (IV, Fixed, 95% CI) | ‐0.01 [‐0.01, ‐0.00] |
|
| 8.1 Participants with BMI < 30kg/m2 | 4 | 136 | Mean Difference (IV, Fixed, 95% CI) | ‐0.01 [‐0.01, ‐0.00] |
| 8.2 Participants with BMI ≥ 30kg/m2 | 6 | 313 | Mean Difference (IV, Fixed, 95% CI) | ‐0.01 [‐0.02, 0.01] |
| 9 Blood pressure ‐ systolic (mm Hg) Show forest plot | 7 | 379 | Mean Difference (IV, Fixed, 95% CI) | ‐3.59 [‐5.13, ‐2.04] |
|
| 9.1 Participants with BMI <30kg/m2 | 3 | 96 | Mean Difference (IV, Fixed, 95% CI) | ‐3.52 [‐5.29, ‐1.76] |
| 9.2 Participants with BMI ≥ 30kg/m2 | 5 | 283 | Mean Difference (IV, Fixed, 95% CI) | ‐3.80 [‐5.00, ‐0.60] |
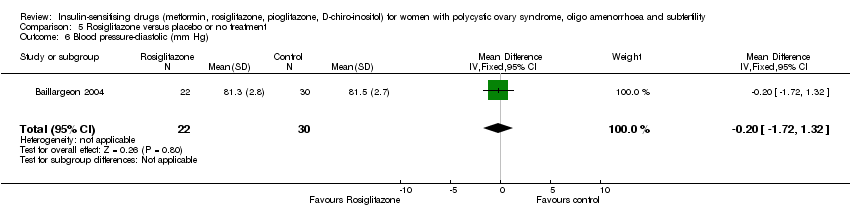
| 10 Blood pressure ‐ diastolic (mm Hg) Show forest plot | 6 | 292 | Mean Difference (IV, Fixed, 95% CI) | ‐0.14 [‐1.35, 1.07] |
|
| 10.1 Participants with BMI < 30kg/m2 | 3 | 96 | Mean Difference (IV, Fixed, 95% CI) | ‐0.21 [‐1.55, 1.13] |
| 10.2 Participants with BMI ≥ 30kg/m2 | 4 | 196 | Mean Difference (IV, Fixed, 95% CI) | 0.18 [‐2.65, 3.02] |
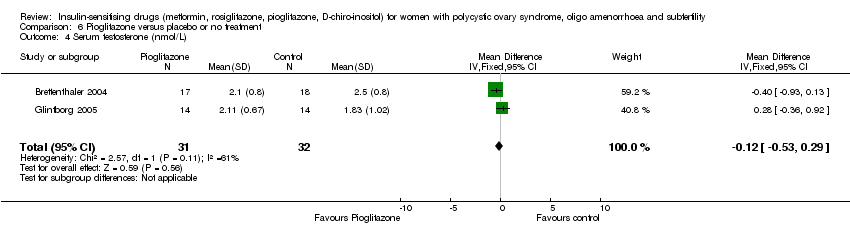
| 11 Serum testosterone (nmol/L) Show forest plot | 14 | 610 | Mean Difference (IV, Fixed, 95% CI) | ‐0.60 [‐0.73, ‐0.48] |
|
| 11.1 Participants with BMI < 30kg/m2 | 6 | 166 | Mean Difference (IV, Fixed, 95% CI) | ‐1.68 [‐1.95, ‐1.42] |
| 11.2 Participants with BMI ≥ 30kg/m2 | 9 | 444 | Mean Difference (IV, Fixed, 95% CI) | ‐0.29 [‐0.44, ‐0.15] |
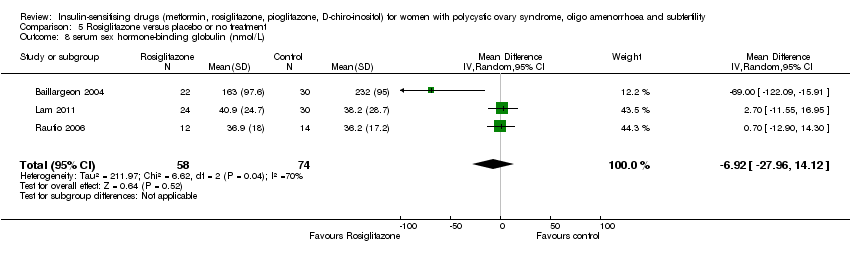
| 12 Serum sex hormone‐binding globulin (nmol/L) Show forest plot | 15 | 626 | Mean Difference (IV, Fixed, 95% CI) | ‐0.05 [‐2.33, 2.24] |
|
| 12.1 Participants with BMI < 30kg/m2 | 5 | 134 | Mean Difference (IV, Fixed, 95% CI) | ‐5.23 [‐14.34, 3.87] |
| 12.2 Participants with BMI ≥ 30kg/m2 | 11 | 492 | Mean Difference (IV, Fixed, 95% CI) | 0.30 [‐2.06, 2.66] |
| 13 Fasting glucose (mmol/L) Show forest plot | 14 | 596 | Mean Difference (IV, Fixed, 95% CI) | ‐0.15 [‐0.25, ‐0.06] |
|
| 13.1 Participants with BMI < 30kg/m2 | 4 | 111 | Mean Difference (IV, Fixed, 95% CI) | ‐0.13 [‐0.31, 0.05] |
| 13.2 Participants with BMI ≥ 30kg/m2 | 11 | 485 | Mean Difference (IV, Fixed, 95% CI) | ‐0.16 [‐0.27, ‐0.05] |
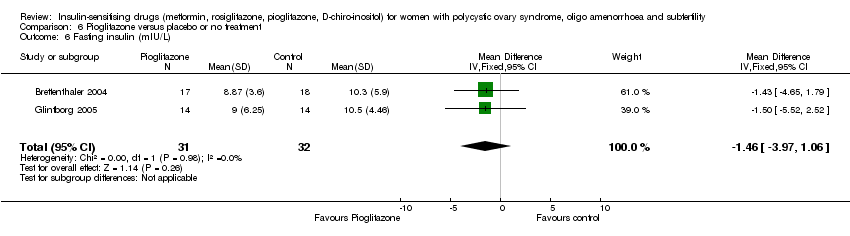
| 14 Fasting insulin (mIU/L) Show forest plot | 14 | 573 | Mean Difference (IV, Random, 95% CI) | ‐3.51 [‐6.50, ‐0.53] |
|
| 14.1 Participants with BMI < 30kg/m2 | 4 | 85 | Mean Difference (IV, Random, 95% CI) | ‐5.65 [‐10.25, ‐1.06] |
| 14.2 Participants with BMI ≥ 30kg/m2 | 11 | 488 | Mean Difference (IV, Random, 95% CI) | ‐2.72 [‐6.50, 1.05] |
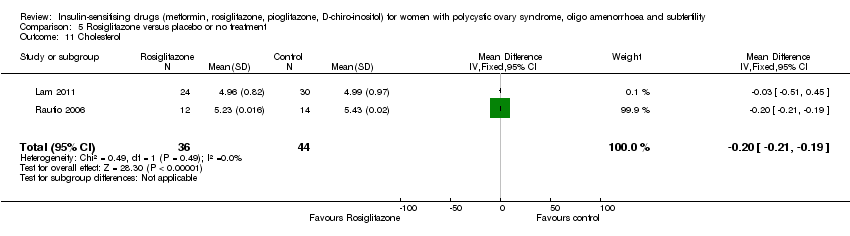
| 15 Total cholesterol (mmol/l) Show forest plot | 10 | 562 | Mean Difference (IV, Fixed, 95% CI) | ‐0.14 [‐0.31, 0.02] |
|
| 15.1 Participants with BMI< 30kg/m2 | 5 | 276 | Mean Difference (IV, Fixed, 95% CI) | ‐0.02 [‐0.26, 0.22] |
| 15.2 Participants with BMI ≥ 30kg/m2 | 6 | 286 | Mean Difference (IV, Fixed, 95% CI) | ‐0.26 [‐0.48, ‐0.03] |
| 16 Triglyceride levels (mmol/L) Show forest plot | 7 | 309 | Mean Difference (IV, Fixed, 95% CI) | 0.14 [‐0.05, 0.32] |
|
| 16.1 Participants with BMI < 30kg/m2 | 3 | 53 | Mean Difference (IV, Fixed, 95% CI) | 0.00 [‐0.33, 0.34] |
| 16.2 Participants with BMI ≥ 30kg/m2 | 5 | 256 | Mean Difference (IV, Fixed, 95% CI) | 0.20 [‐0.02, 0.42] |