| 1 Live birth rate Show forest plot | 2 | 50 | Odds Ratio (M‐H, Fixed, 95% CI) | 1.0 [0.16, 6.39] |
|
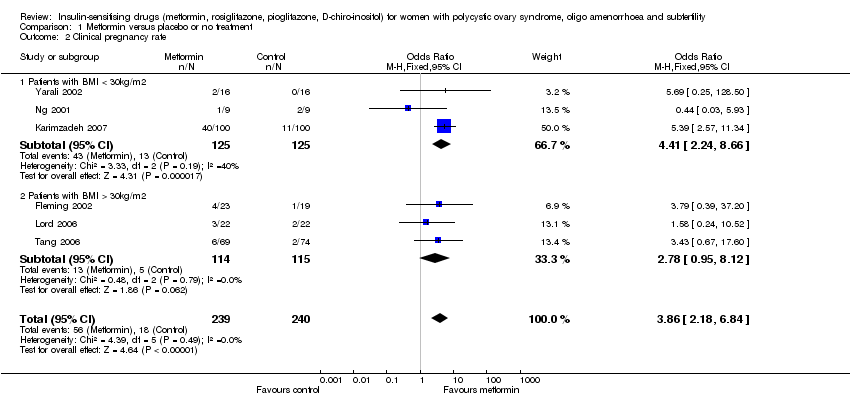
| 2 Clinical pregnancy rate Show forest plot | 6 | 479 | Odds Ratio (M‐H, Fixed, 95% CI) | 3.86 [2.18, 6.84] |
|
| 2.1 Patients with BMI < 30kg/m2 | 3 | 250 | Odds Ratio (M‐H, Fixed, 95% CI) | 4.41 [2.24, 8.66] |
| 2.2 Patients with BMI > 30kg/m2 | 3 | 229 | Odds Ratio (M‐H, Fixed, 95% CI) | 2.78 [0.95, 8.12] |
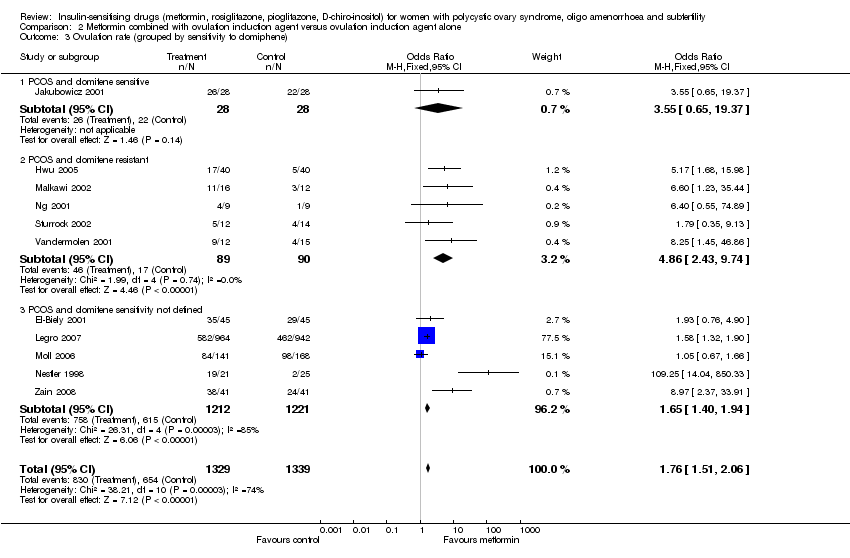
| 3 Ovulation rate Show forest plot | 13 | 875 | Odds Ratio (M‐H, Fixed, 95% CI) | 2.12 [1.50, 3.00] |
|
| 3.1 Patients with BMI < 30kg/m2 | 4 | 417 | Odds Ratio (M‐H, Fixed, 95% CI) | 2.33 [1.43, 3.81] |
| 3.2 Patients with BMI > 30kg/m2 | 9 | 458 | Odds Ratio (M‐H, Fixed, 95% CI) | 1.94 [1.20, 3.15] |
| 4 Improved menstrual pattern Show forest plot | 8 | 427 | Odds Ratio (M‐H, Fixed, 95% CI) | 1.72 [1.14, 2.61] |
|
| 4.1 Patients with BMI <30 kg/m2 | 1 | 23 | Odds Ratio (M‐H, Fixed, 95% CI) | 21.15 [1.01, 445.00] |
| 4.2 Patients with BMI > 30kg/m2 | 7 | 404 | Odds Ratio (M‐H, Fixed, 95% CI) | 1.57 [1.03, 2.41] |
| 5 Miscarriage rate Show forest plot | 1 | 51 | Odds Ratio (M‐H, Fixed, 95% CI) | 0.30 [0.06, 1.59] |
|
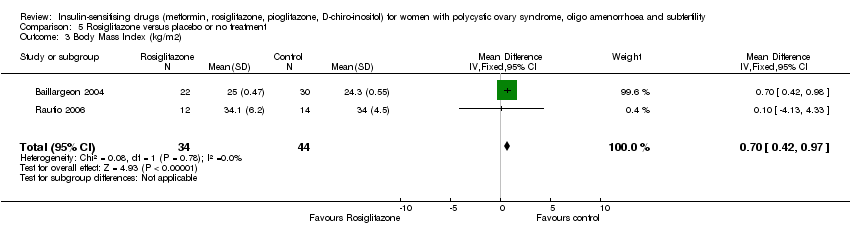
| 6 Body Mass Index (kg/m2) Show forest plot | 14 | 504 | Mean Difference (IV, Fixed, 95% CI) | ‐0.04 [‐0.29, 0.22] |
|
| 6.1 Patients with BMI < 30kg/m2 | 5 | 143 | Mean Difference (IV, Fixed, 95% CI) | ‐0.03 [‐0.30, 0.25] |
| 6.2 Patients with BMI >30kg/m2 | 9 | 361 | Mean Difference (IV, Fixed, 95% CI) | ‐0.08 [‐0.82, 0.66] |
| 7 Waist circumference (cm) Show forest plot | 2 | 153 | Mean Difference (IV, Fixed, 95% CI) | 0.51 [‐3.62, 4.64] |
|
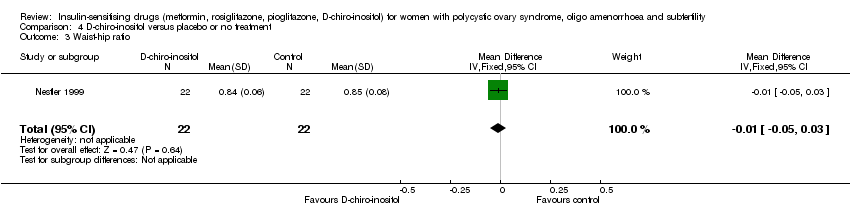
| 8 Waist‐hip ratio Show forest plot | 8 | 408 | Mean Difference (IV, Fixed, 95% CI) | ‐0.01 [‐0.01, ‐0.00] |
|
| 8.1 Patients with BMI < 30kg/m2 | 3 | 113 | Mean Difference (IV, Fixed, 95% CI) | ‐0.01 [‐0.01, ‐0.00] |
| 8.2 Patients with BMI >30kg/m2 | 5 | 295 | Mean Difference (IV, Fixed, 95% CI) | ‐0.00 [‐0.02, 0.02] |
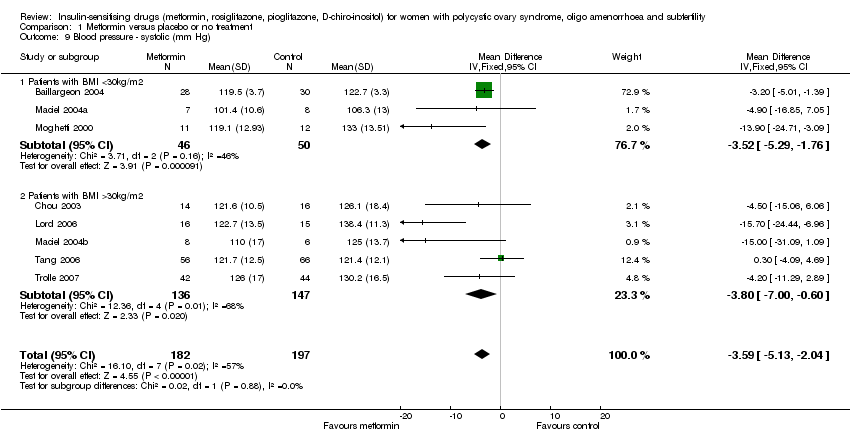
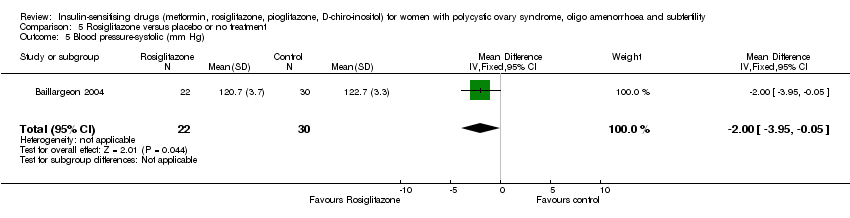
| 9 Blood pressure ‐ systolic (mm Hg) Show forest plot | 8 | 379 | Mean Difference (IV, Fixed, 95% CI) | ‐3.59 [‐5.13, ‐2.04] |
|
| 9.1 Patients with BMI <30kg/m2 | 3 | 96 | Mean Difference (IV, Fixed, 95% CI) | ‐3.52 [‐5.29, ‐1.76] |
| 9.2 Patients with BMI >30kg/m2 | 5 | 283 | Mean Difference (IV, Fixed, 95% CI) | ‐3.80 [‐5.00, ‐0.60] |
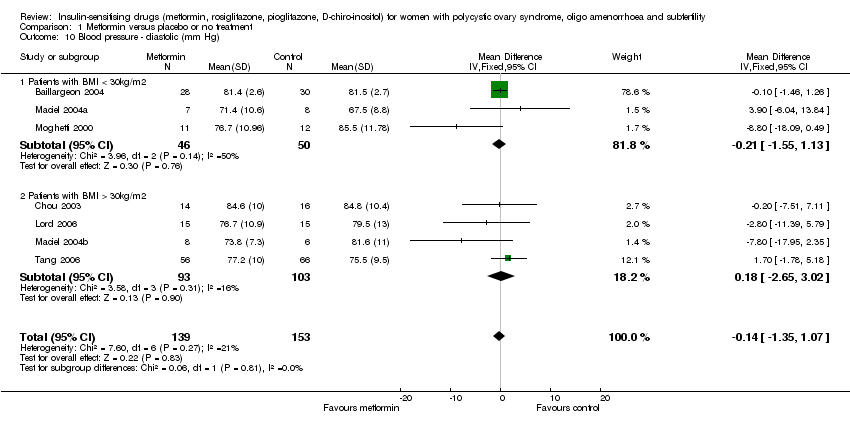
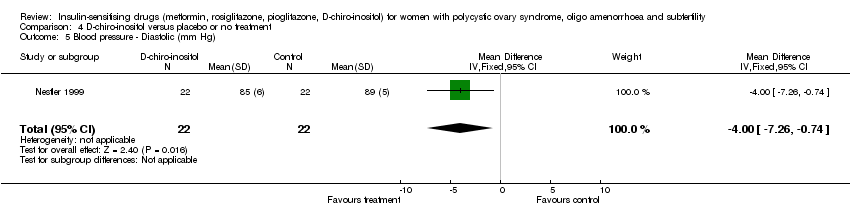
| 10 Blood pressure ‐ diastolic (mm Hg) Show forest plot | 7 | 292 | Mean Difference (IV, Fixed, 95% CI) | ‐0.14 [‐1.35, 1.07] |
|
| 10.1 Patients with BMI < 30kg/m2 | 3 | 96 | Mean Difference (IV, Fixed, 95% CI) | ‐0.21 [‐1.55, 1.13] |
| 10.2 Patients with BMI > 30kg/m2 | 4 | 196 | Mean Difference (IV, Fixed, 95% CI) | 0.18 [‐2.65, 3.02] |
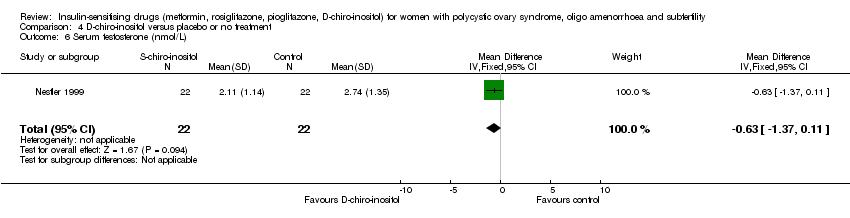
| 11 Serum testosterone (nmol/L) Show forest plot | 16 | 607 | Mean Difference (IV, Fixed, 95% CI) | ‐0.60 [‐0.73, ‐0.47] |
|
| 11.1 Patients with BMI < 30kg/m2 | 5 | 143 | Mean Difference (IV, Fixed, 95% CI) | ‐1.79 [‐2.07, ‐1.51] |
| 11.2 Patients with BMI > 30kg/m2 | 11 | 464 | Mean Difference (IV, Fixed, 95% CI) | ‐0.29 [‐0.43, ‐0.15] |
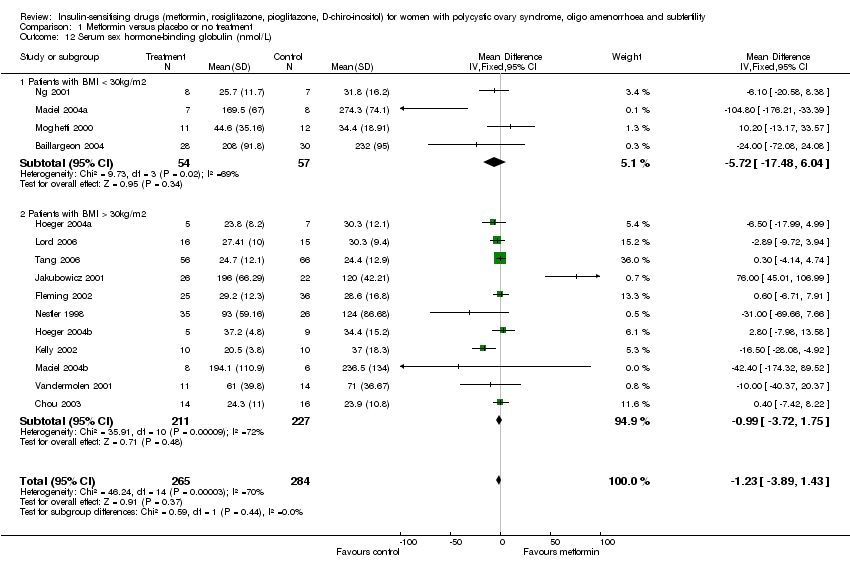
| 12 Serum sex hormone‐binding globulin (nmol/L) Show forest plot | 15 | 549 | Mean Difference (IV, Fixed, 95% CI) | ‐1.23 [‐3.89, 1.43] |
|
| 12.1 Patients with BMI < 30kg/m2 | 4 | 111 | Mean Difference (IV, Fixed, 95% CI) | ‐5.72 [‐17.48, 6.04] |
| 12.2 Patients with BMI > 30kg/m2 | 11 | 438 | Mean Difference (IV, Fixed, 95% CI) | ‐0.99 [‐3.72, 1.75] |
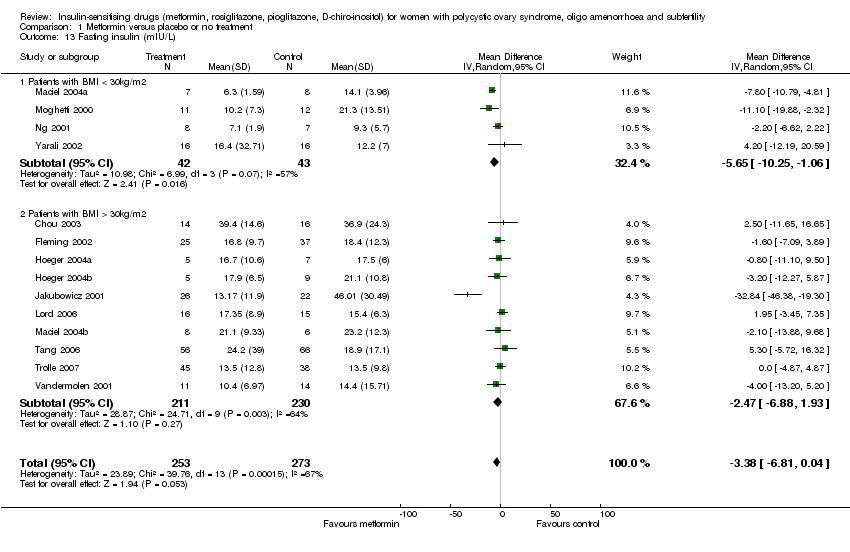
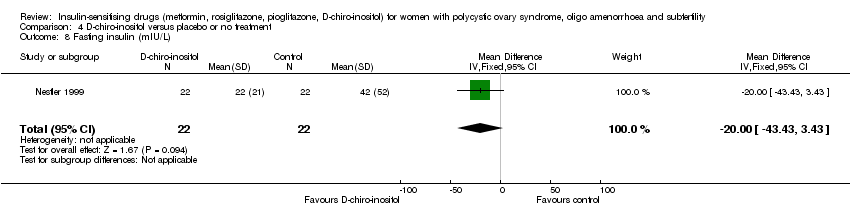
| 13 Fasting insulin (mIU/L) Show forest plot | 14 | 526 | Mean Difference (IV, Random, 95% CI) | ‐3.38 [‐6.81, 0.04] |
|
| 13.1 Patients with BMI < 30kg/m2 | 4 | 85 | Mean Difference (IV, Random, 95% CI) | ‐5.65 [‐10.25, ‐1.06] |
| 13.2 Patients with BMI > 30kg/m2 | 10 | 441 | Mean Difference (IV, Random, 95% CI) | ‐2.47 [‐6.88, 1.93] |
| 14 Fasting glucose (mmol/L) Show forest plot | 14 | 549 | Mean Difference (IV, Fixed, 95% CI) | ‐0.15 [‐0.25, ‐0.05] |
|
| 14.1 Patients with BMI < 30kg/m2 | 4 | 111 | Mean Difference (IV, Fixed, 95% CI) | ‐0.13 [‐0.31, 0.05] |
| 14.2 Patients with BMI > 30kg/m2 | 10 | 438 | Mean Difference (IV, Fixed, 95% CI) | ‐0.16 [‐0.27, ‐0.04] |
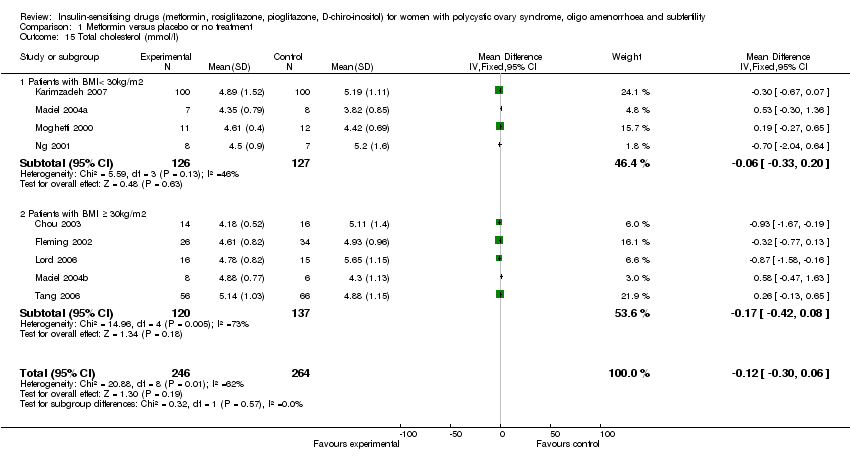
| 15 Total cholesterol (mmol/l) Show forest plot | 9 | 510 | Mean Difference (IV, Fixed, 95% CI) | ‐0.12 [‐0.30, 0.06] |
|
| 15.1 Patients with BMI< 30kg/m2 | 4 | 253 | Mean Difference (IV, Fixed, 95% CI) | ‐0.06 [‐0.33, 0.20] |
| 15.2 Patients with BMI ≥ 30kg/m2 | 5 | 257 | Mean Difference (IV, Fixed, 95% CI) | ‐0.17 [‐0.42, 0.08] |
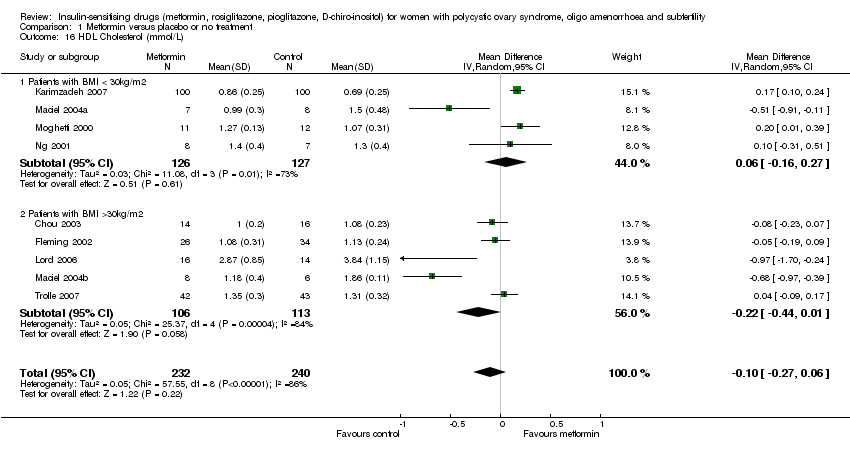
| 16 HDL Cholesterol (mmol/L) Show forest plot | 9 | 472 | Mean Difference (IV, Random, 95% CI) | ‐0.10 [‐0.27, 0.06] |
|
| 16.1 Patients with BMI < 30kg/m2 | 4 | 253 | Mean Difference (IV, Random, 95% CI) | 0.06 [‐0.16, 0.27] |
| 16.2 Patients with BMI >30kg/m2 | 5 | 219 | Mean Difference (IV, Random, 95% CI) | ‐0.22 [‐0.44, 0.01] |
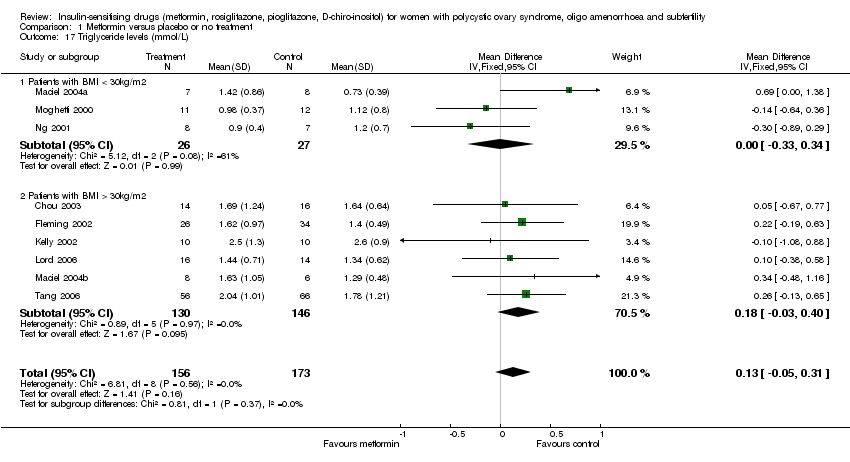
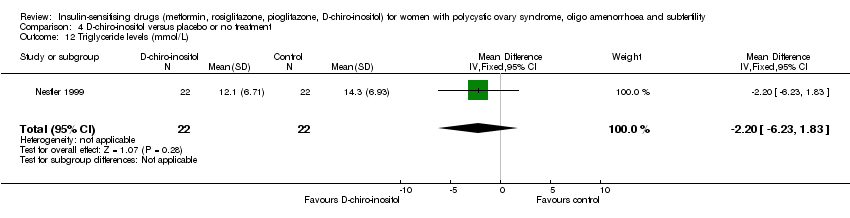
| 17 Triglyceride levels (mmol/L) Show forest plot | 9 | 329 | Mean Difference (IV, Fixed, 95% CI) | 0.13 [‐0.05, 0.31] |
|
| 17.1 Patients with BMI < 30kg/m2 | 3 | 53 | Mean Difference (IV, Fixed, 95% CI) | 0.00 [‐0.33, 0.34] |
| 17.2 Patients with BMI > 30kg/m2 | 6 | 276 | Mean Difference (IV, Fixed, 95% CI) | 0.18 [‐0.03, 0.40] |
| 18 Adverse events (gastrointestinal side effects) Show forest plot | 5 | | Odds Ratio (M‐H, Fixed, 95% CI) | Subtotals only |
|
| 18.1 Nausea and vomiting | 3 | 73 | Odds Ratio (M‐H, Fixed, 95% CI) | 3.91 [0.98, 15.64] |
| 18.2 Gastrointestinal disturbance (other than nausea and vomiting) | 4 | 253 | Odds Ratio (M‐H, Fixed, 95% CI) | 9.23 [4.18, 20.37] |