Agentes dopaminérgicos para la encefalopatía hepática
Appendices
Appendix 1. Search strategies
| Database | Time span | Search strategy |
| Cochrane Hepato‐Biliary Group Controlled Trials Register | January 2014. | (dopa* OR 'dopa decarboxylase' OR levodopa OR bromocriptine) AND ('liver cirrhosis' OR 'hepatic encephalopathy') |
| The Cochrane Central Register of Controlled Trials (CENTRAL) | Issue 12 of 12, 2013. | #1 MeSH descriptor: [Dopamine Agents] explode all trees #2 MeSH descriptor: [Dopa Decarboxylase] explode all trees #3 MeSH descriptor: [Levodopa] explode all trees #4 MeSH descriptor: [Bromocriptine] explode all trees #5 dopa* or dopa decarboxylase or levodopa or bromocriptine #6 #1 or #2 or #3 or #4 or #5 #7 MeSH descriptor: [Liver Cirrhosis] explode all trees #8 MeSH descriptor: [Hepatic Encephalopathy] explode all trees #9 (liver cirrhosis or hepatic encephalopathy) #10 #7 or #8 or #9 #11 #6 and #10 |
| MEDLINE (Ovid SP) | 1946 to January 2014. | 1. exp Dopamine Agents/ 2. exp Dopa Decarboxylase/ 3. exp Levodopa/ 4. exp Bromocriptine/ 5. (dopa* or dopa decarboxylase or levodopa or bromocriptine).mp. [mp=protocol supplementary concept, rare disease supplementary concept, title, original title, abstract, name of substance word, subject heading word, unique identifier] 6. 1 or 2 or 3 or 4 or 5 7. exp Liver Cirrhosis/ 8. exp Hepatic Encephalopathy/ 9. (liver cirrhosis or hepatic encephalopathy).mp. [mp=protocol supplementary concept, rare disease supplementary concept, title, original title, abstract, name of substance word, subject heading word, unique identifier] 10. 7 or 8 or 9 11. 6 and 10 12. (random* or blind* or placebo* or meta‐analysis).mp. [mp=protocol supplementary concept, rare disease supplementary concept, title, original title, abstract, name of substance word, subject heading word, unique identifier] 13. 11 and 12 |
| EMBASE (Ovid SP) | 1974 to January 2014. | 1. exp dopamine receptor stimulating agent/ 2. exp dopamine receptor blocking agent/ 3. exp aromatic levo amino acid decarboxylase/ 4. exp LEVODOPA/ 5. exp BROMOCRIPTINE/ 6. (dopa* or dopa decarboxylase or levodopa or bromocriptine).mp. [mp=title, abstract, subject headings, heading word, drug trade name, original title, device manufacturer, drug manufacturer] 7. 1 or 2 or 3 or 4 or 5 or 6 8. exp liver cirrhosis/ 9. exp hepatic encephalopathy/ 10. (liver cirrhosis or hepatic encephalopathy).mp. [mp=title, abstract, subject headings, heading word, drug trade name, original title, device manufacturer, drug manufacturer] 11. 8 or 9 or 10 12. 7 and 11 13. (random* or blind* or placebo* or meta‐analysis).mp. [mp=title, abstract, subject headings, heading word, drug trade name, original title, device manufacturer, drug manufacturer] 14. 12 and 13 |
| Science Citation Index‐Expanded (http://apps.webofknowledge.com) | 1900 to January 2014. | #5 20 #4 AND #3 #4 1,186,796 TS=(random* or blind* or placebo* or meta‐analysis) #3 205 #2 AND #1 #2 54,464 TS=(liver cirrhosis or hepatic encephalopathy) #1 198,470 TS=(dopa* or dopa decarboxylase or levodopa or bromocriptine) |


Figure 2. Risk of bias graph: review authors' judgements about all risk of bias items presented as percentages across all included studies.
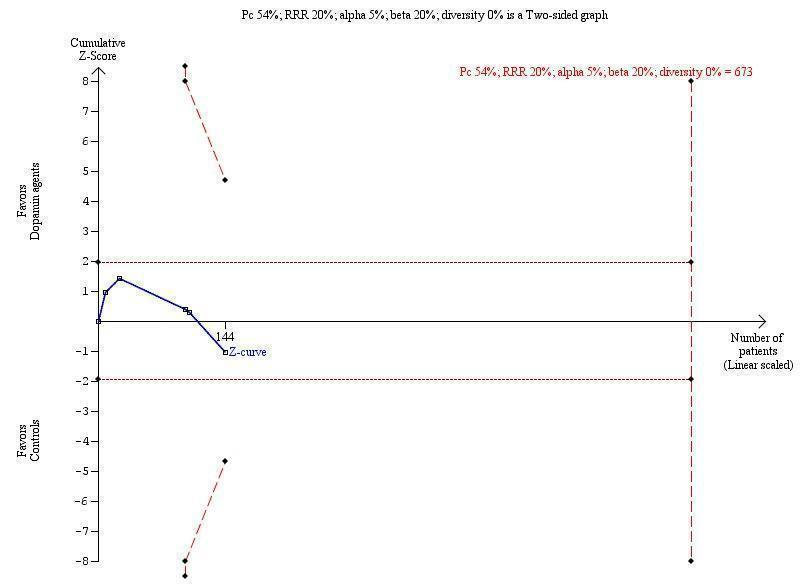
Trial sequential analysis of dopamine agents versus placebo or no intervention in participants with hepatic encephalopathy.
The outcome measure is mortality. The analysis was performed with an event rate of 54% (Pc) in the control group, a risk ratio (RR) reduction of 20%, alpha 5%, beta 20%, and diversity 0%. The cumulative Z‐curve does not cross the naive 5% statistical boundaries (dotted horizontal lines) or the trial sequential boundaries for benefits or harms (inward sloping etched lines). The results show that the diversity‐adjusted required information size was 673 participants, corresponding to 21% of the total sample size in the included trials. The programme did not even draw futility boundaries. Accordingly, the meta‐analysis does not recommend or refute an intervention effect; data are simply too few.

Comparison 1 Dopamine agonists versus placebo or no intervention, Outcome 1 Mortality.

Comparison 1 Dopamine agonists versus placebo or no intervention, Outcome 2 Mortality stratified by type of hepatic encephalopathy.
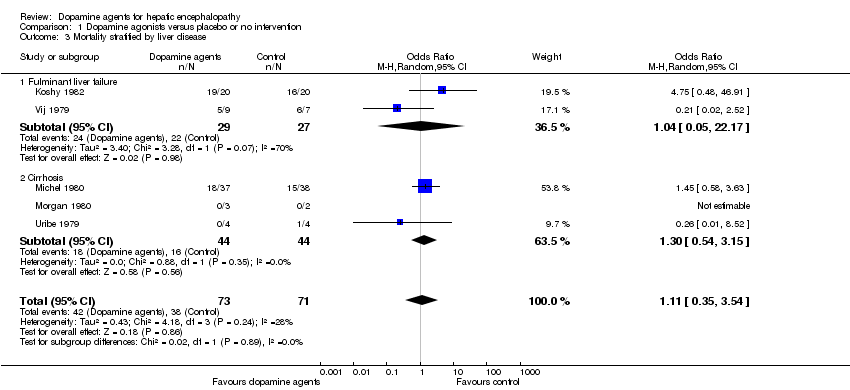
Comparison 1 Dopamine agonists versus placebo or no intervention, Outcome 3 Mortality stratified by liver disease.

Comparison 1 Dopamine agonists versus placebo or no intervention, Outcome 4 Mortality stratified by intervention.

Comparison 1 Dopamine agonists versus placebo or no intervention, Outcome 5 Mortality stratified by bias risk.
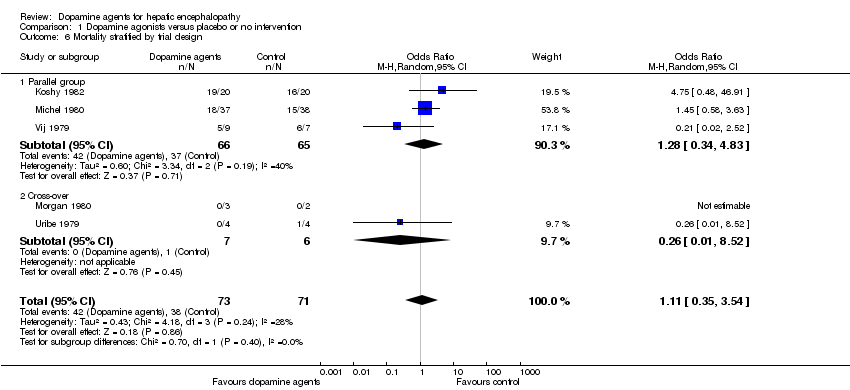
Comparison 1 Dopamine agonists versus placebo or no intervention, Outcome 6 Mortality stratified by trial design.

Comparison 1 Dopamine agonists versus placebo or no intervention, Outcome 7 Hepatic encephalopathy.

Comparison 1 Dopamine agonists versus placebo or no intervention, Outcome 8 Hepatic encephalopathy paired data.

Comparison 1 Dopamine agonists versus placebo or no intervention, Outcome 9 Adverse events paired data.
| Dopamine agonists versus placebo or no intervention for hepatic encephalopathy | ||||||
| Patient or population: patients with hepatic encephalopathy. | ||||||
| Outcomes | Illustrative comparative risks* (95% CI) | Relative effect | No of participants | Quality of the evidence | Comments | |
| Assumed risk | Corresponding risk | |||||
| Control (placebo or no intervention) | Dopamine agonists | |||||
| Mortality | Study population | OR 1.11 | 144 | ⊕⊕⊝⊝ | ||
| 535 per 1000 | 561 per 1000 | |||||
| Moderate | ||||||
| 395 per 1000 | 420 per 1000 | |||||
| Hepatic encephalopathy | Study population | OR 2.99 | 80 | ⊕⊕⊝⊝ | ||
| 350 per 1000 | 617 per 1000 | |||||
| Moderate | ||||||
| 184 per 1000 | 403 per 1000 | |||||
| *The basis for the assumed risk (e.g. the median control group risk across studies) is provided in footnotes. The corresponding risk (and its 95% confidence interval) is based on the assumed risk in the comparison group and the relative effect of the intervention (and its 95% CI). | ||||||
| GRADE Working Group grades of evidence. | ||||||
| 1The randomisation methods were classed as adequate in two trials, and three trials were double‐blind. | ||||||
| Outcome or subgroup title | No. of studies | No. of participants | Statistical method | Effect size |
| 1 Mortality Show forest plot | 5 | 144 | Odds Ratio (M‐H, Random, 95% CI) | 1.11 [0.35, 3.54] |
| 2 Mortality stratified by type of hepatic encephalopathy Show forest plot | 5 | 144 | Odds Ratio (M‐H, Random, 95% CI) | 1.11 [0.35, 3.54] |
| 2.1 Acute episode of hepatic encephalopathy | 3 | 131 | Odds Ratio (M‐H, Random, 95% CI) | 1.28 [0.34, 4.83] |
| 2.2 Chronic hepatic encephalopathy | 2 | 13 | Odds Ratio (M‐H, Random, 95% CI) | 0.26 [0.01, 8.52] |
| 3 Mortality stratified by liver disease Show forest plot | 5 | 144 | Odds Ratio (M‐H, Random, 95% CI) | 1.11 [0.35, 3.54] |
| 3.1 Fulminant liver failure | 2 | 56 | Odds Ratio (M‐H, Random, 95% CI) | 1.04 [0.05, 22.17] |
| 3.2 Cirrhosis | 3 | 88 | Odds Ratio (M‐H, Random, 95% CI) | 1.30 [0.54, 3.15] |
| 4 Mortality stratified by intervention Show forest plot | 5 | 144 | Odds Ratio (M‐H, Random, 95% CI) | 1.11 [0.35, 3.54] |
| 4.1 Levodopa | 3 | 131 | Odds Ratio (M‐H, Random, 95% CI) | 1.28 [0.34, 4.83] |
| 4.2 Bromocriptine | 2 | 13 | Odds Ratio (M‐H, Random, 95% CI) | 0.26 [0.01, 8.52] |
| 5 Mortality stratified by bias risk Show forest plot | 5 | 144 | Odds Ratio (M‐H, Fixed, 95% CI) | 1.24 [0.59, 2.59] |
| 5.1 Low bias risk | 2 | 13 | Odds Ratio (M‐H, Fixed, 95% CI) | 0.26 [0.01, 8.52] |
| 5.2 Unclear bias risk | 3 | 131 | Odds Ratio (M‐H, Fixed, 95% CI) | 1.36 [0.63, 2.91] |
| 6 Mortality stratified by trial design Show forest plot | 5 | 144 | Odds Ratio (M‐H, Random, 95% CI) | 1.11 [0.35, 3.54] |
| 6.1 Parallel group | 3 | 131 | Odds Ratio (M‐H, Random, 95% CI) | 1.28 [0.34, 4.83] |
| 6.2 Cross‐over | 2 | 13 | Odds Ratio (M‐H, Random, 95% CI) | 0.26 [0.01, 8.52] |
| 7 Hepatic encephalopathy Show forest plot | 2 | 80 | Odds Ratio (M‐H, Random, 95% CI) | 2.99 [0.09, 100.55] |
| 8 Hepatic encephalopathy paired data Show forest plot | 3 | Odds Ratio (Random, 95% CI) | 0.68 [0.17, 2.67] | |
| 9 Adverse events paired data Show forest plot | 2 | OR (Random, 95% CI) | 2.12 [‐0.99, 5.24] | |