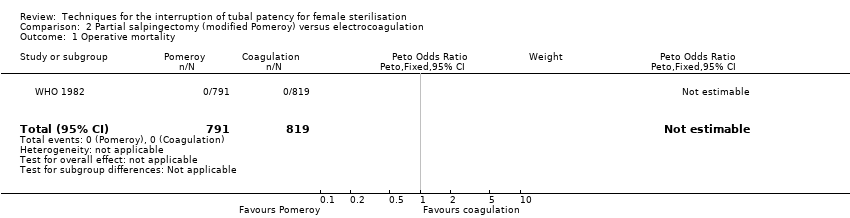
| 1 Operative mortality Show forest plot | 1 | | Peto Odds Ratio (Peto, Fixed, 95% CI) | Subtotals only |
|
| 1.1 Uchida vs silver clip | 1 | 2198 | Peto Odds Ratio (Peto, Fixed, 95% CI) | 0.0 [0.0, 0.0] |
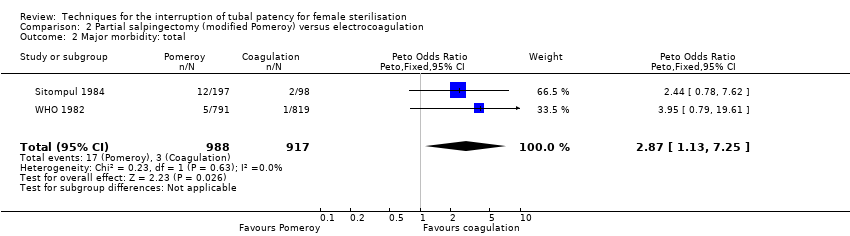
| 2 Major morbidity: total Show forest plot | 1 | 2198 | Peto Odds Ratio (Peto, Fixed, 95% CI) | 0.0 [0.0, 0.0] |
|
| 2.1 Uchida vs silver clip | 1 | 2198 | Peto Odds Ratio (Peto, Fixed, 95% CI) | 0.0 [0.0, 0.0] |
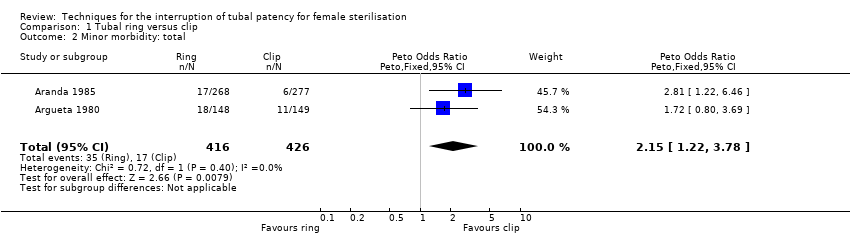
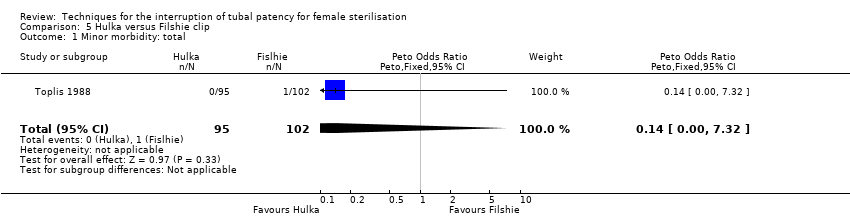
| 3 Minor morbidity: total Show forest plot | 1 | 193 | Peto Odds Ratio (Peto, Fixed, 95% CI) | 7.39 [0.46, 119.01] |
|
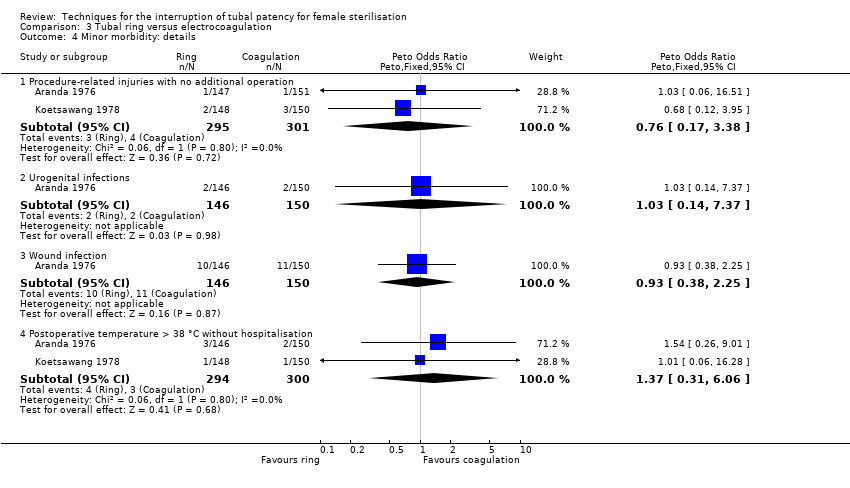
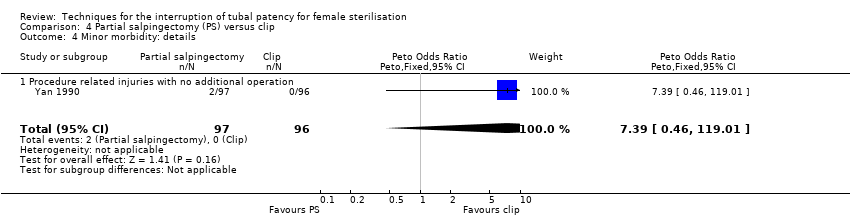
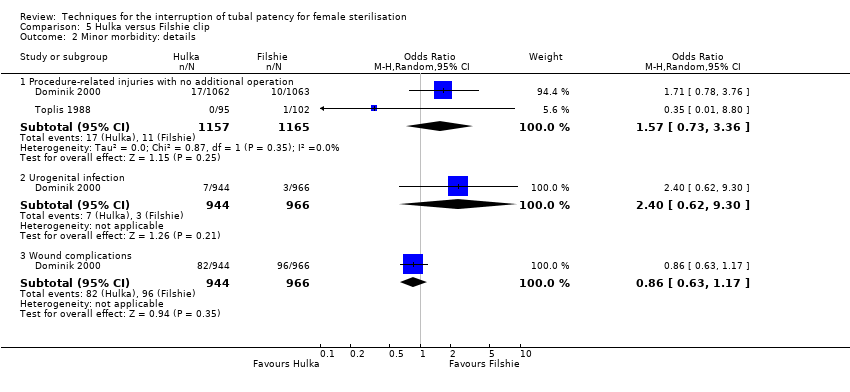
| 4 Minor morbidity: details Show forest plot | 1 | 193 | Peto Odds Ratio (Peto, Fixed, 95% CI) | 7.39 [0.46, 119.01] |
|
| 4.1 Procedure related injuries with no additional operation | 1 | 193 | Peto Odds Ratio (Peto, Fixed, 95% CI) | 7.39 [0.46, 119.01] |
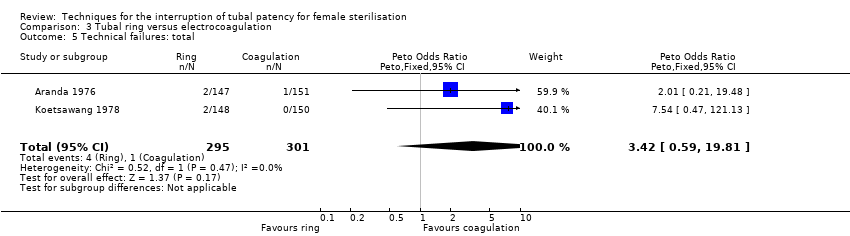
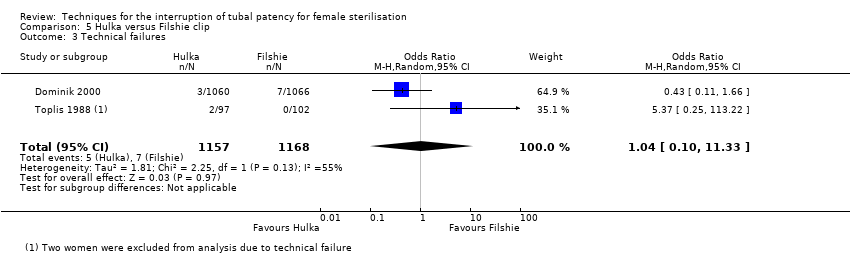
| 5 Technical failures Show forest plot | 1 | | Peto Odds Ratio (Peto, Fixed, 95% CI) | Subtotals only |
|
| 5.1 Uchida vs silver clip | 1 | 2198 | Peto Odds Ratio (Peto, Fixed, 95% CI) | 0.18 [0.08, 0.40] |
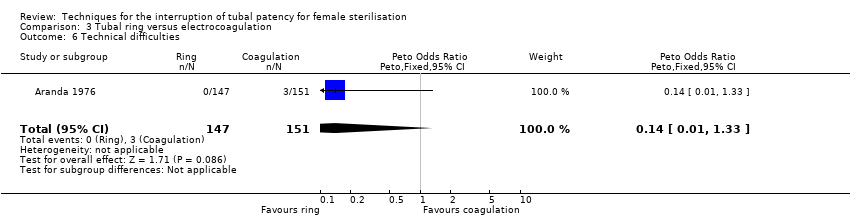
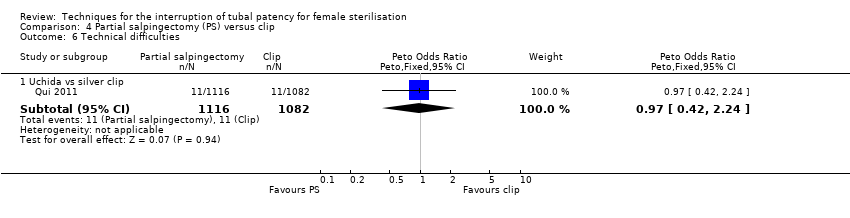
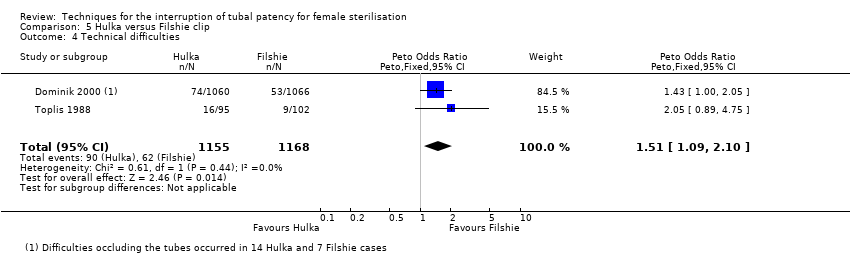
| 6 Technical difficulties Show forest plot | 1 | | Peto Odds Ratio (Peto, Fixed, 95% CI) | Subtotals only |
|
| 6.1 Uchida vs silver clip | 1 | 2198 | Peto Odds Ratio (Peto, Fixed, 95% CI) | 0.97 [0.42, 2.24] |
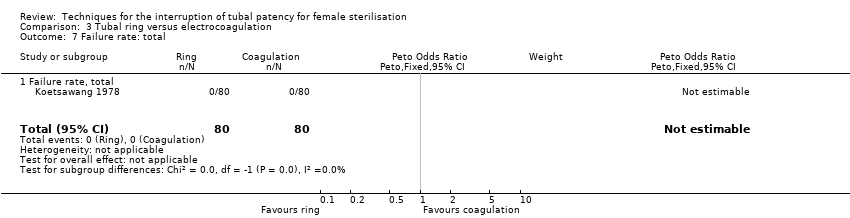
| 7 Failure rate (12 months) : total Show forest plot | 2 | 3537 | Odds Ratio (M‐H, Random, 95% CI) | 0.21 [0.05, 0.84] |
|
| 7.1 Pomeroy vs Filshie | 1 | 1400 | Odds Ratio (M‐H, Random, 95% CI) | 0.22 [0.05, 1.02] |
| 7.2 Uchida vs silver clip | 1 | 2137 | Odds Ratio (M‐H, Random, 95% CI) | 0.19 [0.01, 3.95] |
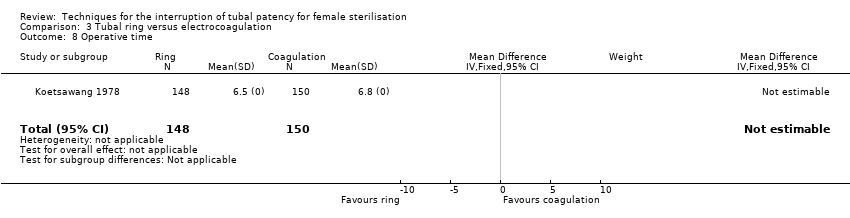
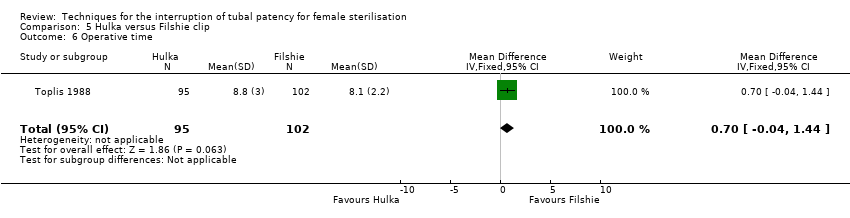
| 8 Operative time Show forest plot | 2 | 2223 | Mean Difference (IV, Fixed, 95% CI) | 4.26 [3.65, 4.86] |
|
| 8.1 Pomeroy vs Filshie | 1 | 25 | Mean Difference (IV, Fixed, 95% CI) | 6.70 [0.77, 12.63] |
| 8.2 Uchida vs silver clip | 1 | 2198 | Mean Difference (IV, Fixed, 95% CI) | 4.23 [3.62, 4.84] |
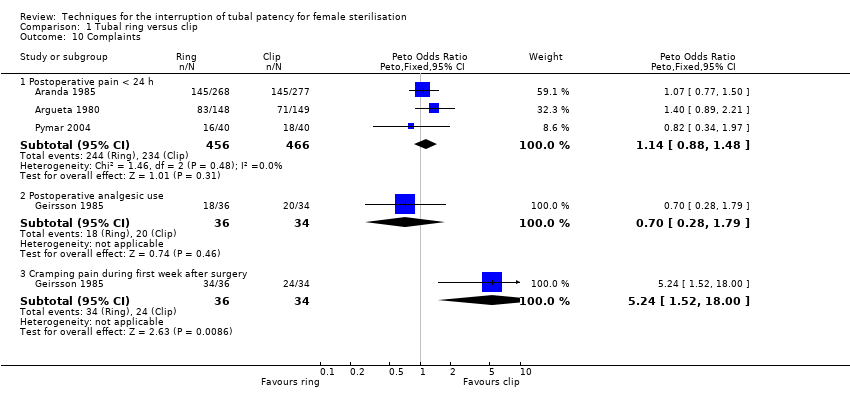
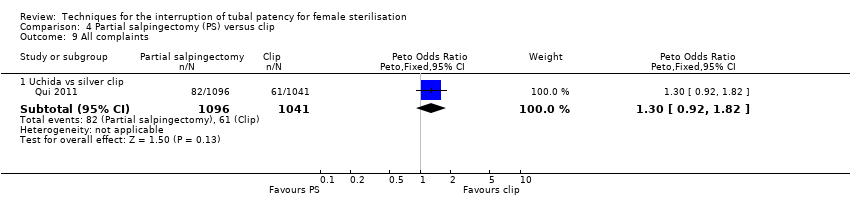
| 9 All complaints Show forest plot | 1 | | Peto Odds Ratio (Peto, Fixed, 95% CI) | Subtotals only |
|
| 9.1 Uchida vs silver clip | 1 | 2137 | Peto Odds Ratio (Peto, Fixed, 95% CI) | 1.30 [0.92, 1.82] |
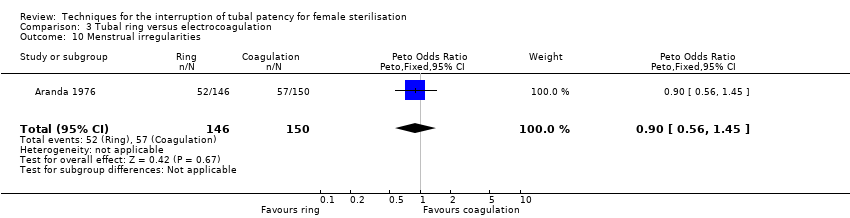
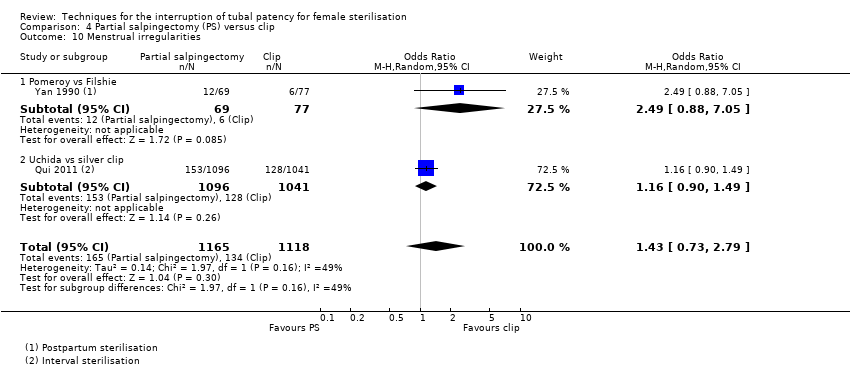
| 10 Menstrual irregularities Show forest plot | 2 | 2283 | Odds Ratio (M‐H, Random, 95% CI) | 1.43 [0.73, 2.79] |
|
| 10.1 Pomeroy vs Filshie | 1 | 146 | Odds Ratio (M‐H, Random, 95% CI) | 2.49 [0.88, 7.05] |
| 10.2 Uchida vs silver clip | 1 | 2137 | Odds Ratio (M‐H, Random, 95% CI) | 1.16 [0.90, 1.49] |
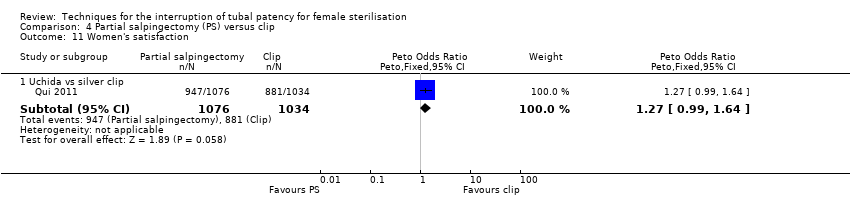
| 11 Women's satisfaction Show forest plot | 1 | | Peto Odds Ratio (Peto, Fixed, 95% CI) | Subtotals only |
|
| 11.1 Uchida vs silver clip | 1 | 2110 | Peto Odds Ratio (Peto, Fixed, 95% CI) | 1.27 [0.99, 1.64] |
| 12 Surgeon's satisfaction Show forest plot | | | Other data | No numeric data |
|