بررسی روشهای بستن لولههای رحمی در عقیمسازی زنان
Referencias
منابع مطالعات واردشده در این مرور
منابع مطالعات خارجشده از این مرور
منابع اضافی
منابع دیگر نسخههای منتشرشده این مرور
Characteristics of studies
Characteristics of included studies [ordered by study ID]
Ir a:
| Methods | Randomisation not specified. Concealment of allocation by sealed envelopes containing a card that specified the technique for tubal occlusion | |
| Participants | 299 women requesting sterilisation for family planning reasons, at least 6 weeks postpartum | |
| Interventions | Electrocoagulation versus tubal ring, all laparoscopy. All under local anaesthesia and intravenous sedation | |
| Outcomes | Surgical and early postoperative complications and complaints | |
| Notes | Blinding of postoperative evaluation | |
| Risk of bias | ||
| Bias | Authors' judgement | Support for judgement |
| Random sequence generation (selection bias) | Unclear risk | "randomly assigned" |
| Allocation concealment (selection bias) | Unclear risk | Concealment of allocation by sealed envelopes containing a card which specified the technique of tubal occlusion. Assessed as a 'B' study (unclear allocation concealment) in original review |
| Blinding (performance bias and detection bias) | Low risk | Outcome assessor was blinded |
| Incomplete outcome data (attrition bias) | Unclear risk | ‐ |
| Selective reporting (reporting bias) | Unclear risk | Unable to determine |
| Other bias | Low risk | Women had similar socio‐demographic characteristics |
| Methods | Multicenter study. Randomisation by computer‐generated labels. Concealment of allocation by sealed opaque envelopes. Not stated whether sequentially numbered | |
| Participants | 663 women requesting sterilisation to limit family size and free of major systemic and pelvic abnormalities. Interval (55%) and postspontaneous abortion (45%). Conducted in San Jose, San Salvador and Cairo | |
| Interventions | Tubal ring versus Rocket clip via minilaparotomy. Under general anaesthesia (55%) or local anaesthesia and intravenous sedation | |
| Outcomes | Major and minor morbidity, technical failures and difficulties, failure rates and complaints | |
| Notes | Blinding of postoperative evaluation. About 90% of women in both groups remained hospitalised for at least 1 night. The operations were performed with general anaesthesia in 55% of cases and with analgesia and/or sedation plus local anaesthesia in 45% of procedures | |
| Risk of bias | ||
| Bias | Authors' judgement | Support for judgement |
| Random sequence generation (selection bias) | Low risk | Randomisation by computer‐generated labels |
| Allocation concealment (selection bias) | Unclear risk | Concealment of allocation by sealed opaque envelopes. Not stated if sequentially numbered. Assessed as a 'B' study (unclear allocation concealment) in original review |
| Blinding (performance bias and detection bias) | Low risk | Blinding of postoperative evaluation |
| Incomplete outcome data (attrition bias) | High risk | 30 cases of technical failure (5% of total) were excluded from the analyses |
| Selective reporting (reporting bias) | Unclear risk | ‐ |
| Other bias | Unclear risk | ‐ |
| Methods | RCT | |
| Participants | 299 women requesting sterilisation at the Asociacion Demografica Salvadorena, San Salvador | |
| Interventions | Spring‐loaded clip versus tubal ring all laparoscopy. All under local anaesthesia and intravenous sedation | |
| Outcomes | Operative morbidity, technical failures and difficulties, failure rates, complaints | |
| Notes | Participant and postoperative evaluation blinding 1 surgeon performed all surgical procedures on an outpatient basis | |
| Risk of bias | ||
| Bias | Authors' judgement | Support for judgement |
| Random sequence generation (selection bias) | Unclear risk | Method of randomisation not specified |
| Allocation concealment (selection bias) | Unclear risk | Assessed as a 'B' study (unclear allocation concealment) in original review |
| Blinding (performance bias and detection bias) | Low risk | Participants and postoperative evaluators were blinded |
| Incomplete outcome data (attrition bias) | Unclear risk | In the clip group 54 women (36%) and 60 (40%) in the ring group were lost to follow‐up at 24 months |
| Selective reporting (reporting bias) | Unclear risk | Unable to determine |
| Other bias | Low risk | Women had similar socio‐demographic characteristics |
| Methods | 2 multicentre RCTs conducted by Family Health International in Malaysia, Panama, Dominican Republic, Mexico, Venezuela, Guatamala, Haiti. 1 RCT involved a minilaparotomy approach, the other involved a laparoscopic approach | |
| Participants | 2126 women were included if they were at least 21 years old, had no pregnancy within 42 days, and no chronic medical conditions 878 participants were enrolled in the minilap study and 1248 enrolled in the laparoscopy study | |
| Interventions | Filshie clip (1066 women) vs Hulka clip (1060 women) | |
| Outcomes | Failure rates, technical failure and difficulties, morbidity Assessed at 1, 6, and 12 months after sterilisation. A subset of women were assessed at 24 months | |
| Notes | Article reports the combined results of 2 RCTs, 1 of sterilisation via minilaparotomy, the other by laparoscopy Surgeons were experienced. Cumulative failure rates were 11.7 for Filshie and 28.1 per 1000 for Hulka at 24 months | |
| Risk of bias | ||
| Bias | Authors' judgement | Support for judgement |
| Random sequence generation (selection bias) | Low risk | "computer‐generated randomisation scheme" |
| Allocation concealment (selection bias) | Low risk | Sealed sequentially numbered opaque envelope opened at the time of surgery |
| Blinding (performance bias and detection bias) | Low risk | Outcome assessor was blinded |
| Incomplete outcome data (attrition bias) | High risk | Loss to follow‐up at 12 months was high (31% and 34% for the laparoscopy and minilaparotomy studies, respectively) but balanced across the groups. Loss to follow‐up at 24 months in a subset of participants was 43%. Protocol deviations were low |
| Selective reporting (reporting bias) | Unclear risk | Not able to determine. ITT and per protocol analyses performed |
| Other bias | Low risk | Baseline characteristics were similar. Mean age was 31 years and average parity was 4.2 children |
| Methods | RCT conducted in Scotland | |
| Participants | 79 women requesting sterilisation; excluded if postpartum or postabortion | |
| Interventions | Falope rings (36 women) vs Filshie clips (34 women) | |
| Outcomes | Day 1‐6 postoperative pain, analgesic requirements, additional medical assistance | |
| Notes | Interval sterilisation via laparoscopy | |
| Risk of bias | ||
| Bias | Authors' judgement | Support for judgement |
| Random sequence generation (selection bias) | Unclear risk | "a prospective randomized comparison" |
| Allocation concealment (selection bias) | Unclear risk | Not described |
| Blinding (performance bias and detection bias) | Unclear risk | Not described |
| Incomplete outcome data (attrition bias) | High risk | 9 post‐procedure exclusions due to intra‐operative difficulties, subsequent UTI, incomplete follow‐up and anaesthetic complications. Protocol deviations and ITT analysis not described |
| Selective reporting (reporting bias) | Unclear risk | Unable to determine |
| Other bias | High risk | Post‐randomisation exclusions of women with complications occurred in this study of morbidity |
| Methods | RCT | |
| Participants | 118 women requesting sterilisation | |
| Interventions | 62 Hulka clips and 56 electrocautery | |
| Outcomes | Urinary and serum oestradiol and progesterone levels; participants' satisfaction and regret | |
| Notes | Secondary outcomes relating to women’s satisfaction/regret have never been published. The authors were contacted and provided some additional information regarding method of randomisation/allocation concealment but were unable to find the unpublished data regarding women's satisfaction. Included but no pertinent outcome data available Anaesthesia not specified | |
| Risk of bias | ||
| Bias | Authors' judgement | Support for judgement |
| Random sequence generation (selection bias) | Low risk | Random number table |
| Allocation concealment (selection bias) | Low risk | Consecutively numbered sealed opaque envelopes (unpublished information) |
| Blinding (performance bias and detection bias) | Low risk | Participants blinded throughout the 2‐year follow‐up (unpublished information) |
| Incomplete outcome data (attrition bias) | Unclear risk | Not able to determine |
| Selective reporting (reporting bias) | Unclear risk | Secondary outcomes were never reported |
| Other bias | Unclear risk | Not able to determine |
| Methods | RCT | |
| Participants | 88 women Inclusion criteria: regular menses, no risk of ovarian failure in personal or family history, ovarian reserve on transvaginal ultrasound (TVU) in normal range Exclusion criteria: perimenopausal symptoms, abnormal BMI, ovarian cysts > 25 mm on TVU, pelvic surgery in previous year | |
| Interventions | Laparoscopic interval sterilisation via electrocoagulation or mechanical clips | |
| Outcomes | Post‐operative 10th month mean values of ovarian reserve i.e. serum FSH, LH, estradiol, inhibin‐B, antimullerian hormone. Total ovarian volume and anthral follicle count on TVU | |
| Notes | General anaesthesia used No review outcomes reported, therefore this study contributed no data to the review | |
| Risk of bias | ||
| Bias | Authors' judgement | Support for judgement |
| Random sequence generation (selection bias) | Low risk | Random number table |
| Allocation concealment (selection bias) | Unclear risk | Not described |
| Blinding (performance bias and detection bias) | Unclear risk | Not described |
| Incomplete outcome data (attrition bias) | Unclear risk | No information on loss to follow‐up or postrandomisation exclusions |
| Selective reporting (reporting bias) | Unclear risk | Not able to determine |
| Other bias | Unclear risk | Not able to determine |
| Methods | Did not specify method of randomisation | |
| Participants | 300 women requesting sterilisation for family planning purposes at the Siriraj Hospital in Bangkok | |
| Interventions | Unipolar electrocoagulation versus tubal ring via laparoscopy. All performed under local anaesthesia and intravenous sedation | |
| Outcomes | Operative morbidity, technical failures and difficulties, failure rates, operative time, complaints | |
| Notes | Postoperative evaluation blinding, prophylactic antibiotics for 5 days | |
| Risk of bias | ||
| Bias | Authors' judgement | Support for judgement |
| Random sequence generation (selection bias) | Unclear risk | Not specified |
| Allocation concealment (selection bias) | Unclear risk | Assessed as a 'B' study (unclear allocation concealment) in original review |
| Blinding (performance bias and detection bias) | Low risk | Outcome assessor was blinded |
| Other bias | Low risk | The 2 groups had similar socio‐economic characteristics |
| Methods | RCT pilot study of postpartum sterilisation techniques. Computer‐generated randomisation; sealed opaque envelope opened immediately before sterilisation | |
| Participants | 32 pregnant patients requesting sterilisation after vaginal delivery (25) or Caesarean section (4). Inclusion criteria: ≥ 21 years | |
| Interventions | 14 Filshie clip vs 15 Pomeroy method | |
| Outcomes | Time from skin incision to closure, technical difficulties, surgeon's satisfaction, surgeon's preference (7/10 preferred Filshie to Pomeroy) | |
| Notes | Baseline characteristics similar in the 2 groups. 2/32 study questionnaires lost = missing data (1 in each group). 1 post‐randomisation exclusion from the Filshie group as the woman had had a previous failed Filshie sterilisation and so Pomeroy was performed when surgeon saw old clips ‐ no other details provided General or spinal anaesthesia used | |
| Risk of bias | ||
| Bias | Authors' judgement | Support for judgement |
| Random sequence generation (selection bias) | Low risk | Computer‐generated randomisation |
| Allocation concealment (selection bias) | Low risk | Sealed opaque envelope opened immediately before sterilisation |
| Blinding (performance bias and detection bias) | Unclear risk | Not described |
| Incomplete outcome data (attrition bias) | Unclear risk | ‐ |
| Selective reporting (reporting bias) | Unclear risk | ‐ |
| Other bias | Unclear risk | Baseline characteristics similar in the 2 groups |
| Methods | RCT. Women received a Filshie clip on 1 fallopian tube and a ring on the opposite side; site allocation was randomized. Randomisation (via random number table) was performed following laparoscopic abdominal examination after excluding adhesions, endometriosis and pelvic masses. Allocation concealment by sequentially numbered sealed opaque envelopes. Group assignment determined the device that would be applied first and the side to which the first occlusion method would be placed. The subject was blind to her group, as were the monitoring and research staff | |
| Participants | 40 women in Pittsburg, USA, requesting sterilisation Inclusion criteria: > 21years, literate and with telephone access Exclusion criteria: allergy to local anaesthetic, morbid obesity > 100 kg, > 2 previous laparotomies, history of moderate to severe endometriosis, pelvic mass, current chronic pelvic pain, use of pain medications for any indication regularly during the past 2 weeks, history of depression or anxiety or other psychiatric disorder, allergy/intolerance to analgesics, plan for open laparoscopic procedure, previous tubal surgery, in‐operative discovery of dense adhesions, endometriosis or pelvic mass that required concurrent surgery | |
| Interventions | Sterilisation with Filshie clip and fallopian ring on opposite fallopian tubes following topical bupivicaine application to the tubes (abdominal entry via laparoscopy) | |
| Outcomes | Postoperative pain in first 24 h by visual analogue scale at 1 h, 2 h and 24 h | |
| Notes | Rationale behind design was that women are apparently able to discriminate pain on each side of their abdomen after tubal occlusion (Kaplan 1990). ITT analysis; no significant difference in results when reported major (8) and minor (9); deviations from protocol were excluded | |
| Risk of bias | ||
| Bias | Authors' judgement | Support for judgement |
| Random sequence generation (selection bias) | Low risk | Random number table |
| Allocation concealment (selection bias) | Low risk | Allocation concealment was by sequentially numbered sealed opaque envelopes |
| Blinding (performance bias and detection bias) | Low risk | Participants were blinded to group allocation, as were the monitoring and research staff |
| Incomplete outcome data (attrition bias) | Unclear risk | Minimal loss to follow‐up. 8 women had major deviations from protocol and 17 women had minor deviations from protocol. Results were reported according to ITT |
| Selective reporting (reporting bias) | Unclear risk | Unable to determine |
| Other bias | Unclear risk | None noted |
| Methods | Multicentre RCT conducted in 20 clinics in China between June 2007 and August 2008 | |
| Participants | 2198 women requiring sterilisation Inclusion criteria: 20‐40 years old, at least 2 children, married Exclusion criteria: history of major abdominal surgery, epilepsy, neurosis, chronic pelvic inflammatory disease, acute infectious disease, body temperature > 37.5 °C, noted to have severe adhesions in previous operations | |
| Interventions | 1116 women sterilised via Uchida technique 1082 via silver clips | |
| Outcomes | Pregnancy rates, morbidity, operative time, satisfaction Follow‐up at 1 week, 3, 6, 12 months following sterilisation | |
| Notes | Mostly interval sterilisation but < 2% were performed postabortion. Approximately 63% were performed in lactating women in whom menses had not resumed Operations were performed under local anaesthetic and women were monitored for 2‐4 h after the operation Surgical duration was significantly longer and amount of bleeding (classified as small, moderate or large amount) was greater in the Uchida arm | |
| Risk of bias | ||
| Bias | Authors' judgement | Support for judgement |
| Random sequence generation (selection bias) | Unclear risk | "participants were randomly assigned" |
| Allocation concealment (selection bias) | Unclear risk | "this information was placed in an envelope and delivered to the surgeon" |
| Blinding (performance bias and detection bias) | Unclear risk | Blinding of assessors was not described Possibly high risk of performance bias for personnel |
| Incomplete outcome data (attrition bias) | Unclear risk | 61 lost to follow‐up altogether with 20 lost in Uchida group and 41 lost in the clip group |
| Selective reporting (reporting bias) | Unclear risk | Did not report morbidity or postoperative/persistent pain. However, reported 'chief complaints' which were not significantly different between the study arms. Also, investigators only included data from women who attended all 3 follow‐up visits |
| Other bias | Unclear risk | Unable to determine. Baseline characteristics were similar |
| Methods | Multicentre RCT conducted by Family Health International in Thailand, Taiwan, Panama and the Phillipines with recruitment from April 1984 to June 1989 | |
| Participants | 1400 postpartum women Inclusion criteria: able to consent, within 42 days postpartum, ≥ 21 years old, normal physical and pelvic examination Exclusion criteria: incapable of consenting, severe pre‐exisiting systemic disease, profound anaemia, anticipated concurrent surgery, limited accessibility for follow‐up, caesarean section | |
| Interventions | Sterilisation within 72 h of delivery by: Titanium clip (Filshie; 698 women) or partial salpingectomy (Pomeroy; 702 women) All procedures were by infra‐umbilical mini‐laparotomy incision of 1 cm‐2 cm in length | |
| Outcomes | Failure rate. Follow‐up at 1, 6, 12, and 24 months following sterilisation | |
| Notes | Loss to follow‐up was 51% at end of study. Method of anaesthesia was "local, epidural or spinal at the surgeon's discretion" Cumulative failure rates at one year were reported as 11 per 1000 for Filshie versus 2 per 1000 for partial salpingectomy; at two years, cumulative failure rates in this study were reported as 17 per 1000 versus 4 per 1000, respectively | |
| Risk of bias | ||
| Bias | Authors' judgement | Support for judgement |
| Random sequence generation (selection bias) | Low risk | "computer‐generated code" |
| Allocation concealment (selection bias) | Low risk | "assignment was performed immediately before surgery after consent using an off‐site computer‐generated code that was unavailable to study staff" |
| Blinding (performance bias and detection bias) | Low risk | "the investigator in charge of follow‐up was" blinded to the procedure |
| Incomplete outcome data (attrition bias) | High risk | High attrition at 6 months with approximately 30% lost to follow‐up; at 1 year approximately 42% were lost to follow‐up, and at 2 years 51% were lost to follow‐up. 348 women were present in each group at the end of the study. 13 technical failures and random allocation errors occurred (but these did not result in pregnancy) ‐ it is not clear in which study groups these occurred |
| Selective reporting (reporting bias) | High risk | Only the primary outcome was reported |
| Other bias | Unclear risk | Unable to determine but "demographic variables were comparable between groups at baseline" |
| Methods | RCT conducted in the USA with recruitment between July 1999 and June 2001 | |
| Participants | 109 women requesting sterilisation. Inclusion/exclusion criteria not stated | |
| Interventions | Salpingectomy after bipolar coagulation (55 women) versus Pomeroy partial salpingectomy (54 women) | |
| Outcomes | Pain at 6 h and 14 days postoperatively | |
| Notes | Sterilisation via micro‐laparoscopy. Timing not clear, but probably interval sterilisation Third‐year residents performed the procedure | |
| Risk of bias | ||
| Bias | Authors' judgement | Support for judgement |
| Random sequence generation (selection bias) | Low risk | "computer‐generated randomisation code" |
| Allocation concealment (selection bias) | Low risk | "Technique assignment was written on a card placed in the sealed opaque envelope"; the "next consecutively numbered envelope" was allocated |
| Blinding (performance bias and detection bias) | Unclear risk | Not described |
| Incomplete outcome data (attrition bias) | Unclear risk | Numbers analyzed/loss to follow‐up not described |
| Selective reporting (reporting bias) | Unclear risk | Not able to determine |
| Other bias | Unclear risk | Coagulation group was heavier than ligation group (180 vs 160 pounds) and had had more previous abdominal operations (12 vs 8) |
| Methods | Not specified method of randomisation | |
| Participants | 300 women requesting sterilisation at the University Hospital in Medan, Indonesia | |
| Interventions | Modified Pomeroy technique (via minilaparotomy or culdoscopy) versus electrocoagulation (via laparoscopy). All under local anaesthesia and 10 mg intravenous valium | |
| Outcomes | Operative time, hospitalisation, postoperative complications, failure rates | |
| Notes | Interval sterilisation | |
| Risk of bias | ||
| Bias | Authors' judgement | Support for judgement |
| Random sequence generation (selection bias) | Unclear risk | Not described |
| Allocation concealment (selection bias) | Unclear risk | Not described |
| Blinding (performance bias and detection bias) | Unclear risk | Not described |
| Incomplete outcome data (attrition bias) | Unclear risk | 5 women were excluded after randomisation (3 Pomeroy, 2 electrocoagulation) |
| Selective reporting (reporting bias) | Unclear risk | Unable to determine |
| Other bias | Unclear risk | Unable to determine |
| Methods | Multicentre RCT conducted by FHI from 1984 to 1990 in centres in Panama, Peru, Kenya, Brazil, Mexico, Indonesia, Thailand and the Dominican Republic | |
| Participants | 2746 women requiring interval sterilisation Inclusion criteria: at least 21 years old, legally able to consent, normal physical and pelvic examination Exclusion criteria: pregnant within last 42 days, pre‐existing chronic disease, no conconmitant surgical procedures needed except curettage | |
| Interventions | Titanium clip (Filshie;1381 women) or tubal ring (1365 women) Randomisation was in 2 groups: 1) access via minilaparotomy (5 centres) 482 Filshie, 453 ring; 2) access via laparoscopy (7 centres) 919 Filshie, 912 ring | |
| Outcomes | Pregnancy, adverse events, hospital admissions, further surgery Follow‐up conducted at 1, 6, and 12 months following sterilisation. A 24‐month follow‐up "was planned for a subset" of women | |
| Notes | Report combined data from 2 studies, one utilising a minilapraotomy approach, the other utilising laparoscopy. 'Experienced surgeons' performed the procedures There were more tubal injuries in the ring group (e.g. tubal transections, haematomas) and also more surgical difficulties and failures Filshie clip expulsions occurred at 10, 30 and 34 months after sterilisation in 3 women | |
| Risk of bias | ||
| Bias | Authors' judgement | Support for judgement |
| Random sequence generation (selection bias) | Low risk | "computer‐generated randomisation scheme" |
| Allocation concealment (selection bias) | Low risk | "sealed, sequentially numbered opaque envelope" provided by FHI |
| Blinding (performance bias and detection bias) | Low risk | Outcome assessors were blinded |
| Incomplete outcome data (attrition bias) | Low risk | Loss to follow‐up was relatively low, approximately 7% (low) for the early follow‐up visit and 18% at 12 months. 30 and 41 protocol violations of inclusion/exclusion criteria in Filshi and tubal ring groups respectively. Characteristics of women lost to follow‐up were similar in both groups |
| Selective reporting (reporting bias) | Unclear risk | Reported treated population data mainly (i.e. not ITT data) |
| Other bias | Unclear risk | One centre used its own randomisation schedule and randomized 68 women (34 to each group), therefore assignment was not according to FHI randomisation schedule |
| Methods | Randomisation by computer‐generated schedule | |
| Participants | 365 women at the University of Tennessee, Memphis | |
| Interventions | Spring‐loaded clip (Hulka‐Clemens) versus tubal ring (Falope ring). All procedures via laparoscopy | |
| Outcomes | Failure rates | |
| Notes | All procedures performed by third‐year residents. Urine hCG within 72 h before procedure. Methylene‐blue test with no spillage recorded | |
| Risk of bias | ||
| Bias | Authors' judgement | Support for judgement |
| Random sequence generation (selection bias) | Low risk | Computer‐generated schedule |
| Allocation concealment (selection bias) | Unclear risk | Not described |
| Blinding (performance bias and detection bias) | Unclear risk | Not described |
| Incomplete outcome data (attrition bias) | Unclear risk | No post‐randomisation exclusion or losses to follow‐up were reported |
| Selective reporting (reporting bias) | Unclear risk | Unable to determine |
| Other bias | Unclear risk | Both groups had similar socio‐demographic characteristics |
| Methods | Randomisation not specified. Concealment of allocation by envelope opened immediately before operation | |
| Participants | 200 non pregnant women at the Churchill Hospital, Oxford | |
| Interventions | Spring‐loaded clip (Hulka‐Clemens) versus Filshie clip (titanium clip) via laparoscopy | |
| Outcomes | Operative morbidity, operative time, complaints | |
| Notes | Interval sterilisation Authors as the only surgeons | |
| Risk of bias | ||
| Bias | Authors' judgement | Support for judgement |
| Random sequence generation (selection bias) | Unclear risk | Not described |
| Allocation concealment (selection bias) | Low risk | Concealment of allocation by envelope opened immediately before operation |
| Blinding (performance bias and detection bias) | Unclear risk | Not described |
| Incomplete outcome data (attrition bias) | Unclear risk | Two women from the Hulka clip group were excluded from the study because of technical failure |
| Selective reporting (reporting bias) | Unclear risk | Unable to determine |
| Other bias | Unclear risk | Unable to determine. Women in the Filshie group were slightly heavier than those in the Hulka clip group |
| Methods | Multicenter, multinational randomized study. Randomisation centrally generated by WHO. Concealment of allocation by sealed, sequentially numbered opaque envelopes | |
| Participants | 1827 healthy women with at least one child and eligible for both interventions. Exclusion criteria: pelvic pathologies, history of previous PID or peritonitis, scar below the umbilicus or any condition which would increase the risk of any surgical procedure | |
| Interventions | Modified Pomeroy method via minilaparotomy versus electrocoagulation via laparoscopy | |
| Outcomes | Major and minor morbidity, technical failures, postoperative complaints | |
| Notes | Interval sterilisation Anaesthesia standardised within individual centres according to routine practice in the institution. In the 3 high‐income country centres (London, Los Angeles, Sydney) all operations were performed under general anaesthesia, whereas in 2 middle‐ or low‐income country centres (Bangkok, Seoul) local anaesthesia was used for both procedures. In Havana and Singapore all women in the electrocoagulation group received general anaesthesia and most Pomeroy procedures were done under spinal/epidural anaesthesia. In Santiago all Pomeroy procedures were performed under spinal anaesthesia, and all electrocoagulation procedures under local anaesthesia. All centres used sedatives for pre‐medication were used | |
| Risk of bias | ||
| Bias | Authors' judgement | Support for judgement |
| Random sequence generation (selection bias) | Low risk | Randomisation generated centrally by WHO |
| Allocation concealment (selection bias) | Low risk | Concealment of allocation by sealed, sequentially numbered opaque envelopes. Assessed as an 'A' study) in original review |
| Blinding (performance bias and detection bias) | Unclear risk | ‐ |
| Incomplete outcome data (attrition bias) | Unclear risk | The post‐randomisation exclusion rate was about 12% (121 women) in the Pomeroy group and about 10% (96 women) in the electrocoagulation group due to protocol violations |
| Selective reporting (reporting bias) | Unclear risk | Unable to determine |
| Other bias | High risk | There were important differences in baseline characteristics mainly due to 1 centre (Bangkok) where women in the electrocoagulation group were older, had more living children and had been married longer. Also, women in the Pomeroy group were lighter and had a lower ponderal index, mainly due to the contribution of 2 centres (Bangkok and Havana).These differences were statistically significant for the Bangkok centre |
| Methods | Randomisation not specified. Concealment of allocation by sealed preprinted labels | |
| Participants | 200 women postpartum at the Tri‐Service General Hospital, Taipei, Taiwan | |
| Interventions | Pomeroy method versus Filshie clip, all via subumbilical minilaparotomy. 88% under epidural anaesthesia and the remainder under local anaesthesia | |
| Outcomes | Complications, menstrual irregularities, failure rates | |
| Notes | Postpartum sterilisation with 24 month follow‐up. Pregnancy rates at 24 months were 1/70 and 0/78 in the PS and clip arms, respectively. Blinding of postoperative evaluation. All procedures were performed by one of the authors This trial is a subset of the Rodriguez 2013 report but includes more outcomes | |
| Risk of bias | ||
| Bias | Authors' judgement | Support for judgement |
| Random sequence generation (selection bias) | Unclear risk | Not described |
| Allocation concealment (selection bias) | Low risk | Concealment of allocation by sealed preprinted labels |
| Blinding (performance bias and detection bias) | Low risk | Outcome assessor blinded. |
| Selective reporting (reporting bias) | Unclear risk | Unable to determine |
| Other bias | Low risk | Selected socio‐demographic characteristics (age, total live births and previous contraceptive use) were found to be similar between groups |
Abbreviations
BMI: body mass index
FSH: follicle‐stimulating hormone
h: hour(s)
hCG: human chorionic gonadotropin
ITT: intention‐to‐treat analysis
LH: lutenising hormone
PID: pelvic inflammatory disease
RCT: randomized controlled trial
TVU: transvaginal ultrasound
UTI: urinary tract infection
WHO: World Health Organization
Characteristics of excluded studies [ordered by study ID]
Ir a:
| Study | Reason for exclusion |
| RCT (uncertain whether quasi‐randomised) of post‐tubal sterilisation hormone levels following Pomeroy or Uchida techniques 17/38 completed the protocol and only 17 were included in analyses | |
| Quasi‐RCT with about 40% postrandomisation exclusions | |
| RCT of methods of access (vaginoscopy vs hysteroscopy) for hysteroscopic sterilisation (Essure), not of techniques for interrupting tubal patency | |
| Not an RCT | |
| Women were 'randomized' (no details provided) before surgery to Hulka clips or modified Pomeroy technique, but at the time of surgery, those found to have tubal disease underwent sterilisation with standard modified Pomeroy technique and were then analyzed in that group | |
| An RCT of chromotubation vs no chromotubation to confirm poststerilisation tubal occlusion. Although women were apparently also randomized to the sterilisation method (tubal ring, electrocautery, or Hulka clips), comparisons of these methods were not the objective of the study and outcomes and losses to follow‐up were not described separately for each method | |
| ITT analysis was not performed. 1 participant from the clip group was changed to the electrocoagulation group due to a technical problem and was included in the latter for the further analysis | |
| Quasi‐RCT | |
| Quasi‐RCT. The groups were divided into equal numbers of women. In addition, a fourth group was taken as a control group | |
| Quasi‐RCT. The groups were divided into equal numbers of women |
Abbreviations
ITT: intention‐to‐treat analysis
RCT: randomized controlled trial
Data and analyses
| Outcome or subgroup title | No. of studies | No. of participants | Statistical method | Effect size |
| 1 Major morbidity: total Show forest plot | 1 | Peto Odds Ratio (Peto, Fixed, 95% CI) | Subtotals only | |
| Analysis 1.1  Comparison 1 Tubal ring versus clip, Outcome 1 Major morbidity: total. | ||||
| 1.1 Procedure‐related injuries requiring additional operation or blood transfusion | 1 | 545 | Peto Odds Ratio (Peto, Fixed, 95% CI) | 0.14 [0.00, 7.05] |
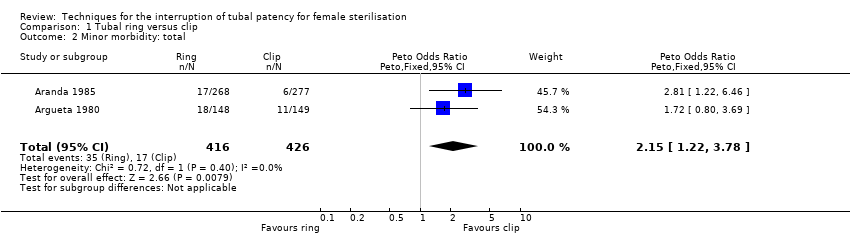
| 2 Minor morbidity: total Show forest plot | 2 | 842 | Peto Odds Ratio (Peto, Fixed, 95% CI) | 2.15 [1.22, 3.78] |
| Analysis 1.2  Comparison 1 Tubal ring versus clip, Outcome 2 Minor morbidity: total. | ||||
| 3 Minor morbidity: details Show forest plot | 3 | Peto Odds Ratio (Peto, Fixed, 95% CI) | Subtotals only | |
| Analysis 1.3 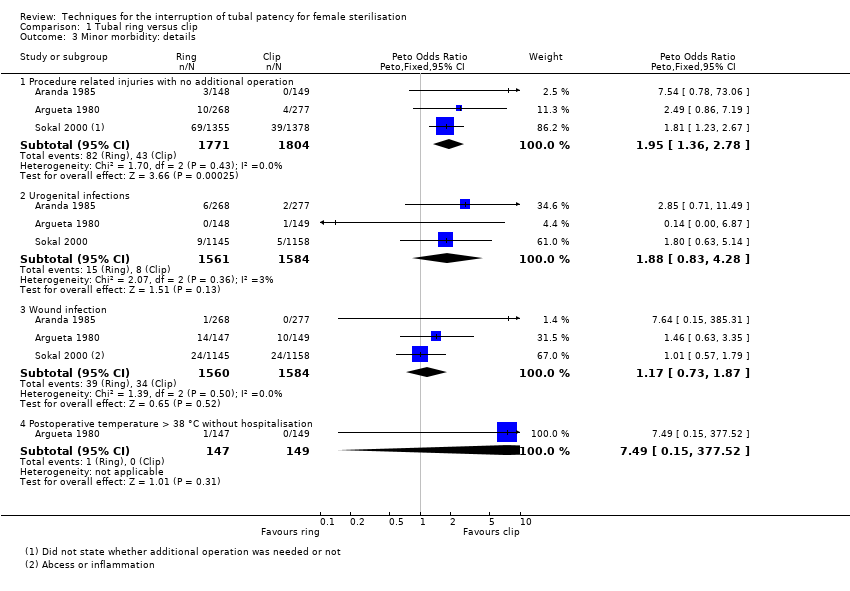 Comparison 1 Tubal ring versus clip, Outcome 3 Minor morbidity: details. | ||||
| 3.1 Procedure related injuries with no additional operation | 3 | 3575 | Peto Odds Ratio (Peto, Fixed, 95% CI) | 1.95 [1.36, 2.78] |
| 3.2 Urogenital infections | 3 | 3145 | Peto Odds Ratio (Peto, Fixed, 95% CI) | 1.88 [0.83, 4.28] |
| 3.3 Wound infection | 3 | 3144 | Peto Odds Ratio (Peto, Fixed, 95% CI) | 1.17 [0.73, 1.87] |
| 3.4 Postoperative temperature > 38 °C without hospitalisation | 1 | 296 | Peto Odds Ratio (Peto, Fixed, 95% CI) | 7.49 [0.15, 377.52] |
| 4 Technical failures Show forest plot | 3 | 3476 | Peto Odds Ratio (Peto, Fixed, 95% CI) | 3.93 [2.43, 6.35] |
| Analysis 1.4  Comparison 1 Tubal ring versus clip, Outcome 4 Technical failures. | ||||
| 5 Technical difficulties Show forest plot | 3 | 3590 | Peto Odds Ratio (Peto, Fixed, 95% CI) | 1.13 [0.87, 1.46] |
| Analysis 1.5  Comparison 1 Tubal ring versus clip, Outcome 5 Technical difficulties. | ||||
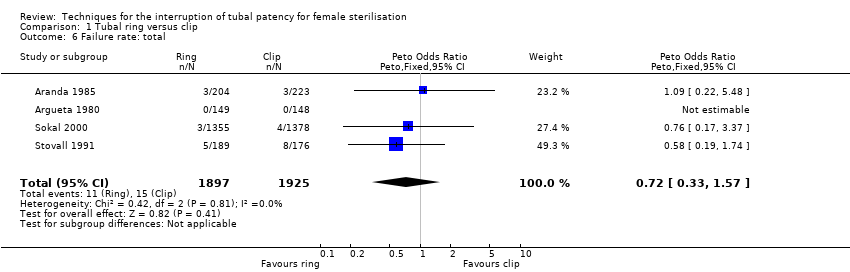
| 6 Failure rate: total Show forest plot | 4 | 3822 | Peto Odds Ratio (Peto, Fixed, 95% CI) | 0.72 [0.33, 1.57] |
| Analysis 1.6  Comparison 1 Tubal ring versus clip, Outcome 6 Failure rate: total. | ||||
| 7 Failure rate: details Show forest plot | 2 | Peto Odds Ratio (Peto, Fixed, 95% CI) | Subtotals only | |
| Analysis 1.7  Comparison 1 Tubal ring versus clip, Outcome 7 Failure rate: details. | ||||
| 7.1 Failure rate ≤ 1 year, total | 2 | 2629 | Peto Odds Ratio (Peto, Fixed, 95% CI) | 0.85 [0.23, 3.14] |
| 7.2 Failure rate ≤ 1 year, extrauterine pregnancy | 1 | 2202 | Peto Odds Ratio (Peto, Fixed, 95% CI) | 0.0 [0.0, 0.0] |
| 7.3 Failure rate > 1 year, extrauterine pregnancy | 1 | 427 | Peto Odds Ratio (Peto, Fixed, 95% CI) | 8.11 [0.16, 410.33] |
| 8 Operative time Show forest plot | 1 | 297 | Mean Difference (IV, Fixed, 95% CI) | 0.0 [0.0, 0.0] |
| Analysis 1.8 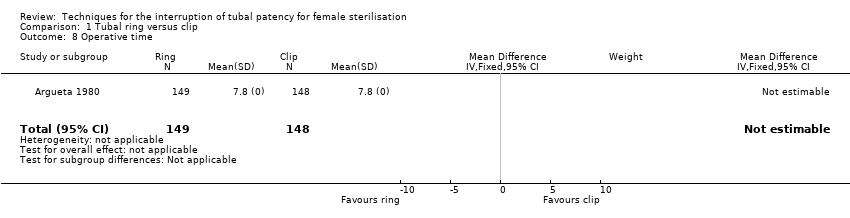 Comparison 1 Tubal ring versus clip, Outcome 8 Operative time. | ||||
| 9 Hospital stay > 24 h Show forest plot | 1 | Odds Ratio (M‐H, Fixed, 95% CI) | Totals not selected | |
| Analysis 1.9  Comparison 1 Tubal ring versus clip, Outcome 9 Hospital stay > 24 h. | ||||
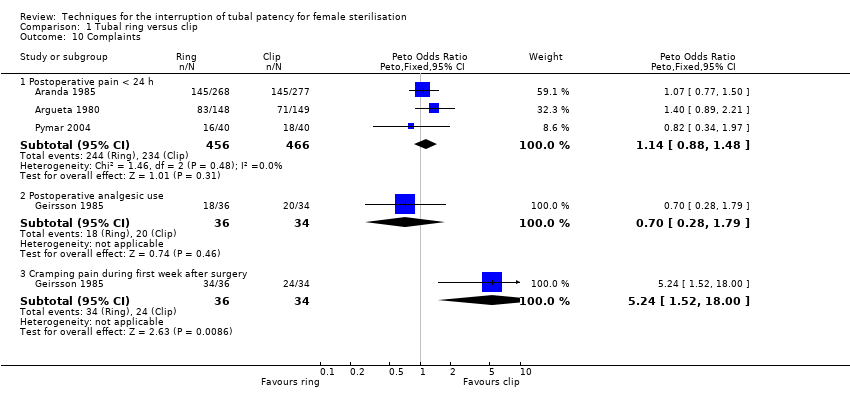
| 10 Complaints Show forest plot | 4 | Peto Odds Ratio (Peto, Fixed, 95% CI) | Subtotals only | |
| Analysis 1.10  Comparison 1 Tubal ring versus clip, Outcome 10 Complaints. | ||||
| 10.1 Postoperative pain < 24 h | 3 | 922 | Peto Odds Ratio (Peto, Fixed, 95% CI) | 1.14 [0.88, 1.48] |
| 10.2 Postoperative analgesic use | 1 | 70 | Peto Odds Ratio (Peto, Fixed, 95% CI) | 0.70 [0.28, 1.79] |
| 10.3 Cramping pain during first week after surgery | 1 | 70 | Peto Odds Ratio (Peto, Fixed, 95% CI) | 5.24 [1.52, 18.00] |
| 11 Menstrual irregularities Show forest plot | 2 | 612 | Peto Odds Ratio (Peto, Fixed, 95% CI) | 1.61 [0.75, 3.49] |
| Analysis 1.11  Comparison 1 Tubal ring versus clip, Outcome 11 Menstrual irregularities. | ||||
| Outcome or subgroup title | No. of studies | No. of participants | Statistical method | Effect size |
| 1 Operative mortality Show forest plot | 1 | 1610 | Peto Odds Ratio (Peto, Fixed, 95% CI) | 0.0 [0.0, 0.0] |
| Analysis 2.1  Comparison 2 Partial salpingectomy (modified Pomeroy) versus electrocoagulation, Outcome 1 Operative mortality. | ||||
| 2 Major morbidity: total Show forest plot | 2 | 1905 | Peto Odds Ratio (Peto, Fixed, 95% CI) | 2.87 [1.13, 7.25] |
| Analysis 2.2 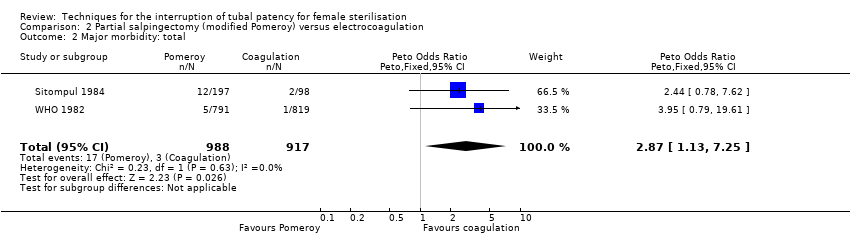 Comparison 2 Partial salpingectomy (modified Pomeroy) versus electrocoagulation, Outcome 2 Major morbidity: total. | ||||
| 3 Major morbidity: details Show forest plot | 2 | Odds Ratio (M‐H, Random, 95% CI) | Subtotals only | |
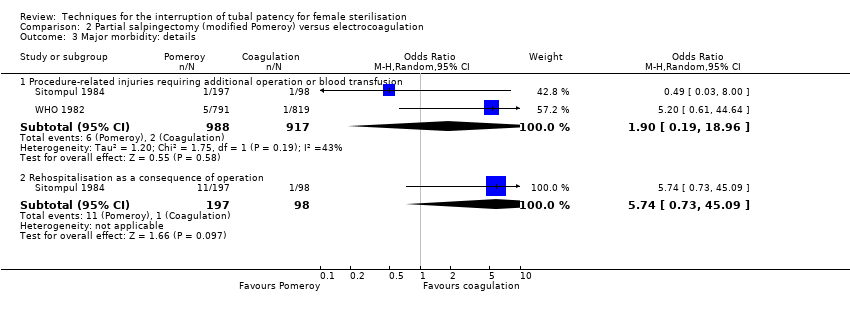
| Analysis 2.3  Comparison 2 Partial salpingectomy (modified Pomeroy) versus electrocoagulation, Outcome 3 Major morbidity: details. | ||||
| 3.1 Procedure‐related injuries requiring additional operation or blood transfusion | 2 | 1905 | Odds Ratio (M‐H, Random, 95% CI) | 1.90 [0.19, 18.96] |
| 3.2 Rehospitalisation as a consequence of operation | 1 | 295 | Odds Ratio (M‐H, Random, 95% CI) | 5.74 [0.73, 45.09] |
| 4 Minor morbidity: total Show forest plot | 2 | 1905 | Peto Odds Ratio (Peto, Fixed, 95% CI) | 1.60 [1.10, 2.33] |
| Analysis 2.4 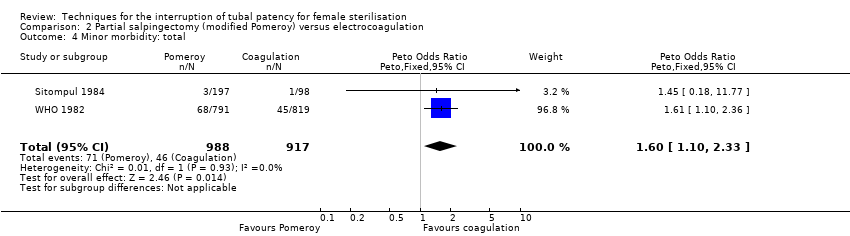 Comparison 2 Partial salpingectomy (modified Pomeroy) versus electrocoagulation, Outcome 4 Minor morbidity: total. | ||||
| 5 Minor morbidity: details Show forest plot | 2 | Peto Odds Ratio (Peto, Fixed, 95% CI) | Subtotals only | |
| Analysis 2.5  Comparison 2 Partial salpingectomy (modified Pomeroy) versus electrocoagulation, Outcome 5 Minor morbidity: details. | ||||
| 5.1 Procedure‐related injuries with no additional operation | 1 | 1610 | Peto Odds Ratio (Peto, Fixed, 95% CI) | 0.53 [0.06, 5.11] |
| 5.2 Urogenital infections | 1 | 1610 | Peto Odds Ratio (Peto, Fixed, 95% CI) | 0.81 [0.43, 1.50] |
| 5.3 Wound infection | 1 | 1610 | Peto Odds Ratio (Peto, Fixed, 95% CI) | 2.49 [1.54, 4.04] |
| 5.4 Postoperative temperature > 38 °C without hospitalisation | 1 | 295 | Peto Odds Ratio (Peto, Fixed, 95% CI) | 1.45 [0.18, 11.77] |
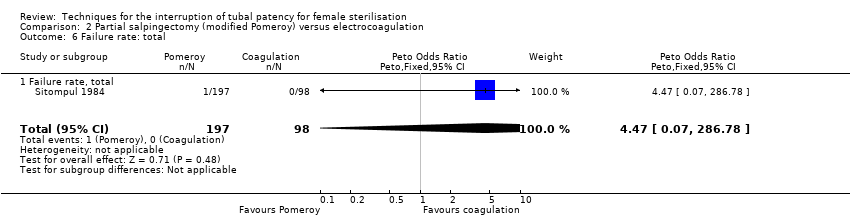
| 6 Failure rate: total Show forest plot | 1 | 295 | Peto Odds Ratio (Peto, Fixed, 95% CI) | 4.47 [0.07, 286.78] |
| Analysis 2.6  Comparison 2 Partial salpingectomy (modified Pomeroy) versus electrocoagulation, Outcome 6 Failure rate: total. | ||||
| 6.1 Failure rate, total | 1 | 295 | Peto Odds Ratio (Peto, Fixed, 95% CI) | 4.47 [0.07, 286.78] |
| 7 Failure rate: details Show forest plot | 1 | 295 | Peto Odds Ratio (Peto, Fixed, 95% CI) | 4.47 [0.07, 286.78] |
| Analysis 2.7 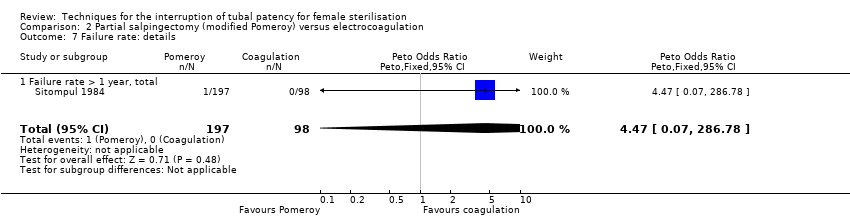 Comparison 2 Partial salpingectomy (modified Pomeroy) versus electrocoagulation, Outcome 7 Failure rate: details. | ||||
| 7.1 Failure rate > 1 year, total | 1 | 295 | Peto Odds Ratio (Peto, Fixed, 95% CI) | 4.47 [0.07, 286.78] |
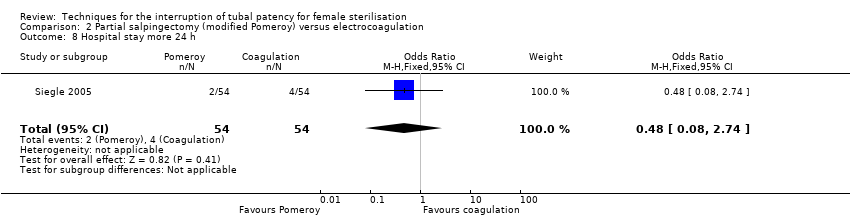
| 8 Hospital stay more 24 h Show forest plot | 1 | 108 | Odds Ratio (M‐H, Fixed, 95% CI) | 0.48 [0.08, 2.74] |
| Analysis 2.8  Comparison 2 Partial salpingectomy (modified Pomeroy) versus electrocoagulation, Outcome 8 Hospital stay more 24 h. | ||||
| 9 Complaints Show forest plot | 3 | Peto Odds Ratio (Peto, Fixed, 95% CI) | Subtotals only | |
| Analysis 2.9 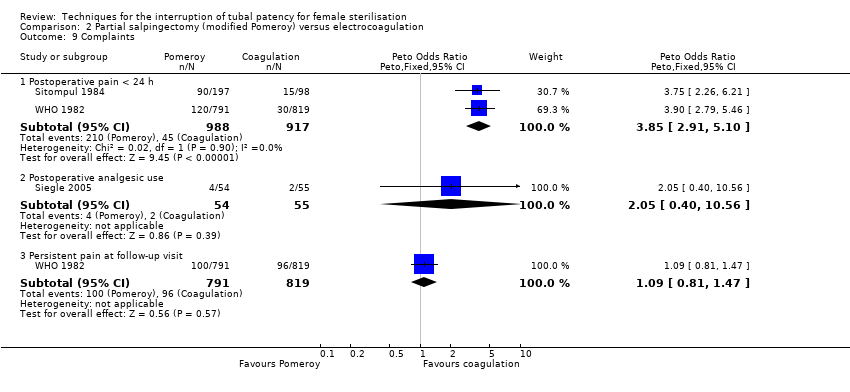 Comparison 2 Partial salpingectomy (modified Pomeroy) versus electrocoagulation, Outcome 9 Complaints. | ||||
| 9.1 Postoperative pain < 24 h | 2 | 1905 | Peto Odds Ratio (Peto, Fixed, 95% CI) | 3.85 [2.91, 5.10] |
| 9.2 Postoperative analgesic use | 1 | 109 | Peto Odds Ratio (Peto, Fixed, 95% CI) | 2.05 [0.40, 10.56] |
| 9.3 Persistent pain at follow‐up visit | 1 | 1610 | Peto Odds Ratio (Peto, Fixed, 95% CI) | 1.09 [0.81, 1.47] |
| Outcome or subgroup title | No. of studies | No. of participants | Statistical method | Effect size |
| 1 Major morbidity: total Show forest plot | 2 | 596 | Peto Odds Ratio (Peto, Fixed, 95% CI) | 0.14 [0.00, 7.01] |
| Analysis 3.1 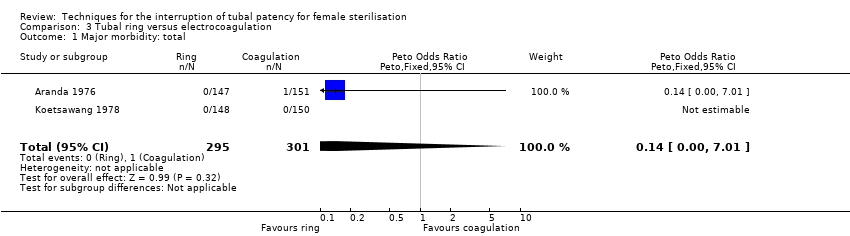 Comparison 3 Tubal ring versus electrocoagulation, Outcome 1 Major morbidity: total. | ||||
| 2 Major morbidity: details Show forest plot | 1 | 298 | Peto Odds Ratio (Peto, Fixed, 95% CI) | 0.14 [0.00, 7.01] |
| Analysis 3.2 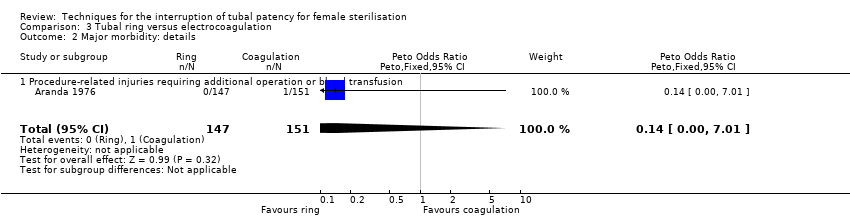 Comparison 3 Tubal ring versus electrocoagulation, Outcome 2 Major morbidity: details. | ||||
| 2.1 Procedure‐related injuries requiring additional operation or blood transfusion | 1 | 298 | Peto Odds Ratio (Peto, Fixed, 95% CI) | 0.14 [0.00, 7.01] |
| 3 Minor morbidity: total Show forest plot | 2 | 596 | Peto Odds Ratio (Peto, Fixed, 95% CI) | 0.97 [0.50, 1.87] |
| Analysis 3.3 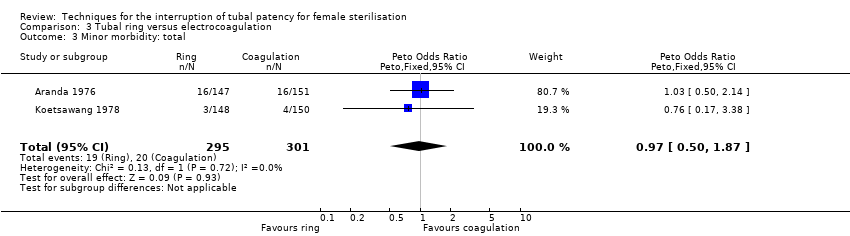 Comparison 3 Tubal ring versus electrocoagulation, Outcome 3 Minor morbidity: total. | ||||
| 4 Minor morbidity: details Show forest plot | 2 | Peto Odds Ratio (Peto, Fixed, 95% CI) | Subtotals only | |
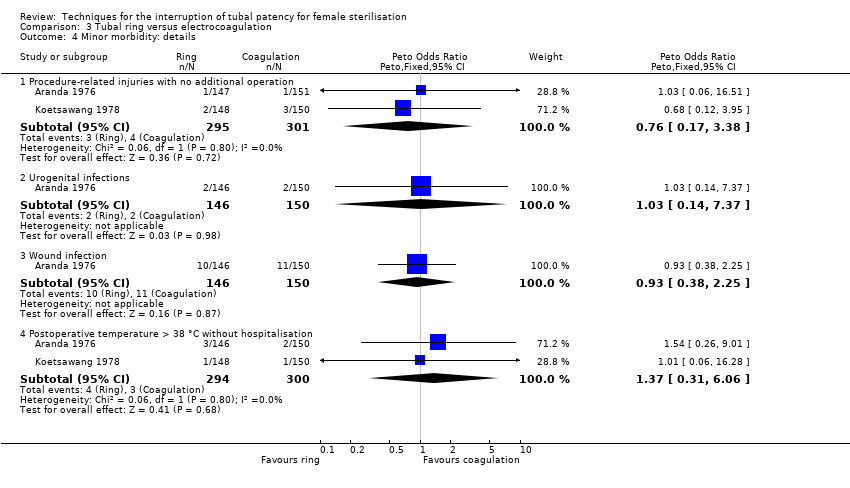
| Analysis 3.4  Comparison 3 Tubal ring versus electrocoagulation, Outcome 4 Minor morbidity: details. | ||||
| 4.1 Procedure‐related injuries with no additional operation | 2 | 596 | Peto Odds Ratio (Peto, Fixed, 95% CI) | 0.76 [0.17, 3.38] |
| 4.2 Urogenital infections | 1 | 296 | Peto Odds Ratio (Peto, Fixed, 95% CI) | 1.03 [0.14, 7.37] |
| 4.3 Wound infection | 1 | 296 | Peto Odds Ratio (Peto, Fixed, 95% CI) | 0.93 [0.38, 2.25] |
| 4.4 Postoperative temperature > 38 °C without hospitalisation | 2 | 594 | Peto Odds Ratio (Peto, Fixed, 95% CI) | 1.37 [0.31, 6.06] |
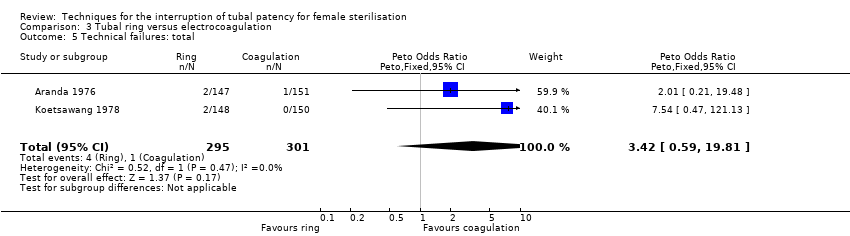
| 5 Technical failures: total Show forest plot | 2 | 596 | Peto Odds Ratio (Peto, Fixed, 95% CI) | 3.42 [0.59, 19.81] |
| Analysis 3.5  Comparison 3 Tubal ring versus electrocoagulation, Outcome 5 Technical failures: total. | ||||
| 6 Technical difficulties Show forest plot | 1 | 298 | Peto Odds Ratio (Peto, Fixed, 95% CI) | 0.14 [0.01, 1.33] |
| Analysis 3.6 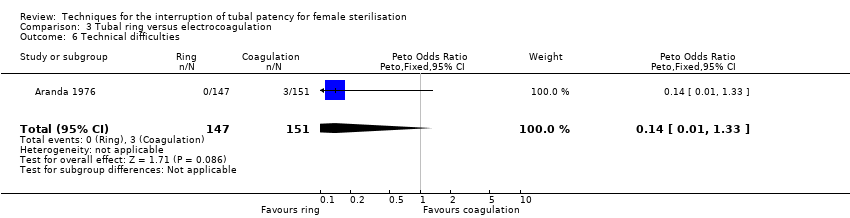 Comparison 3 Tubal ring versus electrocoagulation, Outcome 6 Technical difficulties. | ||||
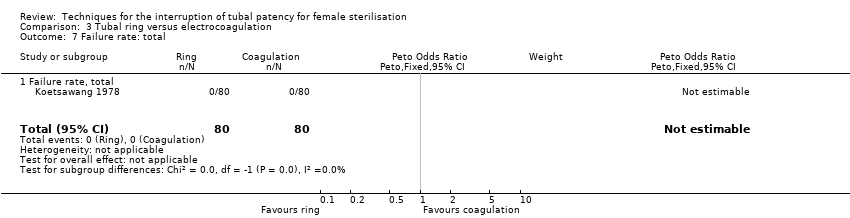
| 7 Failure rate: total Show forest plot | 1 | 160 | Peto Odds Ratio (Peto, Fixed, 95% CI) | 0.0 [0.0, 0.0] |
| Analysis 3.7  Comparison 3 Tubal ring versus electrocoagulation, Outcome 7 Failure rate: total. | ||||
| 7.1 Failure rate, total | 1 | 160 | Peto Odds Ratio (Peto, Fixed, 95% CI) | 0.0 [0.0, 0.0] |
| 8 Operative time Show forest plot | 1 | 298 | Mean Difference (IV, Fixed, 95% CI) | 0.0 [0.0, 0.0] |
| Analysis 3.8 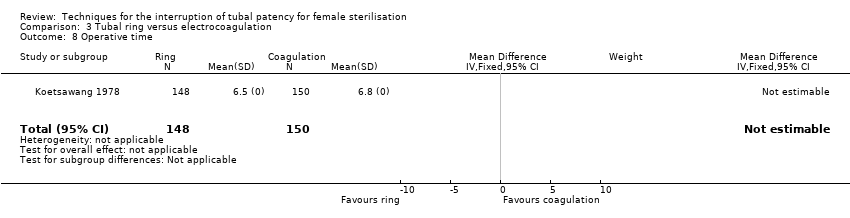 Comparison 3 Tubal ring versus electrocoagulation, Outcome 8 Operative time. | ||||
| 9 Complaints Show forest plot | 2 | Odds Ratio (M‐H, Random, 95% CI) | Subtotals only | |
| Analysis 3.9  Comparison 3 Tubal ring versus electrocoagulation, Outcome 9 Complaints. | ||||
| 9.1 Postoperative pain < 24 h | 2 | 596 | Odds Ratio (M‐H, Random, 95% CI) | 3.40 [1.17, 9.84] |
| 9.2 Postoperative analgesic use | 1 | 298 | Odds Ratio (M‐H, Random, 95% CI) | 2.51 [1.00, 6.30] |
| 9.3 Persistent pain at follow‐up visit | 2 | 594 | Odds Ratio (M‐H, Random, 95% CI) | 1.22 [0.75, 1.97] |
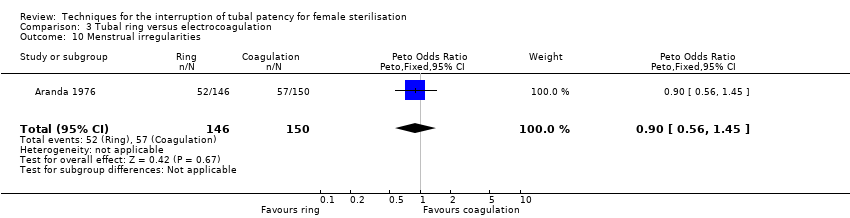
| 10 Menstrual irregularities Show forest plot | 1 | 296 | Peto Odds Ratio (Peto, Fixed, 95% CI) | 0.90 [0.56, 1.45] |
| Analysis 3.10  Comparison 3 Tubal ring versus electrocoagulation, Outcome 10 Menstrual irregularities. | ||||
| Outcome or subgroup title | No. of studies | No. of participants | Statistical method | Effect size | |||||||||
| 1 Operative mortality Show forest plot | 1 | Peto Odds Ratio (Peto, Fixed, 95% CI) | Subtotals only | ||||||||||
| Analysis 4.1  Comparison 4 Partial salpingectomy (PS) versus clip, Outcome 1 Operative mortality. | |||||||||||||
| 1.1 Uchida vs silver clip | 1 | 2198 | Peto Odds Ratio (Peto, Fixed, 95% CI) | 0.0 [0.0, 0.0] | |||||||||
| 2 Major morbidity: total Show forest plot | 1 | 2198 | Peto Odds Ratio (Peto, Fixed, 95% CI) | 0.0 [0.0, 0.0] | |||||||||
| Analysis 4.2 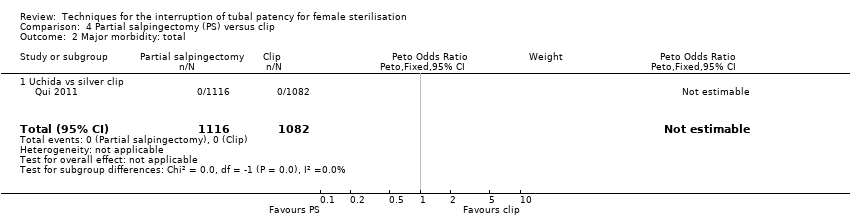 Comparison 4 Partial salpingectomy (PS) versus clip, Outcome 2 Major morbidity: total. | |||||||||||||
| 2.1 Uchida vs silver clip | 1 | 2198 | Peto Odds Ratio (Peto, Fixed, 95% CI) | 0.0 [0.0, 0.0] | |||||||||
| 3 Minor morbidity: total Show forest plot | 1 | 193 | Peto Odds Ratio (Peto, Fixed, 95% CI) | 7.39 [0.46, 119.01] | |||||||||
| Analysis 4.3 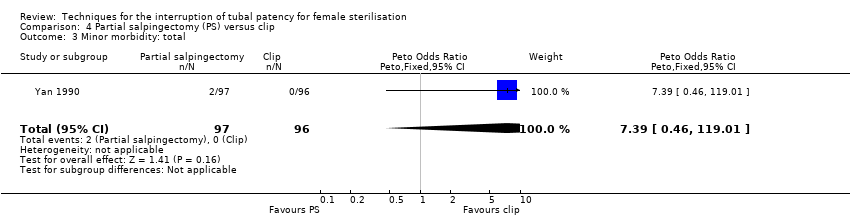 Comparison 4 Partial salpingectomy (PS) versus clip, Outcome 3 Minor morbidity: total. | |||||||||||||
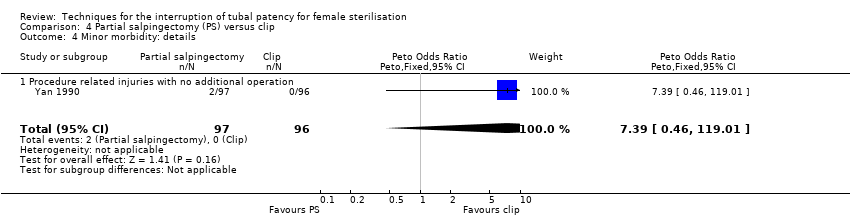
| 4 Minor morbidity: details Show forest plot | 1 | 193 | Peto Odds Ratio (Peto, Fixed, 95% CI) | 7.39 [0.46, 119.01] | |||||||||
| Analysis 4.4  Comparison 4 Partial salpingectomy (PS) versus clip, Outcome 4 Minor morbidity: details. | |||||||||||||
| 4.1 Procedure related injuries with no additional operation | 1 | 193 | Peto Odds Ratio (Peto, Fixed, 95% CI) | 7.39 [0.46, 119.01] | |||||||||
| 5 Technical failures Show forest plot | 1 | Peto Odds Ratio (Peto, Fixed, 95% CI) | Subtotals only | ||||||||||
| Analysis 4.5 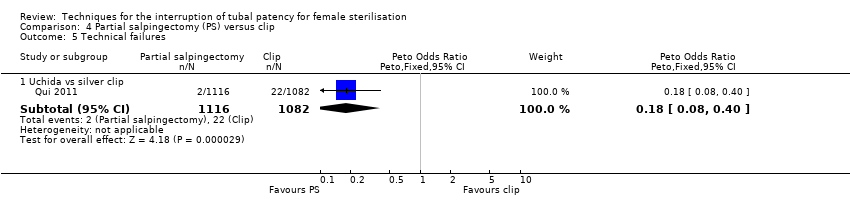 Comparison 4 Partial salpingectomy (PS) versus clip, Outcome 5 Technical failures. | |||||||||||||
| 5.1 Uchida vs silver clip | 1 | 2198 | Peto Odds Ratio (Peto, Fixed, 95% CI) | 0.18 [0.08, 0.40] | |||||||||
| 6 Technical difficulties Show forest plot | 1 | Peto Odds Ratio (Peto, Fixed, 95% CI) | Subtotals only | ||||||||||
| Analysis 4.6  Comparison 4 Partial salpingectomy (PS) versus clip, Outcome 6 Technical difficulties. | |||||||||||||
| 6.1 Uchida vs silver clip | 1 | 2198 | Peto Odds Ratio (Peto, Fixed, 95% CI) | 0.97 [0.42, 2.24] | |||||||||
| 7 Failure rate (12 months) : total Show forest plot | 2 | 3537 | Odds Ratio (M‐H, Random, 95% CI) | 0.21 [0.05, 0.84] | |||||||||
| Analysis 4.7 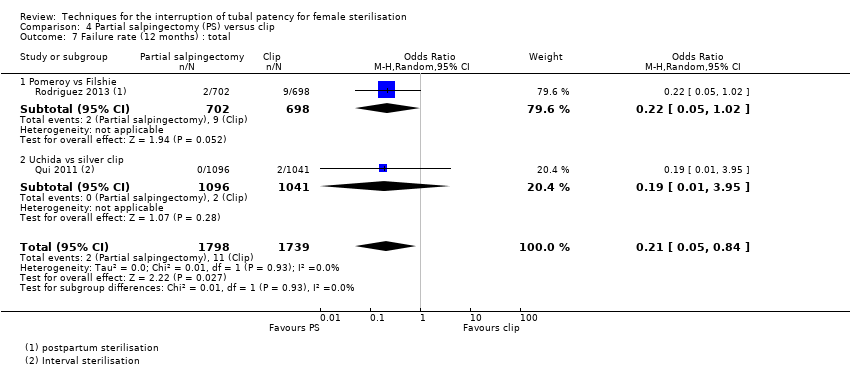 Comparison 4 Partial salpingectomy (PS) versus clip, Outcome 7 Failure rate (12 months) : total. | |||||||||||||
| 7.1 Pomeroy vs Filshie | 1 | 1400 | Odds Ratio (M‐H, Random, 95% CI) | 0.22 [0.05, 1.02] | |||||||||
| 7.2 Uchida vs silver clip | 1 | 2137 | Odds Ratio (M‐H, Random, 95% CI) | 0.19 [0.01, 3.95] | |||||||||
| 8 Operative time Show forest plot | 2 | 2223 | Mean Difference (IV, Fixed, 95% CI) | 4.26 [3.65, 4.86] | |||||||||
| Analysis 4.8 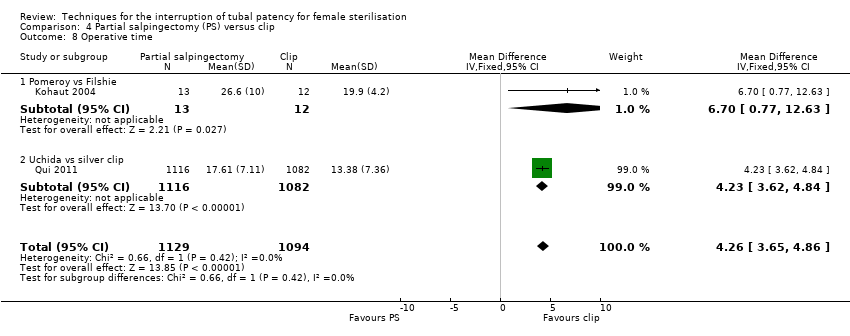 Comparison 4 Partial salpingectomy (PS) versus clip, Outcome 8 Operative time. | |||||||||||||
| 8.1 Pomeroy vs Filshie | 1 | 25 | Mean Difference (IV, Fixed, 95% CI) | 6.70 [0.77, 12.63] | |||||||||
| 8.2 Uchida vs silver clip | 1 | 2198 | Mean Difference (IV, Fixed, 95% CI) | 4.23 [3.62, 4.84] | |||||||||
| 9 All complaints Show forest plot | 1 | Peto Odds Ratio (Peto, Fixed, 95% CI) | Subtotals only | ||||||||||
| Analysis 4.9  Comparison 4 Partial salpingectomy (PS) versus clip, Outcome 9 All complaints. | |||||||||||||
| 9.1 Uchida vs silver clip | 1 | 2137 | Peto Odds Ratio (Peto, Fixed, 95% CI) | 1.30 [0.92, 1.82] | |||||||||
| 10 Menstrual irregularities Show forest plot | 2 | 2283 | Odds Ratio (M‐H, Random, 95% CI) | 1.43 [0.73, 2.79] | |||||||||
| Analysis 4.10  Comparison 4 Partial salpingectomy (PS) versus clip, Outcome 10 Menstrual irregularities. | |||||||||||||
| 10.1 Pomeroy vs Filshie | 1 | 146 | Odds Ratio (M‐H, Random, 95% CI) | 2.49 [0.88, 7.05] | |||||||||
| 10.2 Uchida vs silver clip | 1 | 2137 | Odds Ratio (M‐H, Random, 95% CI) | 1.16 [0.90, 1.49] | |||||||||
| 11 Women's satisfaction Show forest plot | 1 | Peto Odds Ratio (Peto, Fixed, 95% CI) | Subtotals only | ||||||||||
| Analysis 4.11  Comparison 4 Partial salpingectomy (PS) versus clip, Outcome 11 Women's satisfaction. | |||||||||||||
| 11.1 Uchida vs silver clip | 1 | 2110 | Peto Odds Ratio (Peto, Fixed, 95% CI) | 1.27 [0.99, 1.64] | |||||||||
| 12 Surgeon's satisfaction Show forest plot | Other data | No numeric data | |||||||||||
| Analysis 4.12
Comparison 4 Partial salpingectomy (PS) versus clip, Outcome 12 Surgeon's satisfaction. | |||||||||||||
| Outcome or subgroup title | No. of studies | No. of participants | Statistical method | Effect size |
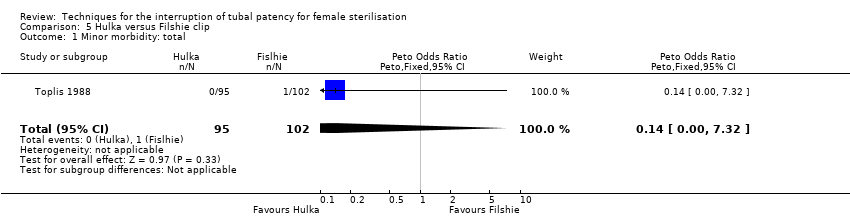
| 1 Minor morbidity: total Show forest plot | 1 | 197 | Peto Odds Ratio (Peto, Fixed, 95% CI) | 0.14 [0.00, 7.32] |
| Analysis 5.1  Comparison 5 Hulka versus Filshie clip, Outcome 1 Minor morbidity: total. | ||||
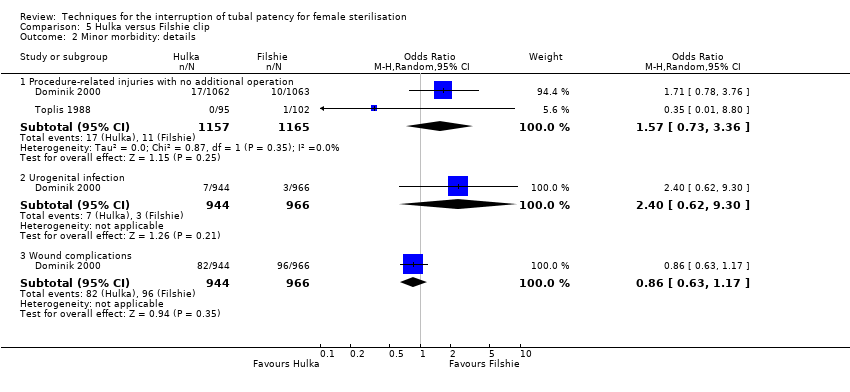
| 2 Minor morbidity: details Show forest plot | 2 | Odds Ratio (M‐H, Random, 95% CI) | Subtotals only | |
| Analysis 5.2  Comparison 5 Hulka versus Filshie clip, Outcome 2 Minor morbidity: details. | ||||
| 2.1 Procedure‐related injuries with no additional operation | 2 | 2322 | Odds Ratio (M‐H, Random, 95% CI) | 1.57 [0.73, 3.36] |
| 2.2 Urogenital infection | 1 | 1910 | Odds Ratio (M‐H, Random, 95% CI) | 2.40 [0.62, 9.30] |
| 2.3 Wound complications | 1 | 1910 | Odds Ratio (M‐H, Random, 95% CI) | 0.86 [0.63, 1.17] |
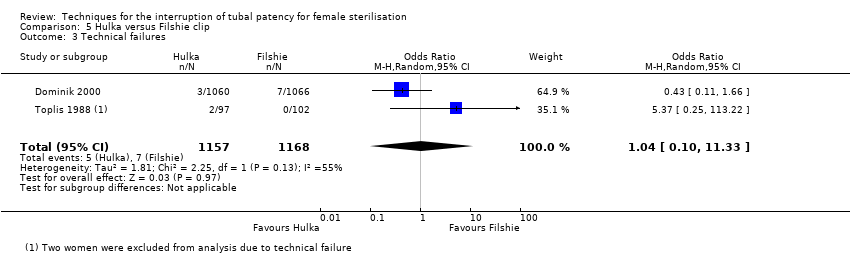
| 3 Technical failures Show forest plot | 2 | 2325 | Odds Ratio (M‐H, Random, 95% CI) | 1.04 [0.10, 11.33] |
| Analysis 5.3  Comparison 5 Hulka versus Filshie clip, Outcome 3 Technical failures. | ||||
| 4 Technical difficulties Show forest plot | 2 | 2323 | Peto Odds Ratio (Peto, Fixed, 95% CI) | 1.51 [1.09, 2.10] |
| Analysis 5.4 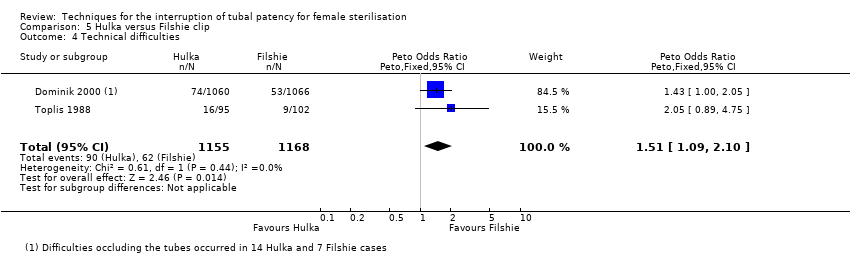 Comparison 5 Hulka versus Filshie clip, Outcome 4 Technical difficulties. | ||||
| 5 Failure rate: total Show forest plot | 1 | 1441 | Odds Ratio (M‐H, Fixed, 95% CI) | 6.20 [0.75, 51.66] |
| Analysis 5.5 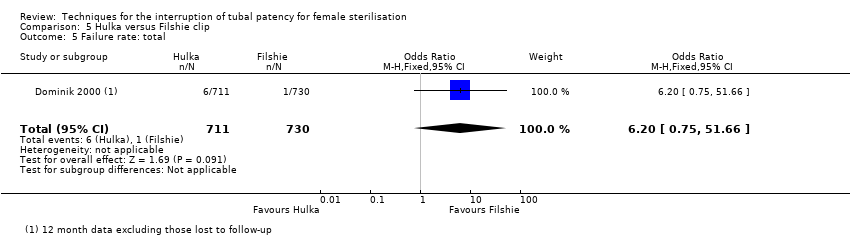 Comparison 5 Hulka versus Filshie clip, Outcome 5 Failure rate: total. | ||||
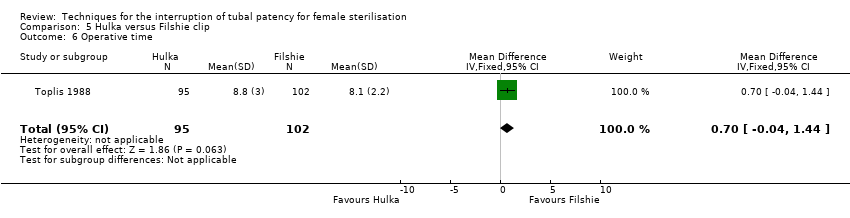
| 6 Operative time Show forest plot | 1 | 197 | Mean Difference (IV, Fixed, 95% CI) | 0.70 [‐0.04, 1.44] |
| Analysis 5.6  Comparison 5 Hulka versus Filshie clip, Outcome 6 Operative time. | ||||
| 7 Complaints Show forest plot | 1 | Peto Odds Ratio (Peto, Fixed, 95% CI) | Subtotals only | |
| Analysis 5.7  Comparison 5 Hulka versus Filshie clip, Outcome 7 Complaints. | ||||
| 7.1 Postoperative pain < 24 h | 1 | 197 | Peto Odds Ratio (Peto, Fixed, 95% CI) | 1.74 [0.99, 3.03] |
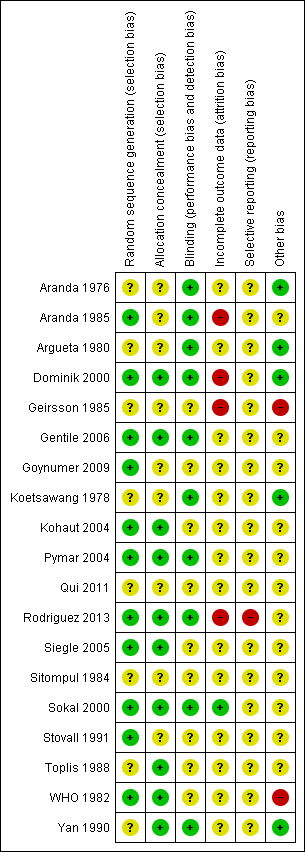
Risk of bias summary: review authors' judgements about each risk of bias item for each included study.

Comparison 1 Tubal ring versus clip, Outcome 1 Major morbidity: total.
Comparison 1 Tubal ring versus clip, Outcome 2 Minor morbidity: total.

Comparison 1 Tubal ring versus clip, Outcome 3 Minor morbidity: details.

Comparison 1 Tubal ring versus clip, Outcome 4 Technical failures.

Comparison 1 Tubal ring versus clip, Outcome 5 Technical difficulties.
Comparison 1 Tubal ring versus clip, Outcome 6 Failure rate: total.

Comparison 1 Tubal ring versus clip, Outcome 7 Failure rate: details.

Comparison 1 Tubal ring versus clip, Outcome 8 Operative time.
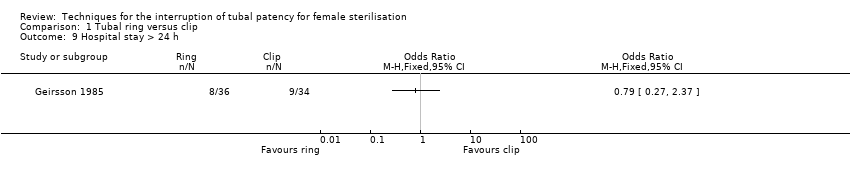
Comparison 1 Tubal ring versus clip, Outcome 9 Hospital stay > 24 h.
Comparison 1 Tubal ring versus clip, Outcome 10 Complaints.

Comparison 1 Tubal ring versus clip, Outcome 11 Menstrual irregularities.
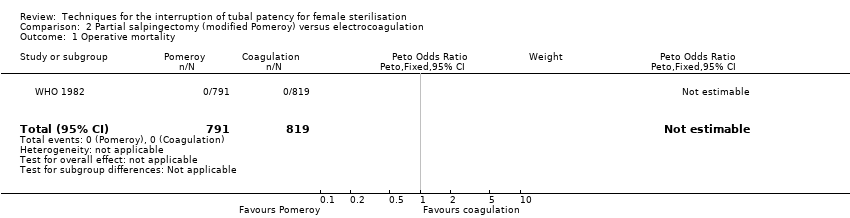
Comparison 2 Partial salpingectomy (modified Pomeroy) versus electrocoagulation, Outcome 1 Operative mortality.

Comparison 2 Partial salpingectomy (modified Pomeroy) versus electrocoagulation, Outcome 2 Major morbidity: total.
Comparison 2 Partial salpingectomy (modified Pomeroy) versus electrocoagulation, Outcome 3 Major morbidity: details.

Comparison 2 Partial salpingectomy (modified Pomeroy) versus electrocoagulation, Outcome 4 Minor morbidity: total.

Comparison 2 Partial salpingectomy (modified Pomeroy) versus electrocoagulation, Outcome 5 Minor morbidity: details.
Comparison 2 Partial salpingectomy (modified Pomeroy) versus electrocoagulation, Outcome 6 Failure rate: total.

Comparison 2 Partial salpingectomy (modified Pomeroy) versus electrocoagulation, Outcome 7 Failure rate: details.
Comparison 2 Partial salpingectomy (modified Pomeroy) versus electrocoagulation, Outcome 8 Hospital stay more 24 h.

Comparison 2 Partial salpingectomy (modified Pomeroy) versus electrocoagulation, Outcome 9 Complaints.

Comparison 3 Tubal ring versus electrocoagulation, Outcome 1 Major morbidity: total.

Comparison 3 Tubal ring versus electrocoagulation, Outcome 2 Major morbidity: details.

Comparison 3 Tubal ring versus electrocoagulation, Outcome 3 Minor morbidity: total.
Comparison 3 Tubal ring versus electrocoagulation, Outcome 4 Minor morbidity: details.
Comparison 3 Tubal ring versus electrocoagulation, Outcome 5 Technical failures: total.

Comparison 3 Tubal ring versus electrocoagulation, Outcome 6 Technical difficulties.
Comparison 3 Tubal ring versus electrocoagulation, Outcome 7 Failure rate: total.

Comparison 3 Tubal ring versus electrocoagulation, Outcome 8 Operative time.

Comparison 3 Tubal ring versus electrocoagulation, Outcome 9 Complaints.
Comparison 3 Tubal ring versus electrocoagulation, Outcome 10 Menstrual irregularities.

Comparison 4 Partial salpingectomy (PS) versus clip, Outcome 1 Operative mortality.

Comparison 4 Partial salpingectomy (PS) versus clip, Outcome 2 Major morbidity: total.

Comparison 4 Partial salpingectomy (PS) versus clip, Outcome 3 Minor morbidity: total.
Comparison 4 Partial salpingectomy (PS) versus clip, Outcome 4 Minor morbidity: details.

Comparison 4 Partial salpingectomy (PS) versus clip, Outcome 5 Technical failures.
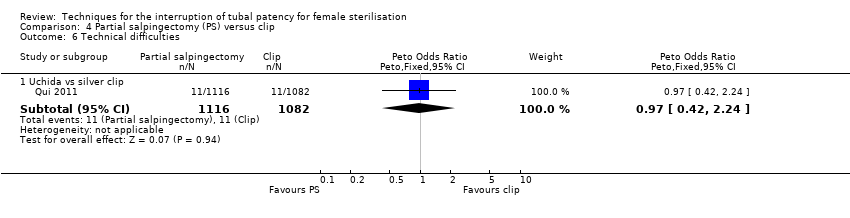
Comparison 4 Partial salpingectomy (PS) versus clip, Outcome 6 Technical difficulties.

Comparison 4 Partial salpingectomy (PS) versus clip, Outcome 7 Failure rate (12 months) : total.

Comparison 4 Partial salpingectomy (PS) versus clip, Outcome 8 Operative time.
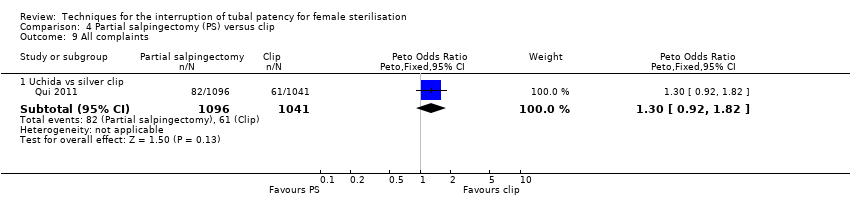
Comparison 4 Partial salpingectomy (PS) versus clip, Outcome 9 All complaints.
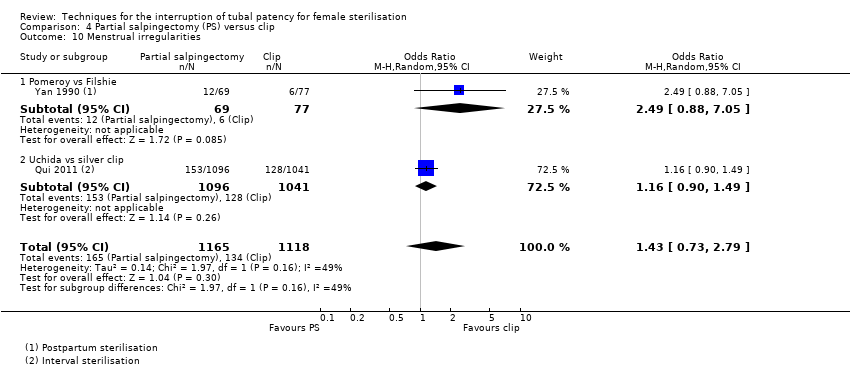
Comparison 4 Partial salpingectomy (PS) versus clip, Outcome 10 Menstrual irregularities.
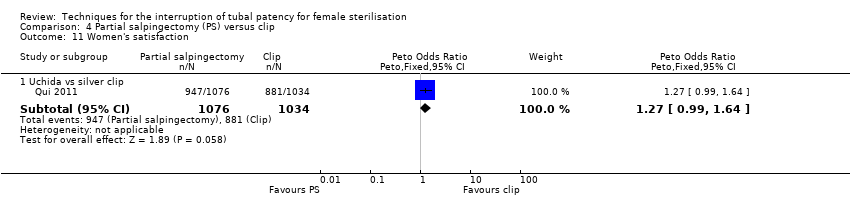
Comparison 4 Partial salpingectomy (PS) versus clip, Outcome 11 Women's satisfaction.
| Study | . | . |
| Kohaut 2004 | Seven out of 10 surgeons performing a total of 29 sterilisations preferred the Filshie clip method to the Pomeroy method. | |
Comparison 4 Partial salpingectomy (PS) versus clip, Outcome 12 Surgeon's satisfaction.
Comparison 5 Hulka versus Filshie clip, Outcome 1 Minor morbidity: total.
Comparison 5 Hulka versus Filshie clip, Outcome 2 Minor morbidity: details.
Comparison 5 Hulka versus Filshie clip, Outcome 3 Technical failures.

Comparison 5 Hulka versus Filshie clip, Outcome 4 Technical difficulties.

Comparison 5 Hulka versus Filshie clip, Outcome 5 Failure rate: total.
Comparison 5 Hulka versus Filshie clip, Outcome 6 Operative time.

Comparison 5 Hulka versus Filshie clip, Outcome 7 Complaints.
| Tubal ring compared with tubal clip for interval sterilisation | ||||||
| Patient or population: women > 6 weeks postpartum requesting tubal sterilisation Settings: any Intervention: tubal ring Comparison: tubal clip | ||||||
| Outcomes | Illustrative comparative risks* (95% CI) | Relative effect | No of participants | Quality of the evidence | Comments | |
| Assumed risk | Corresponding risk | |||||
| Clip | Ring | |||||
| Major morbidity: total | Low risk population | OR 0.14 (0.00 to 7.05) | 545 (1) | ⊕⊕⊝⊝ | Only one event occurred in the clip group | |
| 4 per 1000 | 1 per 1000 (0 to 28) | |||||
| Minor morbidity: total | Low risk population | OR 2.15 (1.22 to 3.78) | 842 | ⊕⊕⊕⊕ | ||
| 57 per 1000 | 123 per 1000 | |||||
| Minor morbidity: details ‐ procedure‐related injuries | Low risk population | OR 1.95 (1.36 to 2.78) | 3575 | ⊕⊕⊕⊕ | ||
| 21 per 1000 | 41 per 1000 | |||||
| Technical failures | Low risk population | OR 3.93 (2.43 to 6.35) | 3476 (3) | ⊕⊕⊕⊕ | ||
| 10 per 1000 | 39 per 1000 | |||||
| Failure rate: details (12 to 24 months) | Low risk population | OR 0.72 (0.33 to 1.57) | 3822 | ⊕⊕⊕⊕ | ||
| 4 per 1000 | 3 per 1000 | |||||
| Complaints: Postoperative pain (24 hours) | Low risk population | OR 1.14 (0.88 to 1.48) | 922 (3) | ⊕⊕⊕⊕ | ||
| 477 per 1000 | 544 per 1000 | |||||
| *The basis for the assumed risk is the median control group (clip) risk across studies. The corresponding risk (and its 95% confidence interval) is based on the assumed risk in the comparison group and the relative effect of the intervention (and its 95% CI). | ||||||
| GRADE Working Group grades of evidence | ||||||
| 1 Downgraded due to imprecision. 2 Downgraded due to sparse data. | ||||||
| Modified Pomeroy partial salpingectomy compared with tubal electrocoagulation for interval sterilisation | ||||||
| Patient or population: women > 6 weeks postpartum requesting tubal sterilisation Settings: any Intervention: modified Pomeroy partial salpingectomy Comparison: electrocoagulation | ||||||
| Outcomes | Illustrative comparative risks* (95% CI) | Relative effect | No of participants | Quality of the evidence | Comments | |
| Assumed risk | Corresponding risk | |||||
| Electrocoagulation | Modified Pomeroy | |||||
| Major morbidity: total | Low risk population | OR 2.87 (1.13 to 7.25) | 1905 (2) | ⊕⊕⊝⊝ | ||
| 10 per 1000 | 29 per 1000 | |||||
| Major morbidity: procedure‐related injuries requiring additional operation or blood transfusion | 10 per 1000 | 19 per 1000 (19 to 190) | OR 1.90 (0.19 to 18.96) | 1905 (2) | ⊕⊕⊝⊝ | |
| Major morbidity: rehospitalisation as a consequence of the operation | 20 per 1000 | 115 per 1000 (15 to 900) | OR 5.74 (0.73 to 45.09) | 295 (1) | ⊕⊝⊝⊝ | |
| Minor morbidity: total | Low risk population | OR 1.60 (1.10 to 2.33) | 1905 (2) | ⊕⊕⊝⊝ | The WHO study reported significantly more wound infections in the modified Pomeroy group, where participants underwent minilaparotomy, compared with the electrocoagulation group where laparoscopy was used) | |
| 38 per 1000 | 61 per 1000 | |||||
| Minor morbidity: procedure‐related injuries with no additional operation | Low risk population | OR 0.53 (0.06 to 5.11) | 1610 | ⊕⊕⊕⊝ | ||
| 2 per 1000 | 1 per 1000 | |||||
| Failure rate: total (12 months) | Low risk population | OR 4.47 (0.07 to 286.78) | 295 (1) | ⊕⊕⊝⊝ | ||
| 0.5 per 1000 | 2 per 1000 (0 to 143) | |||||
| Complaints ‐ postoperative pain (24 hours) | Low risk population | OR 3.85 (2.91 to 5.10) | 1905 (2) | ⊕⊕⊕⊝ | ||
| 95 per 1000 | 366 per 1000 | |||||
| Complaints ‐ persistent pain at follow‐up visit | Low risk population | OR 1.09 (0.88 to 1.47) | 1610 | ⊕⊕⊕⊝ | ||
| 117 per 1000 | 128 per 1000 | |||||
| *The basis for the assumed risk is the median control group (electrocoagulation) risk across studies. The corresponding risk (and its 95% confidence interval) is based on the assumed risk in the comparison group and the relative effect of the intervention (and its 95% CI). | ||||||
| GRADE Working Group grades of evidence | ||||||
| 1 Downgraded due to imprecision. 2 Downgraded due to inconsistency. 3 Sparse data. 4 Downgraded due to indirectness (this effect may be due to the abdominal approach (minilaparotomy versus laparoscopy) rather than the tubal technique). | ||||||
| Tubal ring compared with electrocoagulation for interval sterilisation | ||||||
| Patient or population: women > 6 weeks postpartum requesting tubal sterilisation Settings: any Intervention: tubal ring Comparison: electrocoagulation | ||||||
| Outcomes | Illustrative comparative risks* (95% CI) | Relative effect | No of participants | Quality of the evidence | Comments | |
| Assumed risk | Corresponding risk | |||||
| Electrocoagulation | Ring | |||||
| Major morbidity: total | Low risk population | OR 0.14 0.00 to 7.01 | 596 | ⊕⊕⊝⊝ low1,2 | Unipolar electrocoagulation stated in one study and not specified in the other. Only one event reported in total | |
| 0.5 per 1000 | 0 per 1000 (0 to 4) | |||||
| Minor morbidity: total | Low risk population | OR 0.97 (0.50, 1.87) | 596 | ⊕⊕⊕⊝ | ||
| 66 per 1000 | 64 per 1000 | |||||
| Technical failures: total | Low risk population | OR 3.42 (0.59 to 19.81) | 596 | ⊕⊕⊕⊝ | ||
| 3 per 1000 | 10 per 1000 | |||||
| Failure rate: total | not estimable | not estimable | Not estimable due to insufficient data | 160 | ‐ | No pregnancies reported in one study |
| Complaints ‐ postoperative pain (24 hours) | Low risk population | OR 3.40 (1.17 to 9.84) | 596 | ⊕⊕⊝⊝ low1,3 | ||
| 176 per 1000 | 598 per 1000 | |||||
| Complaints ‐ persistent pain at follow‐up visit | Low risk population | OR 1.22 (0.75 to 1.97) | 594 | ⊕⊕⊕⊝ | ||
| 140 per 1000 | 171 per 1000 | |||||
| *The basis for the assumed risk is the median control group (electrocoagulation) risk across studies. The corresponding risk (and its 95% confidence interval) is based on the assumed risk in the comparison group and the relative effect of the intervention (and its 95% CI). | ||||||
| GRADE Working Group grades of evidence | ||||||
| 1 Downgraded due to imprecision. 2 Downgraded due to sparse data. 3 Downgraded due to inconsistency. | ||||||
| Partial salpingectomy compared with tubal clips for tubal sterilisation | ||||||
| Patient or population: women requesting postpartum or interval sterilisation Settings: any Intervention: partial salpingectomy Comparison: tubal clips | ||||||
| Outcomes | Illustrative comparative risks* (95% CI) | Relative effect | No of participants | Quality of the evidence | Comments | |
| Assumed risk | Corresponding risk | |||||
| Clips | Partial salpingectomy | |||||
| Major morbidity: total | Low risk population | not estimable | 2198 | ‐ | No deaths or major morbidity events reported in one large trial | |
| 0 per 1000 | 0 per 1000 | |||||
| Minor morbidity: total | Low risk population | OR 7.39 (0.46 to 119.01) | 193 | ⊕⊕⊝⊝ | ||
| 0.5 per 1000 | 4 per 1000 | |||||
| Technical failures | Low risk population | OR 0.18 (0.08 to 0.40) | 2198 | ⊕⊕⊕⊝ | ||
| 20 per 1000 | 4 per 1000 | |||||
| Failure rate: total (12 months) | Low risk population | OR 0.21, 95% CI 0.05 to 0.84 | 3537 | ⊕⊕⊕⊝ | In this analysis, we grouped studies according to whether sterilisation was performed on a postpartum (1) or interval basis (1). Results were similar across these subgroups (Test for subgroup differences: P value 0.58, I² = 0%) | |
| 2 per 1000 | 0.4 per 1000 | |||||
| Complaints (12 months) | Low risk population | OR 1.30 (0.92 to 1.82) | 2137 (1) | ⊕⊕⊕⊝ | This single study reported data on 'chief complaints' at 3, 6, and 12 months and rates were similar between groups at all assessment points | |
| 59 per 1000 | 77 per 1000 (54 to 107) | |||||
| *The basis for the assumed risk is the median control group (clips) risk across studies. The corresponding risk (and its 95% confidence interval) is based on the assumed risk in the comparison group and the relative effect of the intervention (and its 95% CI). | ||||||
| GRADE Working Group grades of evidence | ||||||
| 1 Downgraded due to imprecision. 2 Downgraded due to sparse data. 3 Downgraded due to indirectness (unclear whether silver clips and Filshie clips are similarly effective). 4 Downgraded due to risk of bias. | ||||||
| Hulka clips compared with Filshie clips for interval sterilisation | ||||||
| Patient or population: women requesting sterilisation Settings: any Intervention: Hulka clips Comparison: Filshie clips | ||||||
| Outcomes | Illustrative comparative risks* (95% CI) | Relative effect | No of participants | Quality of the evidence | Comments | |
| Assumed risk | Corresponding risk | |||||
| Filshie clip | Hulka clip | |||||
| Minor morbidity: total | Low risk population | OR 0.14 (0.00 to 7.32) | 197 | ⊕⊕⊝⊝ | ||
| 10 per 1000 | 1 per 1000 | |||||
| Minor morbidity: procedure‐related injuries | Low risk population | OR 1.55 (0.73 to 3.26) | 2322 | ⊕⊕⊕⊝ | ||
| 10 per 1000 | 16 per 1000 | |||||
| Technical failures | Low risk population | OR 1.04 (0.10 to 11.33) | 2325 (2) | ⊕⊕⊝⊝ | ||
| 7 per 1000 | 7 per 1000 (1 to 79) | |||||
| Failure rate: total (12 months) | Low risk population | OR 6.20 (0.75 to 51.66) | 1441 (1) | ⊕⊕⊕⊝ | ||
| 1 per 1000 | 6 per 1000 (1 to 52) | |||||
| Complaints: postoperative pain (24 hours) | Low risk population | OR 1.74 (0.99 to 3.03) | 197 | ⊕⊕⊝⊝ | ||
| 45 per 1000 | 78 per 1000 | |||||
| *The basis for the assumed risk is the median control group (Filshie clips) risk across studies. The corresponding risk (and its 95% confidence interval) is based on the assumed risk in the comparison group and the relative effect of the intervention (and its 95% CI). | ||||||
| GRADE Working Group grades of evidence | ||||||
| 1 Downgraded due to imprecision. 2 Downgraded due to sparse data. 3Downgraded due to inconsistency. 4 Downgraded due to risk of bias. | ||||||
| Outcome or subgroup title | No. of studies | No. of participants | Statistical method | Effect size |
| 1 Major morbidity: total Show forest plot | 1 | Peto Odds Ratio (Peto, Fixed, 95% CI) | Subtotals only | |
| 1.1 Procedure‐related injuries requiring additional operation or blood transfusion | 1 | 545 | Peto Odds Ratio (Peto, Fixed, 95% CI) | 0.14 [0.00, 7.05] |
| 2 Minor morbidity: total Show forest plot | 2 | 842 | Peto Odds Ratio (Peto, Fixed, 95% CI) | 2.15 [1.22, 3.78] |
| 3 Minor morbidity: details Show forest plot | 3 | Peto Odds Ratio (Peto, Fixed, 95% CI) | Subtotals only | |
| 3.1 Procedure related injuries with no additional operation | 3 | 3575 | Peto Odds Ratio (Peto, Fixed, 95% CI) | 1.95 [1.36, 2.78] |
| 3.2 Urogenital infections | 3 | 3145 | Peto Odds Ratio (Peto, Fixed, 95% CI) | 1.88 [0.83, 4.28] |
| 3.3 Wound infection | 3 | 3144 | Peto Odds Ratio (Peto, Fixed, 95% CI) | 1.17 [0.73, 1.87] |
| 3.4 Postoperative temperature > 38 °C without hospitalisation | 1 | 296 | Peto Odds Ratio (Peto, Fixed, 95% CI) | 7.49 [0.15, 377.52] |
| 4 Technical failures Show forest plot | 3 | 3476 | Peto Odds Ratio (Peto, Fixed, 95% CI) | 3.93 [2.43, 6.35] |
| 5 Technical difficulties Show forest plot | 3 | 3590 | Peto Odds Ratio (Peto, Fixed, 95% CI) | 1.13 [0.87, 1.46] |
| 6 Failure rate: total Show forest plot | 4 | 3822 | Peto Odds Ratio (Peto, Fixed, 95% CI) | 0.72 [0.33, 1.57] |
| 7 Failure rate: details Show forest plot | 2 | Peto Odds Ratio (Peto, Fixed, 95% CI) | Subtotals only | |
| 7.1 Failure rate ≤ 1 year, total | 2 | 2629 | Peto Odds Ratio (Peto, Fixed, 95% CI) | 0.85 [0.23, 3.14] |
| 7.2 Failure rate ≤ 1 year, extrauterine pregnancy | 1 | 2202 | Peto Odds Ratio (Peto, Fixed, 95% CI) | 0.0 [0.0, 0.0] |
| 7.3 Failure rate > 1 year, extrauterine pregnancy | 1 | 427 | Peto Odds Ratio (Peto, Fixed, 95% CI) | 8.11 [0.16, 410.33] |
| 8 Operative time Show forest plot | 1 | 297 | Mean Difference (IV, Fixed, 95% CI) | 0.0 [0.0, 0.0] |
| 9 Hospital stay > 24 h Show forest plot | 1 | Odds Ratio (M‐H, Fixed, 95% CI) | Totals not selected | |
| 10 Complaints Show forest plot | 4 | Peto Odds Ratio (Peto, Fixed, 95% CI) | Subtotals only | |
| 10.1 Postoperative pain < 24 h | 3 | 922 | Peto Odds Ratio (Peto, Fixed, 95% CI) | 1.14 [0.88, 1.48] |
| 10.2 Postoperative analgesic use | 1 | 70 | Peto Odds Ratio (Peto, Fixed, 95% CI) | 0.70 [0.28, 1.79] |
| 10.3 Cramping pain during first week after surgery | 1 | 70 | Peto Odds Ratio (Peto, Fixed, 95% CI) | 5.24 [1.52, 18.00] |
| 11 Menstrual irregularities Show forest plot | 2 | 612 | Peto Odds Ratio (Peto, Fixed, 95% CI) | 1.61 [0.75, 3.49] |
| Outcome or subgroup title | No. of studies | No. of participants | Statistical method | Effect size |
| 1 Operative mortality Show forest plot | 1 | 1610 | Peto Odds Ratio (Peto, Fixed, 95% CI) | 0.0 [0.0, 0.0] |
| 2 Major morbidity: total Show forest plot | 2 | 1905 | Peto Odds Ratio (Peto, Fixed, 95% CI) | 2.87 [1.13, 7.25] |
| 3 Major morbidity: details Show forest plot | 2 | Odds Ratio (M‐H, Random, 95% CI) | Subtotals only | |
| 3.1 Procedure‐related injuries requiring additional operation or blood transfusion | 2 | 1905 | Odds Ratio (M‐H, Random, 95% CI) | 1.90 [0.19, 18.96] |
| 3.2 Rehospitalisation as a consequence of operation | 1 | 295 | Odds Ratio (M‐H, Random, 95% CI) | 5.74 [0.73, 45.09] |
| 4 Minor morbidity: total Show forest plot | 2 | 1905 | Peto Odds Ratio (Peto, Fixed, 95% CI) | 1.60 [1.10, 2.33] |
| 5 Minor morbidity: details Show forest plot | 2 | Peto Odds Ratio (Peto, Fixed, 95% CI) | Subtotals only | |
| 5.1 Procedure‐related injuries with no additional operation | 1 | 1610 | Peto Odds Ratio (Peto, Fixed, 95% CI) | 0.53 [0.06, 5.11] |
| 5.2 Urogenital infections | 1 | 1610 | Peto Odds Ratio (Peto, Fixed, 95% CI) | 0.81 [0.43, 1.50] |
| 5.3 Wound infection | 1 | 1610 | Peto Odds Ratio (Peto, Fixed, 95% CI) | 2.49 [1.54, 4.04] |
| 5.4 Postoperative temperature > 38 °C without hospitalisation | 1 | 295 | Peto Odds Ratio (Peto, Fixed, 95% CI) | 1.45 [0.18, 11.77] |
| 6 Failure rate: total Show forest plot | 1 | 295 | Peto Odds Ratio (Peto, Fixed, 95% CI) | 4.47 [0.07, 286.78] |
| 6.1 Failure rate, total | 1 | 295 | Peto Odds Ratio (Peto, Fixed, 95% CI) | 4.47 [0.07, 286.78] |
| 7 Failure rate: details Show forest plot | 1 | 295 | Peto Odds Ratio (Peto, Fixed, 95% CI) | 4.47 [0.07, 286.78] |
| 7.1 Failure rate > 1 year, total | 1 | 295 | Peto Odds Ratio (Peto, Fixed, 95% CI) | 4.47 [0.07, 286.78] |
| 8 Hospital stay more 24 h Show forest plot | 1 | 108 | Odds Ratio (M‐H, Fixed, 95% CI) | 0.48 [0.08, 2.74] |
| 9 Complaints Show forest plot | 3 | Peto Odds Ratio (Peto, Fixed, 95% CI) | Subtotals only | |
| 9.1 Postoperative pain < 24 h | 2 | 1905 | Peto Odds Ratio (Peto, Fixed, 95% CI) | 3.85 [2.91, 5.10] |
| 9.2 Postoperative analgesic use | 1 | 109 | Peto Odds Ratio (Peto, Fixed, 95% CI) | 2.05 [0.40, 10.56] |
| 9.3 Persistent pain at follow‐up visit | 1 | 1610 | Peto Odds Ratio (Peto, Fixed, 95% CI) | 1.09 [0.81, 1.47] |
| Outcome or subgroup title | No. of studies | No. of participants | Statistical method | Effect size |
| 1 Major morbidity: total Show forest plot | 2 | 596 | Peto Odds Ratio (Peto, Fixed, 95% CI) | 0.14 [0.00, 7.01] |
| 2 Major morbidity: details Show forest plot | 1 | 298 | Peto Odds Ratio (Peto, Fixed, 95% CI) | 0.14 [0.00, 7.01] |
| 2.1 Procedure‐related injuries requiring additional operation or blood transfusion | 1 | 298 | Peto Odds Ratio (Peto, Fixed, 95% CI) | 0.14 [0.00, 7.01] |
| 3 Minor morbidity: total Show forest plot | 2 | 596 | Peto Odds Ratio (Peto, Fixed, 95% CI) | 0.97 [0.50, 1.87] |
| 4 Minor morbidity: details Show forest plot | 2 | Peto Odds Ratio (Peto, Fixed, 95% CI) | Subtotals only | |
| 4.1 Procedure‐related injuries with no additional operation | 2 | 596 | Peto Odds Ratio (Peto, Fixed, 95% CI) | 0.76 [0.17, 3.38] |
| 4.2 Urogenital infections | 1 | 296 | Peto Odds Ratio (Peto, Fixed, 95% CI) | 1.03 [0.14, 7.37] |
| 4.3 Wound infection | 1 | 296 | Peto Odds Ratio (Peto, Fixed, 95% CI) | 0.93 [0.38, 2.25] |
| 4.4 Postoperative temperature > 38 °C without hospitalisation | 2 | 594 | Peto Odds Ratio (Peto, Fixed, 95% CI) | 1.37 [0.31, 6.06] |
| 5 Technical failures: total Show forest plot | 2 | 596 | Peto Odds Ratio (Peto, Fixed, 95% CI) | 3.42 [0.59, 19.81] |
| 6 Technical difficulties Show forest plot | 1 | 298 | Peto Odds Ratio (Peto, Fixed, 95% CI) | 0.14 [0.01, 1.33] |
| 7 Failure rate: total Show forest plot | 1 | 160 | Peto Odds Ratio (Peto, Fixed, 95% CI) | 0.0 [0.0, 0.0] |
| 7.1 Failure rate, total | 1 | 160 | Peto Odds Ratio (Peto, Fixed, 95% CI) | 0.0 [0.0, 0.0] |
| 8 Operative time Show forest plot | 1 | 298 | Mean Difference (IV, Fixed, 95% CI) | 0.0 [0.0, 0.0] |
| 9 Complaints Show forest plot | 2 | Odds Ratio (M‐H, Random, 95% CI) | Subtotals only | |
| 9.1 Postoperative pain < 24 h | 2 | 596 | Odds Ratio (M‐H, Random, 95% CI) | 3.40 [1.17, 9.84] |
| 9.2 Postoperative analgesic use | 1 | 298 | Odds Ratio (M‐H, Random, 95% CI) | 2.51 [1.00, 6.30] |
| 9.3 Persistent pain at follow‐up visit | 2 | 594 | Odds Ratio (M‐H, Random, 95% CI) | 1.22 [0.75, 1.97] |
| 10 Menstrual irregularities Show forest plot | 1 | 296 | Peto Odds Ratio (Peto, Fixed, 95% CI) | 0.90 [0.56, 1.45] |
| Outcome or subgroup title | No. of studies | No. of participants | Statistical method | Effect size |
| 1 Operative mortality Show forest plot | 1 | Peto Odds Ratio (Peto, Fixed, 95% CI) | Subtotals only | |
| 1.1 Uchida vs silver clip | 1 | 2198 | Peto Odds Ratio (Peto, Fixed, 95% CI) | 0.0 [0.0, 0.0] |
| 2 Major morbidity: total Show forest plot | 1 | 2198 | Peto Odds Ratio (Peto, Fixed, 95% CI) | 0.0 [0.0, 0.0] |
| 2.1 Uchida vs silver clip | 1 | 2198 | Peto Odds Ratio (Peto, Fixed, 95% CI) | 0.0 [0.0, 0.0] |
| 3 Minor morbidity: total Show forest plot | 1 | 193 | Peto Odds Ratio (Peto, Fixed, 95% CI) | 7.39 [0.46, 119.01] |
| 4 Minor morbidity: details Show forest plot | 1 | 193 | Peto Odds Ratio (Peto, Fixed, 95% CI) | 7.39 [0.46, 119.01] |
| 4.1 Procedure related injuries with no additional operation | 1 | 193 | Peto Odds Ratio (Peto, Fixed, 95% CI) | 7.39 [0.46, 119.01] |
| 5 Technical failures Show forest plot | 1 | Peto Odds Ratio (Peto, Fixed, 95% CI) | Subtotals only | |
| 5.1 Uchida vs silver clip | 1 | 2198 | Peto Odds Ratio (Peto, Fixed, 95% CI) | 0.18 [0.08, 0.40] |
| 6 Technical difficulties Show forest plot | 1 | Peto Odds Ratio (Peto, Fixed, 95% CI) | Subtotals only | |
| 6.1 Uchida vs silver clip | 1 | 2198 | Peto Odds Ratio (Peto, Fixed, 95% CI) | 0.97 [0.42, 2.24] |
| 7 Failure rate (12 months) : total Show forest plot | 2 | 3537 | Odds Ratio (M‐H, Random, 95% CI) | 0.21 [0.05, 0.84] |
| 7.1 Pomeroy vs Filshie | 1 | 1400 | Odds Ratio (M‐H, Random, 95% CI) | 0.22 [0.05, 1.02] |
| 7.2 Uchida vs silver clip | 1 | 2137 | Odds Ratio (M‐H, Random, 95% CI) | 0.19 [0.01, 3.95] |
| 8 Operative time Show forest plot | 2 | 2223 | Mean Difference (IV, Fixed, 95% CI) | 4.26 [3.65, 4.86] |
| 8.1 Pomeroy vs Filshie | 1 | 25 | Mean Difference (IV, Fixed, 95% CI) | 6.70 [0.77, 12.63] |
| 8.2 Uchida vs silver clip | 1 | 2198 | Mean Difference (IV, Fixed, 95% CI) | 4.23 [3.62, 4.84] |
| 9 All complaints Show forest plot | 1 | Peto Odds Ratio (Peto, Fixed, 95% CI) | Subtotals only | |
| 9.1 Uchida vs silver clip | 1 | 2137 | Peto Odds Ratio (Peto, Fixed, 95% CI) | 1.30 [0.92, 1.82] |
| 10 Menstrual irregularities Show forest plot | 2 | 2283 | Odds Ratio (M‐H, Random, 95% CI) | 1.43 [0.73, 2.79] |
| 10.1 Pomeroy vs Filshie | 1 | 146 | Odds Ratio (M‐H, Random, 95% CI) | 2.49 [0.88, 7.05] |
| 10.2 Uchida vs silver clip | 1 | 2137 | Odds Ratio (M‐H, Random, 95% CI) | 1.16 [0.90, 1.49] |
| 11 Women's satisfaction Show forest plot | 1 | Peto Odds Ratio (Peto, Fixed, 95% CI) | Subtotals only | |
| 11.1 Uchida vs silver clip | 1 | 2110 | Peto Odds Ratio (Peto, Fixed, 95% CI) | 1.27 [0.99, 1.64] |
| 12 Surgeon's satisfaction Show forest plot | Other data | No numeric data | ||
| Outcome or subgroup title | No. of studies | No. of participants | Statistical method | Effect size |
| 1 Minor morbidity: total Show forest plot | 1 | 197 | Peto Odds Ratio (Peto, Fixed, 95% CI) | 0.14 [0.00, 7.32] |
| 2 Minor morbidity: details Show forest plot | 2 | Odds Ratio (M‐H, Random, 95% CI) | Subtotals only | |
| 2.1 Procedure‐related injuries with no additional operation | 2 | 2322 | Odds Ratio (M‐H, Random, 95% CI) | 1.57 [0.73, 3.36] |
| 2.2 Urogenital infection | 1 | 1910 | Odds Ratio (M‐H, Random, 95% CI) | 2.40 [0.62, 9.30] |
| 2.3 Wound complications | 1 | 1910 | Odds Ratio (M‐H, Random, 95% CI) | 0.86 [0.63, 1.17] |
| 3 Technical failures Show forest plot | 2 | 2325 | Odds Ratio (M‐H, Random, 95% CI) | 1.04 [0.10, 11.33] |
| 4 Technical difficulties Show forest plot | 2 | 2323 | Peto Odds Ratio (Peto, Fixed, 95% CI) | 1.51 [1.09, 2.10] |
| 5 Failure rate: total Show forest plot | 1 | 1441 | Odds Ratio (M‐H, Fixed, 95% CI) | 6.20 [0.75, 51.66] |
| 6 Operative time Show forest plot | 1 | 197 | Mean Difference (IV, Fixed, 95% CI) | 0.70 [‐0.04, 1.44] |
| 7 Complaints Show forest plot | 1 | Peto Odds Ratio (Peto, Fixed, 95% CI) | Subtotals only | |
| 7.1 Postoperative pain < 24 h | 1 | 197 | Peto Odds Ratio (Peto, Fixed, 95% CI) | 1.74 [0.99, 3.03] |