Prevención escolar universal del consumo ilegal de drogas
Información
- DOI:
- https://doi.org/10.1002/14651858.CD003020.pub3Copiar DOI

- Base de datos:
-
- Cochrane Database of Systematic Reviews
- Versión publicada:
-
- 01 diciembre 2014see what's new
- Tipo:
-
- Intervention
- Etapa:
-
- Review
- Grupo Editorial Cochrane:
-
Grupo Cochrane de Alcohol y drogas
- Copyright:
-
- Copyright © 2017 The Cochrane Collaboration. Published by John Wiley & Sons, Ltd.
Cifras del artículo
Altmetric:
Citado por:
Autores
Contributions of authors
As for the first version of this review, FF, Patrizia Lemma and EV conceptualised the review; Federica Vigna‐Taglianti, Alessio Zambon and EV performed the literature searches and organised paper collection. FV‐T, FF, Alberto Borraccino, AZ and EV reviewed the papers. FV‐T, FF and EV abstracted data from the papers for meta‐analysis. FF wrote the introduction, results, discussion and conclusions sections. FV‐T wrote the methods, description of studies and methodological quality of included studies sections. EV wrote the abstract and helped to complete the review. All authors provided comments on the final version.
For the update FF and EV selected the studies for inclusion. SM, DB and EV extracted data from studies. FF and DB updated the introduction. SM performed meta‐analysis and wrote the methods and results sections of the review. EV wrote the abstract and the plain language summary. FF wrote the discussion and the conclusions. All authors provided comments on the final version.
Sources of support
Internal sources
-
No sources of support supplied
External sources
-
For the original version: National Fund Against Drug ‐ 1996 ‐ Piedmont Region grant No. 239/28.1, Italy.
-
For the 2014 update: European Community’s Seventh Framework Programme (FP7/2007‐2013), under Grant Agreement n. 266813‐Addictions and Lifestyle in Contemporary Europe‐Reframing Addictions Project (ALICE RAP). Participant organizations in ALICE RAP can be seen at http://www.alicerap.eu/about‐alice‐rap/partners.html. The funders had no role in study design, data collection and analysis, decision to publish, or preparation of the manuscript, Other.
Declarations of interest
FF is an author of an included study (UNPLUGGED 2008). He did not participate in the evaluation of and data extraction for the related papers.
SM EV,DB have no conflicts of interest
Acknowledgements
We thank Paola Petroni, Valentina Comba, Simonetta Lingua, Paride Angius, Barbara Martin and Federica Mathis for their contribution to the first version of this review, as well as the authors who are no longer participating, Federica Vigna‐Taglianti, Patrizia Lemma and Alberto Borracino.
Dr Robert Ali is the contact editor for the review.
Version history
| Published | Title | Stage | Authors | Version |
| 2014 Dec 01 | Universal school‐based prevention for illicit drug use | Review | Fabrizio Faggiano, Silvia Minozzi, Elisabetta Versino, Daria Buscemi | |
| 2005 Apr 20 | School‐based prevention for illicit drugs' use | Review | Fabrizio Faggiano, Federica Vigna‐Taglianti, Elisabetta Versino, Alessio Zambon, Alberto Borraccino, Patrizia Lemma | |
| 2000 Oct 23 | School‐based prevention for illicit drugs' use | Protocol | Fabrizio Faggiano, Patrizia Lemma, A Borraccino, P Angius, R Ippolito, Elisabetta Versino, Federica FVT Vigna‐Taglianti | |
Differences between protocol and review
The following changes have been made in the present update, compared with the previous version:
-
We have excluded observational studies because a large number of RCTs were retrieved in the update.
-
We changed the classification of the types of programmes, adopting the system proposed by Thomas (Thomas 2013), as explained in the background section.
-
We no longer considered intermediate outcomes (attitudes toward dugs, acquirement of personal skills) and other less relevant secondary outcomes (peer/adult drug use, other changes in behaviours).
Notes
The correction has been made to address concerns from the lead author of the study CLIMATE 2009 about the incorrect reporting of the results.
Further amendments are underway to address the inconsistencies in reporting, interpretation of results and GRADE quality ratings identified by Central Editorial Unit.
Keywords
MeSH
Medical Subject Headings (MeSH) Keywords
Medical Subject Headings Check Words
Adolescent; Humans;
PICO
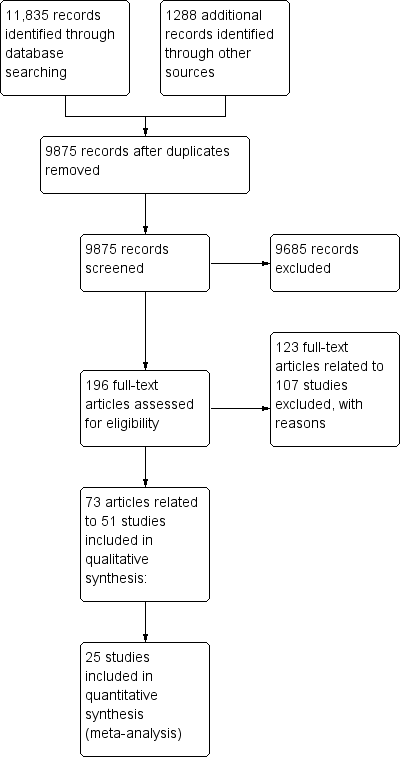
Study flow diagram.

'Risk of bias' graph: review authors' judgements about each risk of bias item presented as percentages across all included studies.
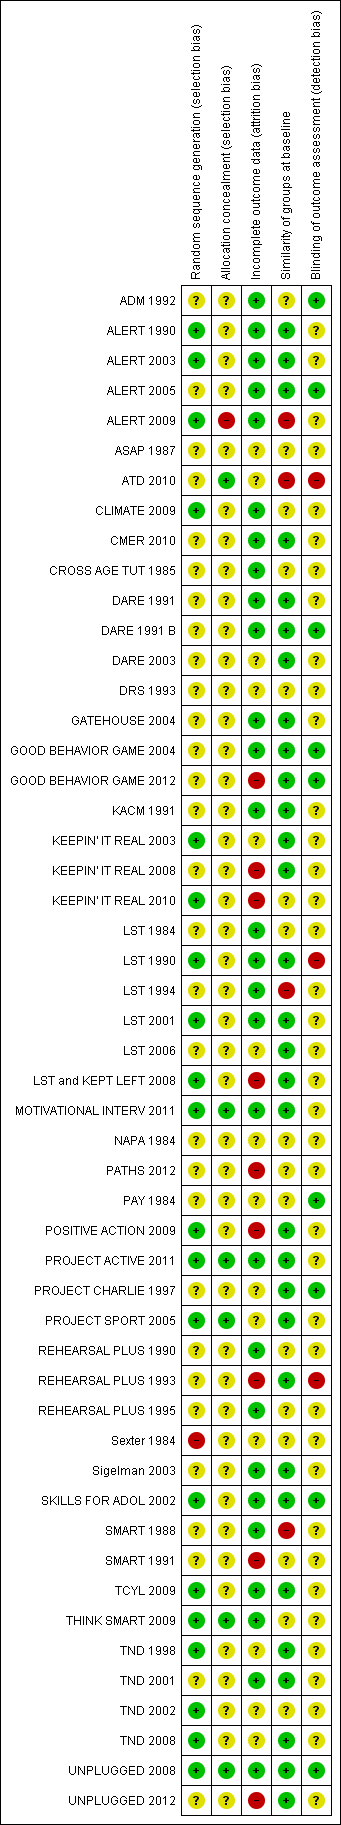
'Risk of bias' summary: review authors' judgements about each risk of bias item for each included study.

Comparison 1 Social competence versus usual curricula, Outcome 1 Marijuana use < 12 months.

Comparison 1 Social competence versus usual curricula, Outcome 2 Marijuana use < 12 months.

Comparison 1 Social competence versus usual curricula, Outcome 3 Marijuana use ≥ 12 months.

Comparison 1 Social competence versus usual curricula, Outcome 4 Marijuana use ≥ 12 months.

Comparison 1 Social competence versus usual curricula, Outcome 5 Hard drug use < 12 months.
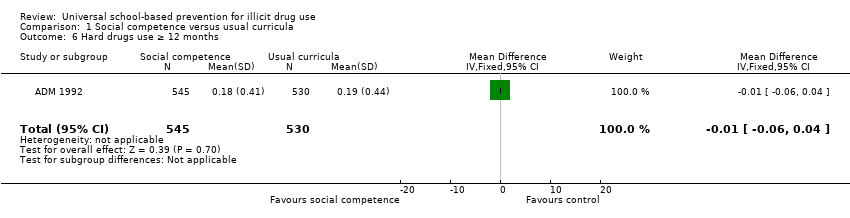
Comparison 1 Social competence versus usual curricula, Outcome 6 Hard drugs use ≥ 12 months.

Comparison 1 Social competence versus usual curricula, Outcome 7 Other drug use < 12 months.

Comparison 1 Social competence versus usual curricula, Outcome 8 Other drugs use < 12 months.
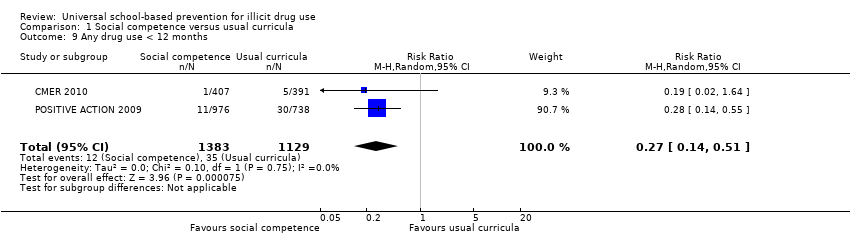
Comparison 1 Social competence versus usual curricula, Outcome 9 Any drug use < 12 months.

Comparison 1 Social competence versus usual curricula, Outcome 10 Any drug use < 12 months.
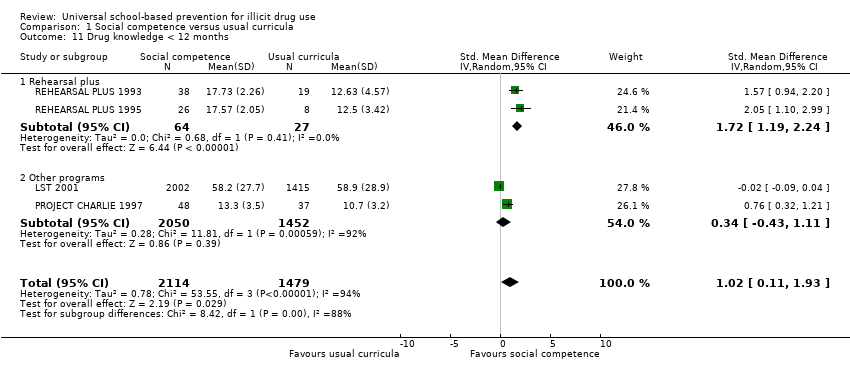
Comparison 1 Social competence versus usual curricula, Outcome 11 Drug knowledge < 12 months.

Comparison 1 Social competence versus usual curricula, Outcome 12 Intention to use marijuana < 12 months.

Comparison 1 Social competence versus usual curricula, Outcome 13 Intention to use hard drugs < 12 months.

Comparison 1 Social competence versus usual curricula, Outcome 14 Intention to use other drugs < 12 months.
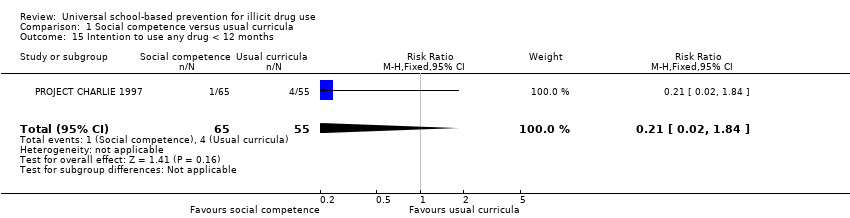
Comparison 1 Social competence versus usual curricula, Outcome 15 Intention to use any drug < 12 months.
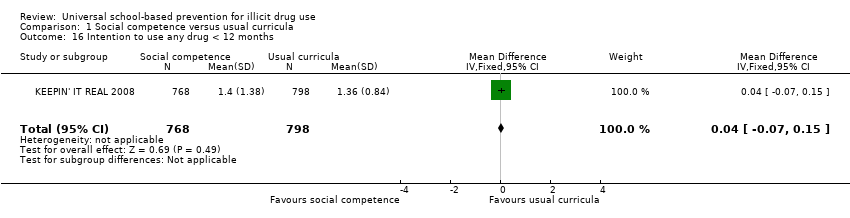
Comparison 1 Social competence versus usual curricula, Outcome 16 Intention to use any drug < 12 months.

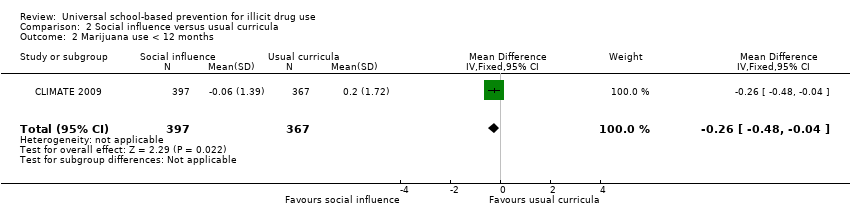
Comparison 2 Social influence versus usual curricula, Outcome 1 Marijuana use < 12 months.
Comparison 2 Social influence versus usual curricula, Outcome 2 Marijuana use < 12 months.
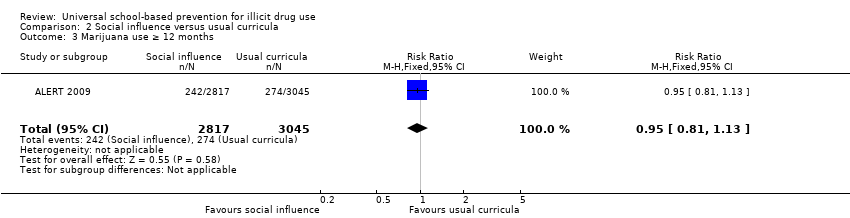
Comparison 2 Social influence versus usual curricula, Outcome 3 Marijuana use ≥ 12 months.
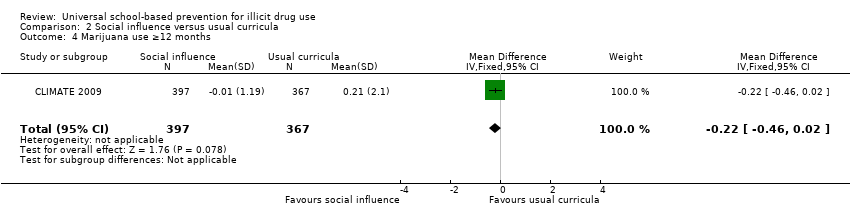
Comparison 2 Social influence versus usual curricula, Outcome 4 Marijuana use ≥12 months.

Comparison 2 Social influence versus usual curricula, Outcome 5 Other drug use < 12 months.
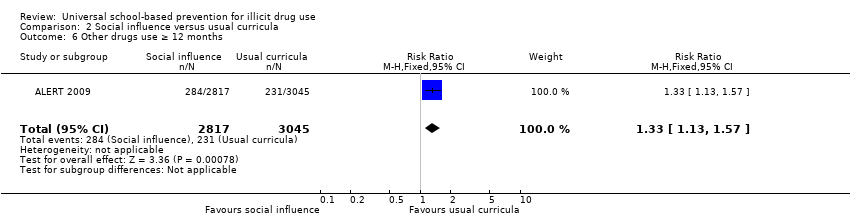
Comparison 2 Social influence versus usual curricula, Outcome 6 Other drugs use ≥ 12 months.

Comparison 2 Social influence versus usual curricula, Outcome 7 Drug knowledge < 12 months.

Comparison 2 Social influence versus usual curricula, Outcome 8 Drug knowledge ≥ 12 months.

Comparison 3 Combined versus usual curricula, Outcome 1 Marijuana use < 12 months.

Comparison 3 Combined versus usual curricula, Outcome 2 Marijuana use < 12 months.

Comparison 3 Combined versus usual curricula, Outcome 3 Marijuana use ≥ 12 months.

Comparison 3 Combined versus usual curricula, Outcome 4 Marijuana use ≥12 months.

Comparison 3 Combined versus usual curricula, Outcome 5 Hard drug use < 12 months.
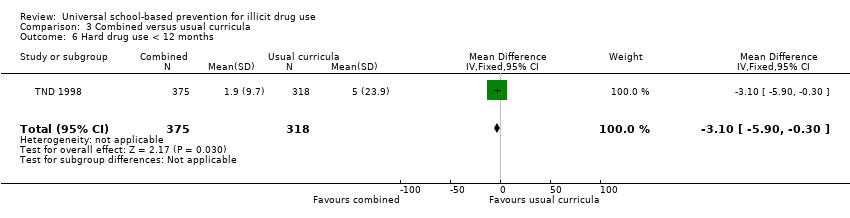
Comparison 3 Combined versus usual curricula, Outcome 6 Hard drug use < 12 months.
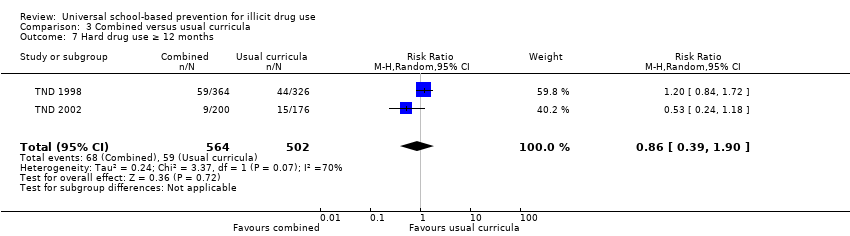
Comparison 3 Combined versus usual curricula, Outcome 7 Hard drug use ≥ 12 months.

Comparison 3 Combined versus usual curricula, Outcome 8 Hard drug use ≥ 12 months.
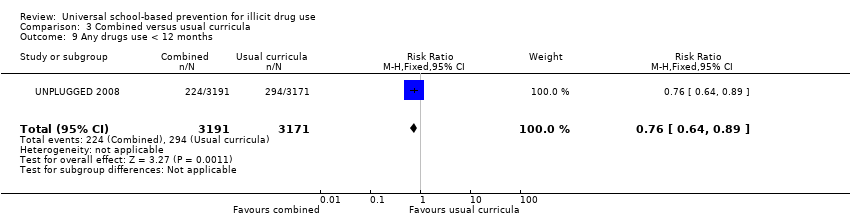
Comparison 3 Combined versus usual curricula, Outcome 9 Any drugs use < 12 months.
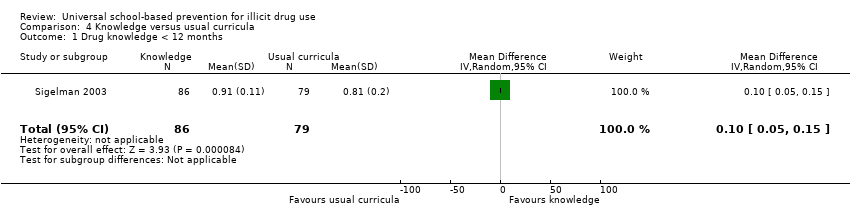
Comparison 4 Knowledge versus usual curricula, Outcome 1 Drug knowledge < 12 months.

Comparison 4 Knowledge versus usual curricula, Outcome 2 Intention to use hard drugs < 12 months.
| Social competence versus usual curricula for illicit drug use | ||||||
| Patients or population: primary or secondary school pupils | ||||||
| Outcomes | Illustrative comparative risks* (95% CI) | Relative effect | No of participants | Quality of the evidence | Comments | |
| Assumed risk | Corresponding risk | |||||
| Usual curricula | Social competence | |||||
| Marijuana use < 12 months | Study population | RR 0.9 | 9456 | ⊕⊕⊕⊝ | ||
| 119 per 1000 | 107 per 1000 | |||||
| Moderate | ||||||
| 121 per 1000 | 109 per 1000 | |||||
| Marijuana use ≥ 12 months | Study population | RR 0.86 | 2678 | ⊕⊕⊕⊕ | ||
| 217 per 1000 | 186 per 1000 | |||||
| Moderate | ||||||
| 217 per 1000 | 187 per 1000 | |||||
| Hard drug use < 12 months | Study population | RR 0.69 | 2090 | ⊕⊕⊕⊝ | ||
| 30 per 1000 | 20 per 1000 | |||||
| Moderate | ||||||
| 30 per 1000 | 21 per 1000 | |||||
| Hard drugs use ≥ 12 months | mean drug use 019 (SD 044) | The mean hard drug use at ≥ 12 months in the intervention groups was | 1075 | ⊕⊕⊕⊕ | ||
| Any drug use < 12 months | Study population | RR 0.27 | 2512 | ⊕⊕⊕⊝ | ||
| 31 per 1000 | 8 per 1000 | |||||
| Moderate | ||||||
| 27 per 1000 | 7 per 1000 | |||||
| Any drug use < 12 months | mean drug use 0.28 (SD 0.56) | The mean any drug use < 12 months in the intervention groups was | 1566 | ⊕⊕⊕⊝ | ||
| *The basis for the assumed risk (e.g. the median control group risk across studies) is provided in footnotes. The corresponding risk (and its 95% confidence interval) is based on the assumed risk in the comparison group and the relative effect of the intervention (and its 95% CI). | ||||||
| GRADE Working Group grades of evidence | ||||||
| 1One study at high risk of detection bias, one study at high risk of attrition bias. | ||||||
| Social influence versus usual curricula for illicit drug use | ||||||
| Patients or population: primary or secondary school pupils | ||||||
| Outcomes | Illustrative comparative risks* (95% CI) | Relative effect | No of participants | Quality of the evidence | Comments | |
| Assumed risk | Corresponding risk | |||||
| Usual curricula | Social influence | |||||
| Marijuana use < 12 months | Study population | RR 0.88 | 10716 | ⊕⊕⊕⊝ | ||
| 100 per 1000 | 88 per 1000 | |||||
| Moderate | ||||||
| 170 per 1000 | 150 per 1000 | |||||
| Marijuana use ≥ 12 months | Study population | RR 0.95 | 5862 | ⊕⊕⊕⊝ | ||
| 90 per 1000 | 85 per 1000 | |||||
| Moderate | ||||||
| 90 per 1000 | 86 per 1000 | |||||
| *The basis for the assumed risk (e.g. the median control group risk across studies) is provided in footnotes. The corresponding risk (and its 95% confidence interval) is based on the assumed risk in the comparison group and the relative effect of the intervention (and its 95% CI). | ||||||
| GRADE Working Group grades of evidence | ||||||
| 1One study at high risk of selection bias, one at high risk of detection bias. | ||||||
| Combined programmes versus usual curricula for illicit drug use | ||||||
| Patients or population: primary or secondary school pupils | ||||||
| Outcomes | Illustrative comparative risks* (95% CI) | Relative effect | No of participants | Quality of the evidence | Comments | |
| Assumed risk | Corresponding risk | |||||
| Control | Combined versus usual curricula | |||||
| Marijuana use < 12 months | Study population | RR 0.79 | 8701 | ⊕⊕⊕⊝ | ||
| 90 per 1000 | 71 per 1000 | |||||
| Moderate | ||||||
| 73 per 1000 | 58 per 1000 | |||||
| Marijuana use ≥12 months | Study population | RR 0.83 | 26910 | ⊕⊕⊕⊝ | ||
| 168 per 1000 | 139 per 1000 | |||||
| Moderate | ||||||
| 210 per 1000 | 174 per 1000 | |||||
| Hard drug use < 12 months | Study population | RR 0.85 | 693 | ⊕⊕⊕⊕ | ||
| 217 per 1000 | 184 per 1000 | |||||
| Moderate | ||||||
| 217 per 1000 | 184 per 1000 | |||||
| Hard drugs use ≥12 months | Study population | RR 0.86 | 1066 | ⊕⊕⊕⊕ | ||
| 118 per 1000 | 101 per 1000 | |||||
| Moderate | ||||||
| 110 per 1000 | 95 per 1000 | |||||
| Any drugs use < 12 months | Study population | RR 0.76 | 6362 | ⊕⊕⊕⊕ | ||
| 93 per 1000 | 70 per 1000 | |||||
| Moderate | ||||||
| 93 per 1000 | 71 per 1000 | |||||
| *The basis for the assumed risk (e.g. the median control group risk across studies) is provided in footnotes. The corresponding risk (and its 95% confidence interval) is based on the assumed risk in the comparison group and the relative effect of the intervention (and its 95% CI). | ||||||
| GRADE Working Group grades of evidence | ||||||
| 1One study at high risk of attrition bias. | ||||||
| Study reference | Programme name Study ID | Outcomes | ||
| Drug use | Intention to use | Knowledge | ||
| Clayton 1991‐1996; Lynam 1999 | DARE 1999 | Marijuana: | NA | NA |
| Perry 2003 | DARE+ DARE PLUS 2003 | NA | Marijuana: Other drugs: | NA |
| DARE 2003 | NA | Marijuana: Other drug: | NA | |
| Hecht 1993 | DRS 1993 | Marijuana: Hard drugs: | NA | NA |
| Werch 1991 | KACM 1991 | NA | NA | LFU mean difference score = 0, NS. |
| Hecht 2003 | KEEPIN' IT REAL 2003 | Marijuana: | NA | NA |
| Elek 2010 | KEEPIN' IT REAL 2010 | Any drug: | Any drug: | NA |
| KEEPIN' IT REAL PLUS | Any drug: | Any drug: | NA | |
| Botvin 1984 | LST 1984 | Marijuana: | NA | Marijuana: |
| Seal 2006 | LST 2006 | NA | NA | Favours treatment: mean knowledge score (SD); control = 10.4 (1.6), intervention = 16.5 (1.9), P value < 0.05 |
| Moskovitz 1984 | NAPA 1984 | NA | NA | SFU no significant differences LFU favours intervention (males); P value <= 0.05 |
| Shek 2012 | PATHS 2012 | Any drug: | Any drug: | NA |
| Cook 1984 | PAY 1984 | Any drug: Marijuana: Hard drugs: | NA | NA |
| Eisen 2002, Eisen 2003 | SKILLS FOR ADOL 2002 | Marijuana: Other illicit substances: | NA | NA |
| Marijuana: | Marijuana: Crack cocaine: favours intervention, NS | NA | ||
| Hansen 1988 | SMART 1988 | Marijuana: LFU favours controls; P value <= 0.05 | NA | NA |
| Sexter 1984 | Sexter 1984 | Marijuana: Other drugs: Hard drugs: | NA | NA |
| Johnson 2009 | THINK SMART 2009 | Marijuana: Other drugs: | NA | NA |
| P value <= 0.05: statistically significant | ||||
| Study reference | Programme name Study ID | Outcomes | ||
| Drug use | Intention to use | Knowledge | ||
| Ellickson 1990 | ALERT 2005 (Same intervention led either by adult educators only or adult assisted by teen leaders ‐ versus control) | Marijuana: | NA | NA |
| St Pierre 2005 | ALERT 2005 (Intervention – adult led or adult led and teen assisted ‐ versus control) | Marijuana: | Marijuana: | NA |
| Hansen 1988 | SMART 1988 | Marijuana: | NA | NA |
| Sun 2008 | TND arm A 2008 | Marijuana: Hard drugs: | NA | NA |
| P value <= 0.05: statistically significant | ||||
| Study reference | Programme name Study ID | Outcomes | ||
| Drug use | Intention to use | Knowledge | ||
| Dent 2001 | TND 2001 | Hard drugs: | NA | NA |
| Sun 2008 | TND arm b 2008 | Marijuana: Hard drugs: | NA | NA |
| P value <= 0.05: statistically significant | ||||
| Study reference | Programme name Study ID | Outcomes | ||
| Drug use | Intention to use | Knowledge | ||
| Sexter 1984 | Sexter 1984 | Marijuana: Other drugs: Hard drugs: | NA | NA |
| LFU: long‐term follow‐up (12+ months) | ||||
| Study reference | Programme name Study ID | Comparison | Outcomes | ||
| Drug use | Intention to use | Knowledge | |||
| Berstein 1987 | ASAP 1987 | Trigger‐based programme (visit to emergency department and detention centre) versus usual curricula | NA | NA | Consequences of drug use, NS |
| Furr Holden 2004 | GOOD BEHAVIOR GAME (GBG) 2004 | GBG (Classroom‐centred intervention (CC) and Family‐school partnership intervention) versus curricular intervention | Marijuana: Hard drugs: | NA | NA |
| Kellam 2012 | GOOD BEHAVIOR GAME (GBG) 2012 | GBG versus no intervention | Drug abuse and dependence: (19% GBG versus 38% controls, P value = 0.01) | NA | NA |
| Sexter 1984 | Sexter 1984 | Parent effectiveness model, network model versus no intervention | Marijuana: Other drugs: Hard drugs: | NA | NA |
| P value <= 0.05: statistically significant | |||||
| Study reference | Programme name Study ID | Comparison | Outcomes | ||
| Drug use | Intention to use | Knowledge | |||
| Malvin 1985 | CROSS AGE TUTORING 1985 | Other (students were taught tutoring and communication skills and tutored elementary students) versus other (same graders were taught business and interpersonal skills and operated an on‐campus store) | NA | NA | SFU: NS LFU: NS |
| Botvin 1994 | LST 1994 | LST versus a culturally focused programme | NA | Marijuana: Other drugs:SFU in favour of programme, P value <= 0.05 | Marijuana: |
| McCambridge 2011 | MOTIVATIONAL INTERVIEW (MI) 2011 | Motivational interview versus knowledge | Marijuana: | NA | NA |
| Werch 2011 | PROJECT ACTIVE 2011 | One‐to‐one consultation about physical activity versus a booklet | Marijuana: | NA | NA |
| Werch 2005 | PROJECT SPORT 2005 | Brief consultation and in‐person health behaviour screen versus wellness brochure | Marijuana: | NA | NA |
| Jones 1995 | REHEARSAL PLUS 1995 | Skills‐based programme versus general information | NA | NA | SFU in favour of treatment, P value <= 0.05 |
| Hansen 1991 | SMART 1991 | Social competence versus social influence programmes | Marijuana: | NA | NA |
| Hansen 1991 | SMART 1991 | Social competence versus combined (social competence + social influence) | Marijuana: | NA | NA |
| Hansen 1991 | SMART 1991 | Social influence versus combined (social competence + social influence) | Marijuana: LFU in favour of combined; P value <= 0.05 | NA | NA |
| Hansen 1991 | SMART 1991 | Social competence and social influence versus knowledge | Marijuana: | NA | NA |
| P value <= 0.05: statistically significant | |||||
| Study reference | Name of the programme Study ID | Duration (months) | N. of sessions | Deliverer | Time of outcome assessment (from programme end) | Drug use | Intention to use | Knowledge | Data for meta‐analysis |
| Snow 1992 | Adolescent Decision‐Making (ADM 1992) | 3 | 12 | Not Reported | 24 months | Marijuana, hard drugs | no | no | yes |
| Guo 2010 | CMER 2010 | 3 | 6 | Teacher | 3 months | Any drug | no | yes | yes |
| Perry 2003 | DARE 2003 | 10 | 10 | Police officer | Post‐test | Marijuana, any drug | no | no | no |
| Perry 2003 | DARE + DARE plus 2003 | 4 + extra school activities | 1 | Police officer, teacher | Post‐test | Marijuana, any drug | no | no | no |
| Ringwalt 1991 | DARE 1991 b | 4 | 17 | Law officer | Post‐test | Other drugs | no | no | yes |
| Clayton 1991 | DARE 1991 | 4 | Not Reported | Project staff | Post‐test, 1 months, 2 months, 5 monhts and 10 years | Marijuana 30 days, past year | no | no | no |
| Hecht 1993 | Drug Resistance Strategies (DRS 1993) | < 1 | 2 | Project staff | Post‐test (1 day) | Marijuana, other drugs | yes | no | no |
| Bond 2004 | GATEHOUSE 2004 | 3 | 20 | Project staff | Post‐test, 12, 24 | Marijuana in the past 6 months | no | no | yes |
| Werch 1991 | KACM 1991 | 1 | 4 | Project staff, teacher | Post‐test | Marijuana | yes | yes | no |
| Hecht 2003 | KEEPIN’IT REAL 2003 | 18 | 10 | Teacher | Post‐test , 8 months, 14 months | Marijuana | no | no | no |
| Hecht 2008 | KEEPIN’IT REAL 2008 | 18 | 12 + 3 ‐ 6 boosters | Teacher | Post‐test | Any drug | yes | no | yes |
| Elek 2010 | KEEPIN’IT REAL 2010 | 18 | 15 | Not Reported | 12 months | Any drug | yes | no | no |
| Botvin 1984 | LST 1984 | 24 | 20 (+ 10 boosters) | Teacher/peer | Post‐test, 12 months | Marijuana 30 days | no | yes | no |
| Botvin 1990 | LST 1990 | 36 | 15 (+ 15 boosters) | Teacher/project staff | Post‐test, 36 months | Marijuana 30 days | no | no | yes |
| Botvin 2001 | LST 2001 | 2 school years | 15 + 10 boosters | Teacher | Post‐test | Marijuana frequency, not clear in which period; other drugs, same as above | yes | yes | yes |
| Seal 2006 | LST 2006 | Not Reported | 10 | Not Reported | 6 months | NR | no | yes | no |
| Resnicow 2008 | LST and KEPT LEFT 2008 | 24 | 16 LST and 16 KEPT LEFT | Teacher | Post‐test | Marijuana, hard drugs | no | no | yes |
| Moskovitz 1984 | NAPA 1984 | 4 | 12 | Project staff | Post‐test, follow‐up (5 months) | no | no | yes | no |
| Shek 2012 | PATHS 2012 | 36 | 120 (40 every school year) | Teacher and social worker | Process evaluation year 1 to 3 (wave 1 to 6). 3 and 12 months after the end (wave 7, 8) | Legal and illegal (ketamine, cannabis, ecstasy, heroine) | yes | no | no |
| Cook 1984 | PAY 1984 | 6 | 48 | Project staff/teacher | Post‐test | Marijuana, hard drugs, other drugs | no | no | no |
| Beets 2009 | POSITIVE ACTION 2009 | 60 | 700 | Teacher | Post‐test | Any drug lifetime use | no | no | yes |
| Hurry 1997 | PROJECT CHARLIE 1997 | 12 | 40 | Teacher | Post‐test | no | yes | yes | yes |
| Corbin 1993 | REHEARSAL PLUS | < 1 | 3 | Psychology majors | Post‐test, 3 | no | no | yes | yes |
| Jones 1995 | REHEARSAL PLUS | < 1 | 3 | Undergraduate psychology majors | Post‐test | no | no | yes | yes |
| Sexter 1984 | Sexter 1984 | 6 | Not Rerported | Not Reported | 6 months | Marijuana, other drugs | no | no | no |
| Eisen 2002 | SKILLS FOR ADOL 2002 | 12 | 40 | Teacher | 12,months 24 months | Marijuana, other drugs | no | no | no |
| Hansen 1988 | SMART 1988 | Not Reported | 12 | Project staff, teacher + peer | 12 months, 24 months since programme beginning | Marijuana | no | no | no |
| Johnson 2009 | THINK SMART 2009 | 6 | 15 (12 + 3 boosters) | Teacher | Post‐test (wave 2), 6 m (wave 3) | Marijuana, other drugs | no | yes | no |
| m: months | |||||||||
| Study reference | Name of the program Study ID | Duration (months) | N. of sessions | Deliverer | Time of outcome assessment (from programme end) | Drug use | Intention to use | Knowledge | Data for meta‐analysis |
| Ellickson 1990 | ALERT 1990 | 2 school years | 8 + 3 (boosters) | 1. Educator + peer 2. Educator alone | Post‐test, 3 months | Marijuana | yes | yes | no |
| Ellickson 2003 | ALERT 2003 | 18 | 14 | Teacher | Post‐test | Marijuana | no | no | yes |
| St Pierre 2005 | ALERT 2005 | 2 school years | 14 | Project staff + peer | Post‐test, 12 monhts | Marijuana, 30 days use | no | no | no |
| Ringwalt 2009 | ALERT 2009 | 2 school years | 14 | Teacher | Post‐test, 12 months | Marijuana, 30 days use, Other drugs, 30 days use | no | no | yes |
| Copeland 2010 | ATD 2010 | 18 | Not Reported | Teacher | Post‐test | Marijuana | no | no | yes |
| Newton 2009 | CLIMATE 2009 | 6 | 12 | Teacher | Post‐test, 6 months, 12 months | Marijuana, 30 days use | no | yes | yes |
| Hansen 1988 | SMART 1998 | NR | 12 | Project staff, teacher + peer | 12 months, 24 months from programme beginning | Marijuana | no | no | no |
| Sun 2008 | TND 2008 Arm A | 1 | 12 | Project staff and teacher | 12 moths | Marijuana, 30 days use | no | no | no |
| m: months | |||||||||
| Study reference | Name of the programme Study ID | Duration (months) | N. of sessions | Deliverer | Time of outcome assessment (from programme end) | Drug use | Intention to use | Knowledge | Data for meta‐analysis |
| Sloboda 2009 | TCYL 2009 | 2 school years | 10 + 7 (booster) | Project staff | 24 months | Marijuana, 30 days | no | no | yes |
| Sussman 1998 and Sun 2006 | TND 1998 | 1 | 9 | Project staff | Post‐test, 12, 48 months | Marijuana, 30 days | no | no | yes |
| Dent 2001 | TND 2001 | 1 | 9 | Project staff | 12 months | Marijuana, 30 days | no | no | yes |
| Sussman 2002 | TND 2002 | 1 | 12 | Project staff | 24 months | Marijuana, 30 days | no | no | yes |
| Sun 2008 | TND 2008 Arm B | 1 | 12 | Project staff and teacher | 12 months | Marijuana, 30 days | no | no | no |
| Faggiano 2010 | UNPLUGGED 2008 | 3 | 12 | Teacher + peer | 3 months, 12 months | Marijuana, 30 days | no | no | yes |
| Gabrhelik 2012 | UNPLUGGED 2012 | 1 school year | 12 | Teacher | Post‐test, 3moths, 12 months, 15 mnths, 24 months | Marijuana, 30 days Lifetime any drugs use including marijuana | no | no | yes |
| Study reference | Name of the programme Study ID | Duration (months) | N. of sessions | Deliverer | Time of outcome assessment (from programme end) | Drug use | Intention to use | Knowledge | Data for meta‐analysis |
| Sexter 1984 | Sexter 1984 | 6 | Not Reported | Not Reported | Post‐test | Marijuana, other drugs | no | no | no |
| Sigelman 2003 | Sigelman 2003 | < 1 | 3 | Project staff | Post‐test | no | yes | yes | yes |
| Study reference | Name of the programme Study ID | Comparison | Duration (months): D N. of sessions: N | Deliverer | Time of outcome assessment (from programme end) | Drug use | Intention to use | Knowledge | Data for meta‐analysis |
| Berstein 1987 | ASAP 1987 | Trigger‐based programme (visit to emergency department and detention centre) versus usual curricula | D: 6 N: Not Reported | Project staff | Post‐test, 8 months | Any drugs | no | yes | Meta‐analysis not performed due to high heterogeneity |
| Furr Holden 2004 | GOOD BEHAVIOR GAME (GBG) 2004 | GBG versus curricular intervention | D: 12 N: Not Reported | Teacher | 5 years, 6 years, 7 years | Marijuana, other drugs, hard drugs | no | no | Meta‐analysis not performed due to high heterogeneity |
| Kellam 2012 | GOOD BEHAVIOR GAME (GBG) 2012 | GBG versus no intervention | D: 24 N: 3 times/week for 10 minutes, increasing in duration to 40 minutes | Trained teacher | 15 years | CIDI‐UM modified to reflect DSM‐IV diagnostic criteria was used to determine the lifetime, past year and past month occurrence of drug abuse and dependence disorders | no | no | Meta‐analysis not performed due to high heterogeneity |
| Sexter 1984 | Sexter 1984 | Parent effectiveness model, network model versus no intervention | D: 6 N: Not Reported | Not Reported | Post‐test | Marijuana, other drugs | no | no | Meta‐analysis not performed due to high heterogeneity |
| CIDI‐UM: Composite International Diagnostic Interview ‐ University of Michigan (scale for occurrence of drug abuse and dependece disordes) DSM‐IV: Diagnostic and Statistical Manual of Mental Disorders, 4th Edition | |||||||||
| Study reference | Name of the programme Study ID | Comparison | Duration (months): D Number of sessions: N | Deliverer | Time of outcome assessment (from programme end) | Drug use | Intention to use | Knowledge | Data for meta‐analysis | |
| Malvin 1985 | CROSS AGE TUTORING/SCHOOL STORE | Other (students were taught tutoring and communication skills and tutored elementary students) versus other (same graders were taught business and interpersonal skills and operated an on‐campus store) | D: 6 N: Not Reported | Project staff | Post‐test, 12 months | Any drug | no | yes | Meta‐analysis not performed due to high heterogeneity | |
| Botvin 1994 | LST 1994 | LST versus a culturally focused programme | D: 7 N: 15 | Project staff + peer | Post‐test, 18 months | no | yes | yes | Meta‐analysis not performed due to high heterogeneity | |
| McCambridge 2011 | MOTIVATIONAL INTERVIEW | Motivational interview versus knowledge | D: 1 hour N: 1 | Not reported | 3 months ,12 months | Marijuana | no | no | Meta‐analysis not performed due to high heterogeneity | |
| Hansen 1991 | SMART 1991 | Social competence versus social influence programmes | D: Not Reported N: 9 | Project staff | 12 months, 24 months | Marijuana | no | no | Meta‐analysis not performed due to high heterogeneity | |
| Hansen 1991 | SMART 1991 | Social competence versus combined (social competence + social influence) | D: Not Reported N: 9 | Project staff | 12 months, 24 months | Marijuana | no | no | Meta‐analysis not performed due to high heterogeneity | |
| Hansen 1991 | SMART 1991 | Social influence versus combined (social competence + social influence) | D: Not Reported N: 9 | Project staff | 12 months, 24 months | Marijuana | no | no | Meta‐analysis not performed due to high heterogeneity | |
| Hansen 1991 | SMART 1991 | Social competence and social influence versus knowledge | D:Not Reported N: Not Reported | Project staff | 12 months, 24 months | Marijuana | no | no | Meta‐analysis not performed due to high heterogeneity | |
| Werch 2011 | PROJECT ACTIVE 2011 | One‐to‐one consultation about physical activity versus a booklet | D: 1 day N: 1 | Not reported | 3 months | Marijuana | no | no | Meta‐analysis not performed due to high heterogeneity | |
| Werch 2005 | PROJECT SPORT 2005 | Brief consultation and in‐person health behaviour screen versus wellness brochure | D: 1 day N: 1 | Project staff | 3 months, 12 months | Marijuana | no | no | Meta‐analysis not performed due to high heterogeneity | |
| Jones 1990 | REHEARSAL PLUS 1990 | Skills‐based programme versus general information | D: 2 days N: 2 | Project staff | Post‐test | no | no | yes | Meta‐analysis not performed due to high heterogeneity | |
| LST: Life Skill Training | ||||||||||
| Outcome or subgroup title | No. of studies | No. of participants | Statistical method | Effect size |
| 1 Marijuana use < 12 months Show forest plot | 4 | 9456 | Risk Ratio (M‐H, Random, 95% CI) | 0.90 [0.81, 1.01] |
| 2 Marijuana use < 12 months Show forest plot | 1 | 3417 | Mean Difference (IV, Fixed, 95% CI) | ‐0.10 [‐0.20, ‐0.00] |
| 3 Marijuana use ≥ 12 months Show forest plot | 1 | 2678 | Risk Ratio (M‐H, Random, 95% CI) | 0.86 [0.74, 1.00] |
| 4 Marijuana use ≥ 12 months Show forest plot | 1 | 1075 | Mean Difference (IV, Fixed, 95% CI) | ‐0.02 [‐0.10, 0.06] |
| 5 Hard drug use < 12 months Show forest plot | 1 | 2090 | Risk Ratio (M‐H, Fixed, 95% CI) | 0.69 [0.40, 1.18] |
| 6 Hard drugs use ≥ 12 months Show forest plot | 1 | 1075 | Mean Difference (IV, Fixed, 95% CI) | ‐0.01 [‐0.06, 0.04] |
| 7 Other drug use < 12 months Show forest plot | 1 | 1270 | Risk Ratio (M‐H, Fixed, 95% CI) | 0.72 [0.53, 0.98] |
| 8 Other drugs use < 12 months Show forest plot | 1 | 3434 | Mean Difference (IV, Fixed, 95% CI) | ‐0.05 [‐0.11, 0.01] |
| 9 Any drug use < 12 months Show forest plot | 2 | 2512 | Risk Ratio (M‐H, Random, 95% CI) | 0.27 [0.14, 0.51] |
| 10 Any drug use < 12 months Show forest plot | 1 | 1566 | Mean Difference (IV, Fixed, 95% CI) | 0.02 [‐0.05, 0.09] |
| 11 Drug knowledge < 12 months Show forest plot | 4 | 3593 | Std. Mean Difference (IV, Random, 95% CI) | 1.02 [0.11, 1.93] |
| 11.1 Rehearsal plus | 2 | 91 | Std. Mean Difference (IV, Random, 95% CI) | 1.72 [1.19, 2.24] |
| 11.2 Other programs | 2 | 3502 | Std. Mean Difference (IV, Random, 95% CI) | 0.34 [‐0.43, 1.11] |
| 12 Intention to use marijuana < 12 months Show forest plot | 1 | 3417 | Mean Difference (IV, Fixed, 95% CI) | ‐0.12 [‐0.19, ‐0.05] |
| 13 Intention to use hard drugs < 12 months Show forest plot | 1 | 3417 | Mean Difference (IV, Fixed, 95% CI) | ‐0.01 [‐0.04, 0.02] |
| 14 Intention to use other drugs < 12 months Show forest plot | 1 | 3417 | Mean Difference (IV, Fixed, 95% CI) | ‐0.04 [‐0.07, ‐0.01] |
| 15 Intention to use any drug < 12 months Show forest plot | 1 | 120 | Risk Ratio (M‐H, Fixed, 95% CI) | 0.21 [0.02, 1.84] |
| 16 Intention to use any drug < 12 months Show forest plot | 1 | 1566 | Mean Difference (IV, Fixed, 95% CI) | 0.04 [‐0.07, 0.15] |
| Outcome or subgroup title | No. of studies | No. of participants | Statistical method | Effect size |
| 1 Marijuana use < 12 months Show forest plot | 3 | 10716 | Risk Ratio (M‐H, Random, 95% CI) | 0.88 [0.72, 1.07] |
| 1.1 Alert | 2 | 10138 | Risk Ratio (M‐H, Random, 95% CI) | 0.82 [0.69, 0.97] |
| 1.2 Other programs | 1 | 578 | Risk Ratio (M‐H, Random, 95% CI) | 1.12 [0.79, 1.58] |
| 2 Marijuana use < 12 months Show forest plot | 1 | 764 | Mean Difference (IV, Fixed, 95% CI) | ‐0.26 [‐0.48, ‐0.04] |
| 3 Marijuana use ≥ 12 months Show forest plot | 1 | 5862 | Risk Ratio (M‐H, Fixed, 95% CI) | 0.95 [0.81, 1.13] |
| 4 Marijuana use ≥12 months Show forest plot | 1 | 764 | Mean Difference (IV, Fixed, 95% CI) | ‐0.22 [‐0.46, 0.02] |
| 5 Other drug use < 12 months Show forest plot | 1 | 5862 | Risk Ratio (M‐H, Fixed, 95% CI) | 1.08 [0.93, 1.27] |
| 6 Other drugs use ≥ 12 months Show forest plot | 1 | 5862 | Risk Ratio (M‐H, Fixed, 95% CI) | 1.33 [1.13, 1.57] |
| 7 Drug knowledge < 12 months Show forest plot | 1 | 764 | Mean Difference (IV, Fixed, 95% CI) | 1.5 [0.58, 2.42] |
| 8 Drug knowledge ≥ 12 months Show forest plot | 1 | 764 | Mean Difference (IV, Fixed, 95% CI) | 1.65 [0.69, 2.61] |
| Outcome or subgroup title | No. of studies | No. of participants | Statistical method | Effect size |
| 1 Marijuana use < 12 months Show forest plot | 3 | 8701 | Risk Ratio (M‐H, Random, 95% CI) | 0.79 [0.59, 1.05] |
| 1.1 Unplugged | 2 | 8008 | Risk Ratio (M‐H, Random, 95% CI) | 0.68 [0.56, 0.82] |
| 1.2 Other programs | 1 | 693 | Risk Ratio (M‐H, Random, 95% CI) | 0.95 [0.79, 1.14] |
| 2 Marijuana use < 12 months Show forest plot | 1 | 693 | Mean Difference (IV, Fixed, 95% CI) | ‐1.90 [‐5.83, 2.03] |
| 3 Marijuana use ≥ 12 months Show forest plot | 6 | 26910 | Risk Ratio (M‐H, Random, 95% CI) | 0.83 [0.69, 0.99] |
| 3.1 Unplugged | 2 | 7321 | Risk Ratio (M‐H, Random, 95% CI) | 0.47 [0.20, 1.11] |
| 3.2 TND | 3 | 2269 | Risk Ratio (M‐H, Random, 95% CI) | 0.95 [0.83, 1.09] |
| 3.3 Other programmes | 1 | 17320 | Risk Ratio (M‐H, Random, 95% CI) | 0.94 [0.89, 1.00] |
| 4 Marijuana use ≥12 months Show forest plot | 1 | 690 | Mean Difference (IV, Fixed, 95% CI) | ‐0.80 [‐4.39, 2.79] |
| 5 Hard drug use < 12 months Show forest plot | 1 | 693 | Risk Ratio (M‐H, Fixed, 95% CI) | 0.85 [0.63, 1.14] |
| 6 Hard drug use < 12 months Show forest plot | 1 | 693 | Mean Difference (IV, Fixed, 95% CI) | ‐3.1 [‐5.90, ‐0.30] |
| 7 Hard drug use ≥ 12 months Show forest plot | 2 | 1066 | Risk Ratio (M‐H, Random, 95% CI) | 0.86 [0.39, 1.90] |
| 8 Hard drug use ≥ 12 months Show forest plot | 1 | 690 | Mean Difference (IV, Fixed, 95% CI) | 0.30 [‐1.36, 1.96] |
| 9 Any drugs use < 12 months Show forest plot | 1 | 6362 | Risk Ratio (M‐H, Fixed, 95% CI) | 0.76 [0.64, 0.89] |
| Outcome or subgroup title | No. of studies | No. of participants | Statistical method | Effect size |
| 1 Drug knowledge < 12 months Show forest plot | 1 | 165 | Mean Difference (IV, Random, 95% CI) | 0.10 [0.05, 0.15] |
| 2 Intention to use hard drugs < 12 months Show forest plot | 1 | 165 | Mean Difference (IV, Fixed, 95% CI) | ‐0.05 [‐0.24, 0.14] |