Scolaris Content Display Scolaris Content Display

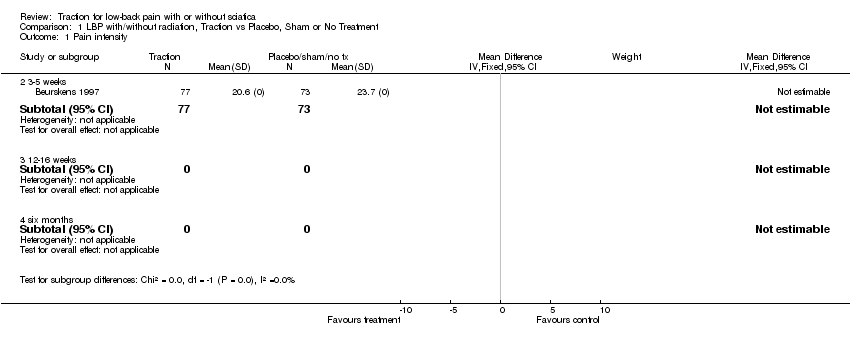
Comparison 1 LBP with/without radiation, Traction vs Placebo, Sham or No Treatment, Outcome 1 Pain intensity.
Figuras y tablas -
Analysis 1.1

Comparison 1 LBP with/without radiation, Traction vs Placebo, Sham or No Treatment, Outcome 1 Pain intensity.

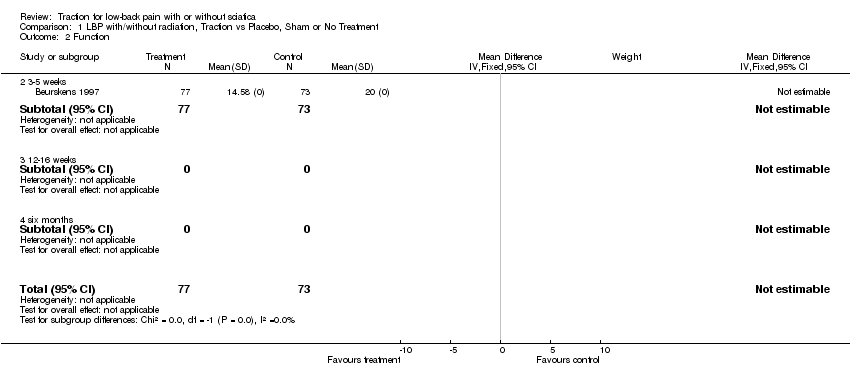
Comparison 1 LBP with/without radiation, Traction vs Placebo, Sham or No Treatment, Outcome 2 Function.
Figuras y tablas -
Analysis 1.2

Comparison 1 LBP with/without radiation, Traction vs Placebo, Sham or No Treatment, Outcome 2 Function.

Comparison 1 LBP with/without radiation, Traction vs Placebo, Sham or No Treatment, Outcome 3 Work absence.
Figuras y tablas -
Analysis 1.3

Comparison 1 LBP with/without radiation, Traction vs Placebo, Sham or No Treatment, Outcome 3 Work absence.

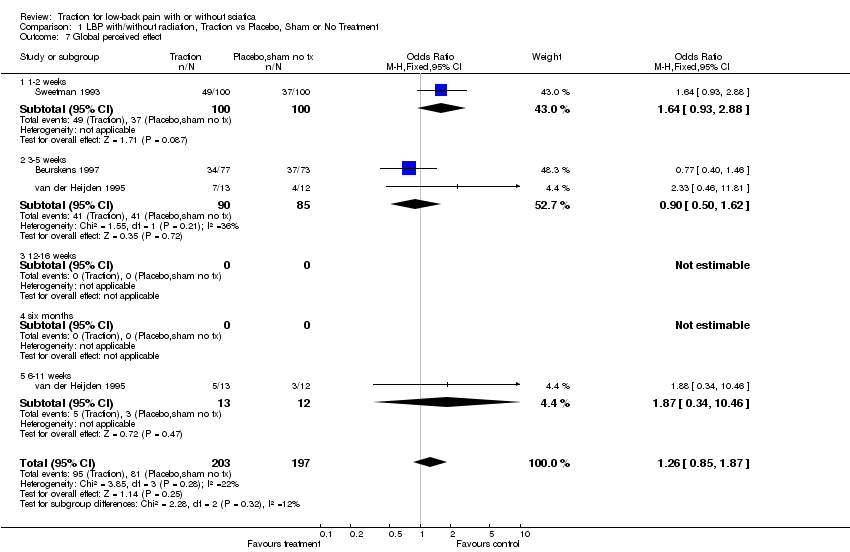
Comparison 1 LBP with/without radiation, Traction vs Placebo, Sham or No Treatment, Outcome 7 Global perceived effect.
Figuras y tablas -
Analysis 1.7

Comparison 1 LBP with/without radiation, Traction vs Placebo, Sham or No Treatment, Outcome 7 Global perceived effect.

Comparison 2 LBP with/without radiation, Traction vs Physiotherapy, Outcome 2 Global.
Figuras y tablas -
Analysis 2.2

Comparison 2 LBP with/without radiation, Traction vs Physiotherapy, Outcome 2 Global.

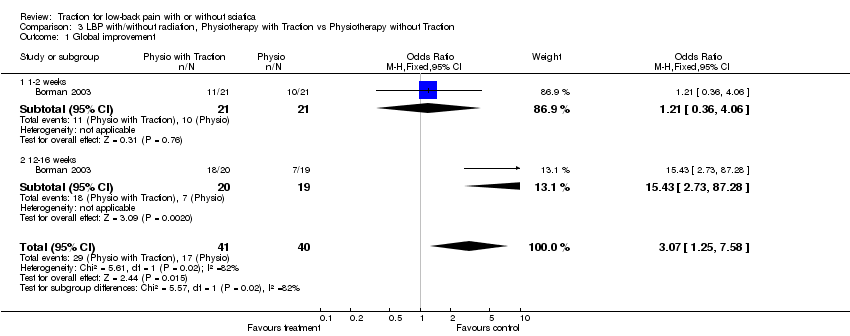
Comparison 3 LBP with/without radiation, Physiotherapy with Traction vs Physiotherapy without Traction, Outcome 1 Global improvement.
Figuras y tablas -
Analysis 3.1

Comparison 3 LBP with/without radiation, Physiotherapy with Traction vs Physiotherapy without Traction, Outcome 1 Global improvement.

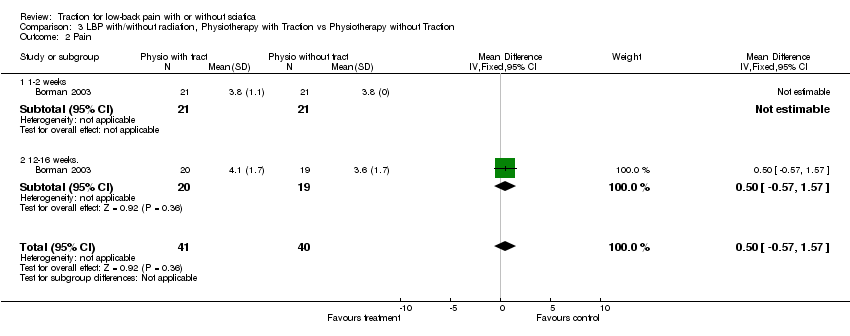
Comparison 3 LBP with/without radiation, Physiotherapy with Traction vs Physiotherapy without Traction, Outcome 2 Pain.
Figuras y tablas -
Analysis 3.2

Comparison 3 LBP with/without radiation, Physiotherapy with Traction vs Physiotherapy without Traction, Outcome 2 Pain.

Comparison 3 LBP with/without radiation, Physiotherapy with Traction vs Physiotherapy without Traction, Outcome 3 Function.
Figuras y tablas -
Analysis 3.3

Comparison 3 LBP with/without radiation, Physiotherapy with Traction vs Physiotherapy without Traction, Outcome 3 Function.

Comparison 4 LBP with/without radiation Traction vs Exercise, Outcome 1 Pain.
Figuras y tablas -
Analysis 4.1

Comparison 4 LBP with/without radiation Traction vs Exercise, Outcome 1 Pain.

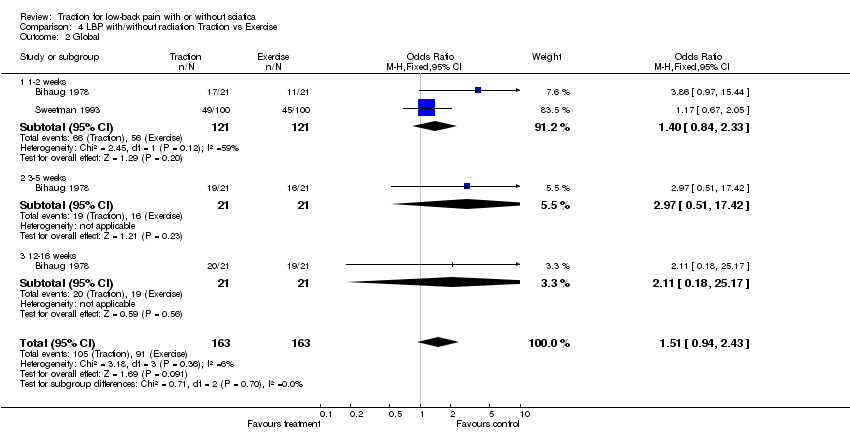
Comparison 4 LBP with/without radiation Traction vs Exercise, Outcome 2 Global.
Figuras y tablas -
Analysis 4.2

Comparison 4 LBP with/without radiation Traction vs Exercise, Outcome 2 Global.

Comparison 5 LBP with/without radiation, Two types of traction, Outcome 1 Autotraction vs Mechanical traction.
Figuras y tablas -
Analysis 5.1

Comparison 5 LBP with/without radiation, Two types of traction, Outcome 1 Autotraction vs Mechanical traction.

Comparison 5 LBP with/without radiation, Two types of traction, Outcome 2 Static vs Intermittent traction.
Figuras y tablas -
Analysis 5.2

Comparison 5 LBP with/without radiation, Two types of traction, Outcome 2 Static vs Intermittent traction.

Comparison 6 LBP with/without radiation, Traction vs Interferential therapy, Outcome 1 Function.
Figuras y tablas -
Analysis 6.1

Comparison 6 LBP with/without radiation, Traction vs Interferential therapy, Outcome 1 Function.

Comparison 6 LBP with/without radiation, Traction vs Interferential therapy, Outcome 2 Pain.
Figuras y tablas -
Analysis 6.2

Comparison 6 LBP with/without radiation, Traction vs Interferential therapy, Outcome 2 Pain.

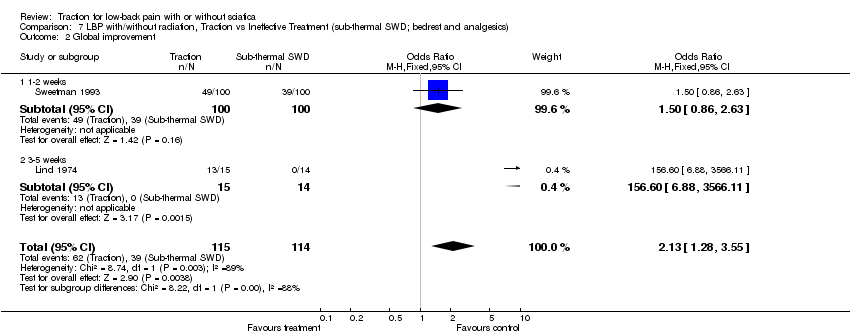
Comparison 7 LBP with/without radiation, Traction vs Ineffective Treatment (sub‐thermal SWD; bedrest and analgesics), Outcome 2 Global improvement.
Figuras y tablas -
Analysis 7.2

Comparison 7 LBP with/without radiation, Traction vs Ineffective Treatment (sub‐thermal SWD; bedrest and analgesics), Outcome 2 Global improvement.

Comparison 8 LBP with/without radiation, Underwater traction vs Underwater massage, Outcome 1 Pain.
Figuras y tablas -
Analysis 8.1

Comparison 8 LBP with/without radiation, Underwater traction vs Underwater massage, Outcome 1 Pain.

Comparison 9 LBP with/without radiation, Underwater traction vs Balneotherapy, Outcome 1 Pain.
Figuras y tablas -
Analysis 9.1

Comparison 9 LBP with/without radiation, Underwater traction vs Balneotherapy, Outcome 1 Pain.

Comparison 10 LBP with/without radiation, Underwater Traction vs No treatment, Outcome 1 Pain.
Figuras y tablas -
Analysis 10.1

Comparison 10 LBP with/without radiation, Underwater Traction vs No treatment, Outcome 1 Pain.

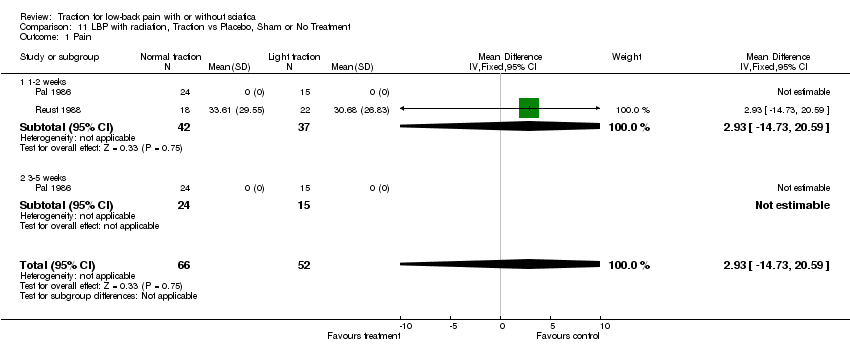
Comparison 11 LBP with radiation, Traction vs Placebo, Sham or No Treatment, Outcome 1 Pain.
Figuras y tablas -
Analysis 11.1

Comparison 11 LBP with radiation, Traction vs Placebo, Sham or No Treatment, Outcome 1 Pain.

Comparison 11 LBP with radiation, Traction vs Placebo, Sham or No Treatment, Outcome 3 Global improvement.
Figuras y tablas -
Analysis 11.3

Comparison 11 LBP with radiation, Traction vs Placebo, Sham or No Treatment, Outcome 3 Global improvement.

Comparison 11 LBP with radiation, Traction vs Placebo, Sham or No Treatment, Outcome 4 RTW.
Figuras y tablas -
Analysis 11.4

Comparison 11 LBP with radiation, Traction vs Placebo, Sham or No Treatment, Outcome 4 RTW.

Comparison 11 LBP with radiation, Traction vs Placebo, Sham or No Treatment, Outcome 5 Back pain improvement after treatment.
Figuras y tablas -
Analysis 11.5

Comparison 11 LBP with radiation, Traction vs Placebo, Sham or No Treatment, Outcome 5 Back pain improvement after treatment.

Comparison 11 LBP with radiation, Traction vs Placebo, Sham or No Treatment, Outcome 6 Leg pain improvement after treatment.
Figuras y tablas -
Analysis 11.6

Comparison 11 LBP with radiation, Traction vs Placebo, Sham or No Treatment, Outcome 6 Leg pain improvement after treatment.

Comparison 11 LBP with radiation, Traction vs Placebo, Sham or No Treatment, Outcome 7 Number of patients pain‐free.
Figuras y tablas -
Analysis 11.7

Comparison 11 LBP with radiation, Traction vs Placebo, Sham or No Treatment, Outcome 7 Number of patients pain‐free.

Comparison 12 LBP with radiation, Traction vs Physiotherapy, Outcome 1 Global improvement.
Figuras y tablas -
Analysis 12.1

Comparison 12 LBP with radiation, Traction vs Physiotherapy, Outcome 1 Global improvement.

Comparison 13 LBP with radiation, Traction vs Exercise, Outcome 1 Global improvement.
Figuras y tablas -
Analysis 13.1

Comparison 13 LBP with radiation, Traction vs Exercise, Outcome 1 Global improvement.

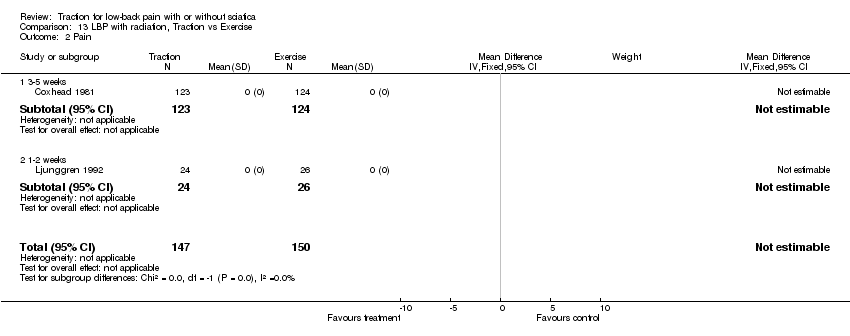
Comparison 13 LBP with radiation, Traction vs Exercise, Outcome 2 Pain.
Figuras y tablas -
Analysis 13.2

Comparison 13 LBP with radiation, Traction vs Exercise, Outcome 2 Pain.

Comparison 13 LBP with radiation, Traction vs Exercise, Outcome 3 RTW.
Figuras y tablas -
Analysis 13.3

Comparison 13 LBP with radiation, Traction vs Exercise, Outcome 3 RTW.

Comparison 13 LBP with radiation, Traction vs Exercise, Outcome 4 Function.
Figuras y tablas -
Analysis 13.4

Comparison 13 LBP with radiation, Traction vs Exercise, Outcome 4 Function.

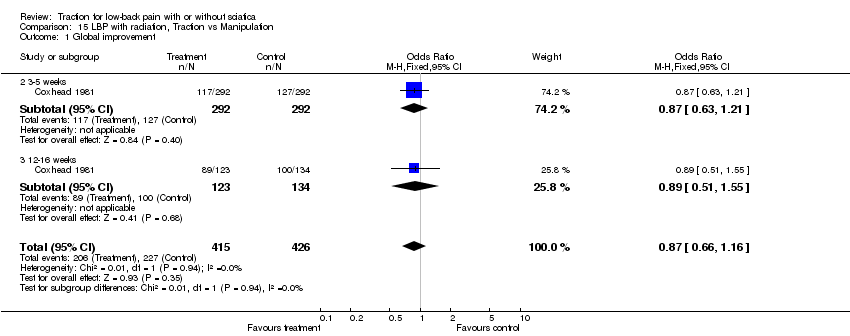
Comparison 15 LBP with radiation, Traction vs Manipulation, Outcome 1 Global improvement.
Figuras y tablas -
Analysis 15.1

Comparison 15 LBP with radiation, Traction vs Manipulation, Outcome 1 Global improvement.

Comparison 15 LBP with radiation, Traction vs Manipulation, Outcome 2 Pain.
Figuras y tablas -
Analysis 15.2

Comparison 15 LBP with radiation, Traction vs Manipulation, Outcome 2 Pain.

Comparison 15 LBP with radiation, Traction vs Manipulation, Outcome 3 RTW.
Figuras y tablas -
Analysis 15.3

Comparison 15 LBP with radiation, Traction vs Manipulation, Outcome 3 RTW.

Comparison 16 LBP with radiation, Traction vs Corset, Infrared, Outcome 1 Global improvement.
Figuras y tablas -
Analysis 16.1

Comparison 16 LBP with radiation, Traction vs Corset, Infrared, Outcome 1 Global improvement.

Comparison 16 LBP with radiation, Traction vs Corset, Infrared, Outcome 2 Pain.
Figuras y tablas -
Analysis 16.2

Comparison 16 LBP with radiation, Traction vs Corset, Infrared, Outcome 2 Pain.

Comparison 16 LBP with radiation, Traction vs Corset, Infrared, Outcome 3 RTW.
Figuras y tablas -
Analysis 16.3

Comparison 16 LBP with radiation, Traction vs Corset, Infrared, Outcome 3 RTW.

Comparison 16 LBP with radiation, Traction vs Corset, Infrared, Outcome 4 Pain.
Figuras y tablas -
Analysis 16.4

Comparison 16 LBP with radiation, Traction vs Corset, Infrared, Outcome 4 Pain.

Comparison 17 LBP with radiation, Autotraction vs Manual traction, Outcome 1 Pain.
Figuras y tablas -
Analysis 17.1

Comparison 17 LBP with radiation, Autotraction vs Manual traction, Outcome 1 Pain.

Comparison 17 LBP with radiation, Autotraction vs Manual traction, Outcome 2 Global improvement.
Figuras y tablas -
Analysis 17.2

Comparison 17 LBP with radiation, Autotraction vs Manual traction, Outcome 2 Global improvement.

Table 1. Methodological quality assessment criteria (van Tulder 2003)

1. Was the method of randomisation adequate? A random (unpredictable) assignment sequence. Examples of adequate methods are computer generated random number table and use of sealed opaque envelopes. Methods of allocation using date of birth, date of admission, hospital numbers, or alternation should not be regarded as appropriate.

2. Was the treatment allocation concealed? Assignment generated by an independent person not responsible for determining the eligibility of the patients. This person has no information about the persons included in the trial and has no influence on the assignment sequence or on the decision about eligibility of the patient.

3. Were the groups similar at baseline regarding the most important prognostic indicators? In order to receive a "yes," groups have to be similar at baseline regarding demographic factors, duration and severity of complaints, percentage of patients with neurologic symptoms, and value of main outcome measure(s).

4. Was the outcome assessor blinded to the intervention? Was the blinding evaluated and adequate? If only self‐reported (by the patients) outcome measures are used, and the patients have not been blinded, and no outcomes are measured by an observer, then score "negative"; if the patients have been successfully blinded, it is scored "positive".

5. Was the patient blinded to the intervention? The review author determines if enough information about the blinding is given in order to score a "yes."

6. Was the care provider blinded to the intervention? The review author determines if enough information about the blinding is given in order to score a "yes."

7. Were co‐interventions avoided or similar? Co‐interventions should either be avoided in the trial design or be similar between the index and control groups.

8. Was the compliance acceptable in all groups? The review author determines if the compliance to the interventions is acceptable, based on the reported intensity, duration, number and frequency of sessions for both the index intervention and control intervention(s).

9. Was the intervention drop‐out rate described and acceptable? If the percentage of withdrawals and drop‐outs during the intervention period does not exceed 20% and does not lead to substantial bias a "yes" is scored.

10. Was the follow‐up drop‐out rate described and acceptable? If the percentage of withdrawals and drop‐outs does not exceed 20% for follow‐ups and does not lead to substantial bias a "yes" is scored.

11. Did the analysis include an intention‐to‐treat analysis? All randomized patients are reported/analyzed in the group they were allocated to by randomization for the most important moments of effect measurement (minus missing values) irrespective of noncompliance and co‐interventions.

Figuras y tablas -
Table 1. Methodological quality assessment criteria (van Tulder 2003)
Comparison 1. LBP with/without radiation, Traction vs Placebo, Sham or No Treatment

Outcome or subgroup title

No. of studies

No. of participants

Statistical method

Effect size

1 Pain intensity Show forest plot

1

Mean Difference (IV, Fixed, 95% CI)

Subtotals only

1.2 3‐5 weeks

1

150

Mean Difference (IV, Fixed, 95% CI)

0.0 [0.0, 0.0]

1.3 12‐16 weeks

0

0

Mean Difference (IV, Fixed, 95% CI)

0.0 [0.0, 0.0]

1.4 six months

0

0

Mean Difference (IV, Fixed, 95% CI)

0.0 [0.0, 0.0]

2 Function Show forest plot

1

150

Mean Difference (IV, Fixed, 95% CI)

0.0 [0.0, 0.0]

2.2 3‐5 weeks

1

150

Mean Difference (IV, Fixed, 95% CI)

0.0 [0.0, 0.0]

2.3 12‐16 weeks

0

0

Mean Difference (IV, Fixed, 95% CI)

0.0 [0.0, 0.0]

2.4 six months

0

0

Mean Difference (IV, Fixed, 95% CI)

0.0 [0.0, 0.0]

3 Work absence Show forest plot

1

150

Mean Difference (IV, Fixed, 95% CI)

0.0 [0.0, 0.0]

3.1 3‐5 weeks

1

150

Mean Difference (IV, Fixed, 95% CI)

0.0 [0.0, 0.0]

3.2 12‐15 wks

0

0

Mean Difference (IV, Fixed, 95% CI)

0.0 [0.0, 0.0]

3.3 6 months

0

0

Mean Difference (IV, Fixed, 95% CI)

0.0 [0.0, 0.0]

4 Disability

0

0

Mean Difference (IV, Fixed, 95% CI)

0.0 [0.0, 0.0]

4.2 3‐5 weeks

0

0

Mean Difference (IV, Fixed, 95% CI)

0.0 [0.0, 0.0]

7 Global perceived effect Show forest plot

3

400

Odds Ratio (M‐H, Fixed, 95% CI)

1.26 [0.85, 1.87]

7.1 1‐2 weeks

1

200

Odds Ratio (M‐H, Fixed, 95% CI)

1.64 [0.93, 2.88]

7.2 3‐5 weeks

2

175

Odds Ratio (M‐H, Fixed, 95% CI)

0.90 [0.50, 1.62]

7.3 12‐16 weeks

0

0

Odds Ratio (M‐H, Fixed, 95% CI)

0.0 [0.0, 0.0]

7.4 six months

0

0

Odds Ratio (M‐H, Fixed, 95% CI)

0.0 [0.0, 0.0]

7.5 6‐11 weeks

1

25

Odds Ratio (M‐H, Fixed, 95% CI)

1.87 [0.34, 10.46]

Figuras y tablas -
Comparison 1. LBP with/without radiation, Traction vs Placebo, Sham or No Treatment
Comparison 2. LBP with/without radiation, Traction vs Physiotherapy

Outcome or subgroup title

No. of studies

No. of participants

Statistical method

Effect size

2 Global Show forest plot

1

30

Odds Ratio (M‐H, Fixed, 95% CI)

167.4 [7.37, 3801.64]

2.1 3‐5 weeks

1

30

Odds Ratio (M‐H, Fixed, 95% CI)

167.4 [7.37, 3801.64]

Figuras y tablas -
Comparison 2. LBP with/without radiation, Traction vs Physiotherapy
Comparison 3. LBP with/without radiation, Physiotherapy with Traction vs Physiotherapy without Traction

Outcome or subgroup title

No. of studies

No. of participants

Statistical method

Effect size

1 Global improvement Show forest plot

1

81

Odds Ratio (M‐H, Fixed, 95% CI)

3.07 [1.25, 7.58]

1.1 1‐2 weeks

1

42

Odds Ratio (M‐H, Fixed, 95% CI)

1.21 [0.36, 4.06]

1.2 12‐16 weeks

1

39

Odds Ratio (M‐H, Fixed, 95% CI)

15.43 [2.73, 87.28]

2 Pain Show forest plot

1

81

Mean Difference (IV, Fixed, 95% CI)

0.50 [‐0.57, 1.57]

2.1 1‐2 weeks

1

42

Mean Difference (IV, Fixed, 95% CI)

0.0 [0.0, 0.0]

2.2 12‐16 weeks.

1

39

Mean Difference (IV, Fixed, 95% CI)

0.50 [‐0.57, 1.57]

3 Function Show forest plot

1

79

Mean Difference (IV, Fixed, 95% CI)

3.94 [‐0.53, 8.42]

3.1 1‐2 weeks

1

40

Mean Difference (IV, Fixed, 95% CI)

3.90 [‐2.06, 9.86]

3.2 12‐16 weeks

1

39

Mean Difference (IV, Fixed, 95% CI)

4.0 [‐2.78, 10.78]

Figuras y tablas -
Comparison 3. LBP with/without radiation, Physiotherapy with Traction vs Physiotherapy without Traction
Comparison 4. LBP with/without radiation Traction vs Exercise

Outcome or subgroup title

No. of studies

No. of participants

Statistical method

Effect size

1 Pain Show forest plot

1

200

Mean Difference (IV, Fixed, 95% CI)

0.0 [0.0, 0.0]

1.1 1‐2 weeks

1

200

Mean Difference (IV, Fixed, 95% CI)

0.0 [0.0, 0.0]

2 Global Show forest plot

2

326

Odds Ratio (M‐H, Fixed, 95% CI)

1.51 [0.94, 2.43]

2.1 1‐2 weeks

2

242

Odds Ratio (M‐H, Fixed, 95% CI)

1.40 [0.84, 2.33]

2.2 3‐5 weeks

1

42

Odds Ratio (M‐H, Fixed, 95% CI)

2.97 [0.51, 17.42]

2.3 12‐16 weeks

1

42

Odds Ratio (M‐H, Fixed, 95% CI)

2.11 [0.18, 25.17]

Figuras y tablas -
Comparison 4. LBP with/without radiation Traction vs Exercise
Comparison 5. LBP with/without radiation, Two types of traction

Outcome or subgroup title

No. of studies

No. of participants

Statistical method

Effect size

1 Autotraction vs Mechanical traction Show forest plot

1

67

Odds Ratio (M‐H, Fixed, 95% CI)

10.5 [3.31, 33.35]

1.1 Global improvement at 1‐2 weeks

1

67

Odds Ratio (M‐H, Fixed, 95% CI)

10.5 [3.31, 33.35]

2 Static vs Intermittent traction Show forest plot

1

26

Odds Ratio (M‐H, Fixed, 95% CI)

0.73 [0.15, 3.47]

2.1 Pain after treatment

1

26

Odds Ratio (M‐H, Fixed, 95% CI)

0.73 [0.15, 3.47]

Figuras y tablas -
Comparison 5. LBP with/without radiation, Two types of traction
Comparison 6. LBP with/without radiation, Traction vs Interferential therapy

Outcome or subgroup title

No. of studies

No. of participants

Statistical method

Effect size

1 Function Show forest plot

1

266

Mean Difference (IV, Fixed, 95% CI)

‐0.19 [‐3.69, 3.32]

1.1 1‐2 weeks

1

138

Mean Difference (IV, Fixed, 95% CI)

‐0.90 [‐5.74, 3.94]

1.2 12‐16 weeks

1

128

Mean Difference (IV, Fixed, 95% CI)

0.60 [‐4.48, 5.68]

2 Pain Show forest plot

1

186

Mean Difference (IV, Fixed, 95% CI)

18.81 [14.88, 22.75]

2.1 1‐2 weeks

1

101

Mean Difference (IV, Fixed, 95% CI)

‐1.20 [‐6.74, 4.34]

2.2 12‐16 weeks

1

85

Mean Difference (IV, Fixed, 95% CI)

39.2 [33.61, 44.79]

Figuras y tablas -
Comparison 6. LBP with/without radiation, Traction vs Interferential therapy
Comparison 7. LBP with/without radiation, Traction vs Ineffective Treatment (sub‐thermal SWD; bedrest and analgesics)

Outcome or subgroup title

No. of studies

No. of participants

Statistical method

Effect size

2 Global improvement Show forest plot

2

229

Odds Ratio (M‐H, Fixed, 95% CI)

2.13 [1.28, 3.55]

2.1 1‐2 weeks

1

200

Odds Ratio (M‐H, Fixed, 95% CI)

1.50 [0.86, 2.63]

2.2 3‐5 weeks

1

29

Odds Ratio (M‐H, Fixed, 95% CI)

156.6 [6.88, 3566.11]

Figuras y tablas -
Comparison 7. LBP with/without radiation, Traction vs Ineffective Treatment (sub‐thermal SWD; bedrest and analgesics)
Comparison 8. LBP with/without radiation, Underwater traction vs Underwater massage

Outcome or subgroup title

No. of studies

No. of participants

Statistical method

Effect size

1 Pain Show forest plot

1

140

Mean Difference (IV, Fixed, 95% CI)

‐8.9 [‐16.06, ‐1.74]

1.1 3‐5 weeks

1

70

Mean Difference (IV, Fixed, 95% CI)

‐8.90 [‐17.04, ‐0.76]

1.2 1 year

1

70

Mean Difference (IV, Fixed, 95% CI)

‐8.90 [‐23.99, 6.19]

Figuras y tablas -
Comparison 8. LBP with/without radiation, Underwater traction vs Underwater massage
Comparison 9. LBP with/without radiation, Underwater traction vs Balneotherapy

Outcome or subgroup title

No. of studies

No. of participants

Statistical method

Effect size

1 Pain Show forest plot

1

158

Mean Difference (IV, Fixed, 95% CI)

‐6.29 [‐11.90, ‐0.69]

1.1 3‐5 weeks

1

79

Mean Difference (IV, Fixed, 95% CI)

‐7.10 [‐13.52, ‐0.68]

1.2 1 year

1

79

Mean Difference (IV, Fixed, 95% CI)

‐3.70 [‐15.21, 7.81]

Figuras y tablas -
Comparison 9. LBP with/without radiation, Underwater traction vs Balneotherapy
Comparison 10. LBP with/without radiation, Underwater Traction vs No treatment

Outcome or subgroup title

No. of studies

No. of participants

Statistical method

Effect size

1 Pain Show forest plot

1

194

Mean Difference (IV, Fixed, 95% CI)

‐22.33 [‐28.28, ‐16.39]

1.1 3‐5 weeks

1

97

Mean Difference (IV, Fixed, 95% CI)

‐29.10 [‐36.41, ‐21.79]

1.2 1 year

1

97

Mean Difference (IV, Fixed, 95% CI)

‐9.10 [‐19.32, 1.12]

Figuras y tablas -
Comparison 10. LBP with/without radiation, Underwater Traction vs No treatment
Comparison 11. LBP with radiation, Traction vs Placebo, Sham or No Treatment

Outcome or subgroup title

No. of studies

No. of participants

Statistical method

Effect size

1 Pain Show forest plot

2

118

Mean Difference (IV, Fixed, 95% CI)

2.93 [‐14.73, 20.59]

1.1 1‐2 weeks

2

79

Mean Difference (IV, Fixed, 95% CI)

2.93 [‐14.73, 20.59]

1.2 3‐5 weeks

1

39

Mean Difference (IV, Fixed, 95% CI)

0.0 [0.0, 0.0]

3 Global improvement Show forest plot

2

85

Odds Ratio (M‐H, Fixed, 95% CI)

2.05 [0.72, 5.83]

3.1 1‐2 weeks

1

44

Odds Ratio (M‐H, Fixed, 95% CI)

1.13 [0.27, 4.61]

3.2 3‐5 weeks

1

41

Odds Ratio (M‐H, Fixed, 95% CI)

4.5 [0.81, 25.12]

4 RTW Show forest plot

1

39

Odds Ratio (M‐H, Fixed, 95% CI)

2.0 [0.50, 8.00]

4.1 2 years

1

39

Odds Ratio (M‐H, Fixed, 95% CI)

2.0 [0.50, 8.00]

5 Back pain improvement after treatment Show forest plot

1

72

Odds Ratio (M‐H, Fixed, 95% CI)

0.81 [0.32, 2.08]

6 Leg pain improvement after treatment Show forest plot

1

72

Odds Ratio (M‐H, Fixed, 95% CI)

1.25 [0.50, 3.16]

7 Number of patients pain‐free Show forest plot

1

163

Odds Ratio (M‐H, Fixed, 95% CI)

2.12 [1.12, 4.02]

7.1 3‐5 weeks

1

82

Odds Ratio (M‐H, Fixed, 95% CI)

3.93 [1.47, 10.53]

7.2 12‐16 weeks

1

81

Odds Ratio (M‐H, Fixed, 95% CI)

1.28 [0.53, 3.07]

Figuras y tablas -
Comparison 11. LBP with radiation, Traction vs Placebo, Sham or No Treatment
Comparison 12. LBP with radiation, Traction vs Physiotherapy

Outcome or subgroup title

No. of studies

No. of participants

Statistical method

Effect size

1 Global improvement Show forest plot

1

41

Odds Ratio (M‐H, Fixed, 95% CI)

9.9 [1.82, 53.83]

1.2 3‐5 weeks

1

41

Odds Ratio (M‐H, Fixed, 95% CI)

9.9 [1.82, 53.83]

Figuras y tablas -
Comparison 12. LBP with radiation, Traction vs Physiotherapy
Comparison 13. LBP with radiation, Traction vs Exercise

Outcome or subgroup title

No. of studies

No. of participants

Statistical method

Effect size

1 Global improvement Show forest plot

3

640

Odds Ratio (M‐H, Fixed, 95% CI)

1.16 [0.81, 1.66]

1.1 1‐2 weeks

2

100

Odds Ratio (M‐H, Fixed, 95% CI)

1.14 [0.51, 2.55]

1.2 3‐5 weeks

1

293

Odds Ratio (M‐H, Fixed, 95% CI)

1.13 [0.63, 2.02]

1.3 12‐16 weeks

1

247

Odds Ratio (M‐H, Fixed, 95% CI)

1.20 [0.69, 2.08]

2 Pain Show forest plot

2

297

Mean Difference (IV, Fixed, 95% CI)

0.0 [0.0, 0.0]

2.1 3‐5 weeks

1

247

Mean Difference (IV, Fixed, 95% CI)

0.0 [0.0, 0.0]

2.2 1‐2 weeks

1

50

Mean Difference (IV, Fixed, 95% CI)

0.0 [0.0, 0.0]

3 RTW Show forest plot

1

247

Odds Ratio (M‐H, Fixed, 95% CI)

1.31 [0.64, 2.67]

3.1 3‐5 weeks

1

247

Odds Ratio (M‐H, Fixed, 95% CI)

1.31 [0.64, 2.67]

4 Function Show forest plot

1

50

Mean Difference (IV, Fixed, 95% CI)

0.0 [0.0, 0.0]

4.1 1‐2 weeks

1

50

Mean Difference (IV, Fixed, 95% CI)

0.0 [0.0, 0.0]

Figuras y tablas -
Comparison 13. LBP with radiation, Traction vs Exercise
Comparison 15. LBP with radiation, Traction vs Manipulation

Outcome or subgroup title

No. of studies

No. of participants

Statistical method

Effect size

1 Global improvement Show forest plot

1

841

Odds Ratio (M‐H, Fixed, 95% CI)

0.87 [0.66, 1.16]

1.2 3‐5 weeks

1

584

Odds Ratio (M‐H, Fixed, 95% CI)

0.87 [0.63, 1.21]

1.3 12‐16 weeks

1

257

Odds Ratio (M‐H, Fixed, 95% CI)

0.89 [0.51, 1.55]

2 Pain Show forest plot

1

298

Mean Difference (IV, Fixed, 95% CI)

0.0 [0.0, 0.0]

2.1 3‐5 weeks

1

298

Mean Difference (IV, Fixed, 95% CI)

0.0 [0.0, 0.0]

3 RTW Show forest plot

1

298

Odds Ratio (M‐H, Fixed, 95% CI)

1.16 [0.59, 2.28]

3.1 3‐5 weeks

1

298

Odds Ratio (M‐H, Fixed, 95% CI)

1.16 [0.59, 2.28]

Figuras y tablas -
Comparison 15. LBP with radiation, Traction vs Manipulation
Comparison 16. LBP with radiation, Traction vs Corset, Infrared

Outcome or subgroup title

No. of studies

No. of participants

Statistical method

Effect size

1 Global improvement Show forest plot

1

500

Odds Ratio (M‐H, Fixed, 95% CI)

1.08 [0.71, 1.64]

1.1 3‐5 weeks

1

267

Odds Ratio (M‐H, Fixed, 95% CI)

1.08 [0.58, 2.00]

1.2 12‐16 weeks

1

233

Odds Ratio (M‐H, Fixed, 95% CI)

1.07 [0.61, 1.90]

2 Pain Show forest plot

1

241

Mean Difference (IV, Fixed, 95% CI)

0.0 [0.0, 0.0]

2.2 3‐5 weeks

1

241

Mean Difference (IV, Fixed, 95% CI)

0.0 [0.0, 0.0]

3 RTW Show forest plot

1

267

Odds Ratio (M‐H, Fixed, 95% CI)

1.28 [0.62, 2.65]

3.1 3‐5 weeks

1

267

Odds Ratio (M‐H, Fixed, 95% CI)

1.28 [0.62, 2.65]

4 Pain Show forest plot

1

274

Odds Ratio (M‐H, Fixed, 95% CI)

1.58 [0.95, 2.65]

4.1 1‐2 weeks

1

131

Odds Ratio (M‐H, Fixed, 95% CI)

1.08 [0.54, 2.17]

4.4 1 year

1

143

Odds Ratio (M‐H, Fixed, 95% CI)

2.52 [1.14, 5.57]

Figuras y tablas -
Comparison 16. LBP with radiation, Traction vs Corset, Infrared
Comparison 17. LBP with radiation, Autotraction vs Manual traction

Outcome or subgroup title

No. of studies

No. of participants

Statistical method

Effect size

1 Pain Show forest plot

2

89

Mean Difference (IV, Fixed, 95% CI)

2.93 [‐14.73, 20.59]

1.1 1‐2 weeks

2

89

Mean Difference (IV, Fixed, 95% CI)

2.93 [‐14.73, 20.59]

2 Global improvement Show forest plot

1

49

Odds Ratio (M‐H, Fixed, 95% CI)

2.24 [0.61, 8.21]

2.1 1‐2 weeks

1

49

Odds Ratio (M‐H, Fixed, 95% CI)

2.24 [0.61, 8.21]

Figuras y tablas -
Comparison 17. LBP with radiation, Autotraction vs Manual traction