| Study ID | Design | Participants | Interventions | Outcomes |
| Nelson 1993 | Designed to assess the ability of troleandomycin to reduce the daily steroid treatment required for asthma control and the steroid long term side effects in asthmatic patients requiring daily corticosteroid therapy. | Patients: 75 patients enrolled, all with a fluctuation of at least 15% of FEV1 values occurring either spontaneously or after bronchodilation with inhaled beta‐agonists, requiring a minimum dosage of 15 mg of prednisone per day or an equivalent dose of another steroid over the preceding 3 months with history of deterioration of symptoms when steroid dose was tapered. Patients using inhaled sodium cromolyn or steroids were required to discontinue these medications before enrolment in the study. Patients using anti convulsivant therapy, significant hepatic disease or smokers were also excluded. Using the GINA score system (GINA 2002) all patients were classified in the more severe class of asthma (4th group, severe persistent asthma). | Type of interventions: patients were randomised to 2 treatment groups:
troleandomycin (250 mg)/methylprednisolone (37 patients);
placebo/methylprednisolone (38 patients).
Both groups were also treated with calcium in a dose of 1500 mg per day to reduce bone loss effects, if not contraindicated by history of renal calculi or hyper‐calcaemia.
The 2 groups were not significantly different for demographic data. The dosage of daily theophylline treatment was reduced 25% in all study subjects. Steroid dose reduction was initiated immediately with a 25% reduction in the alternate day dose, at intervals of 6 days and, subsequently, 2 weeks. General guidelines for steroid tapering were that symptoms should remain well controlled and peak flow should remain if possible within 10% of the level recorded during the baseline period of optimum asthma control. Acute exacerbations were treated in the majority of cases by guidelines indications; during exacerbations troleandomycin treatment was temporally stopped, methylprednisolone in a dose of at least 16 mg twice day, until optimal control of symptoms. The study protocol was then restarted following symptoms resolution. The majority of steroid adjustments were made under the supervision of the Principal Investigator.
18 patients failed to complete the 1 year of double‐blind participation (7 in the troleandomycin and 11 in the placebo group, p value not significant). When considering asthma control, dropouts didn't differed significantly from those completing 1 year of participation and were not considered as treatment failures.
Among the 30 patients remaining in the troleandomycin group, 17 completed a 2 year period in double‐blind. In the placebo group, 27 completed the 1 year and 8 completed the 2 year period of the study. | The principal analysis was by comparison of group means by Student's t test or distribution by chi‐square testing. When indicated because of non normal distribution , Wilcoxon's rank‐sum test was employed and when insufficient numbers of individuals cells made chi‐square inappropriate, Fisher's exact test was substituted.
designed to assess the ability of troleandomycin to reduce the daily steroid treatment required for asthma control and the steroid long term side effects in asthmatic patients requiring daily corticosteroid therapy.
Patients: 75 patients enrolled, all with a fluctuation of at least 15% of FEV1 values occurring either spontaneously or after bronchodilation with inhaled beta‐agonists, requiring a minimum dosage of 15 mg of prednisone per day or an equivalent dose of another steroid over the preceding 3 months with history of deterioration of symptoms when steroid dose was tapered. Patients using inhaled sodium cromolyn or steroids were required to discontinue these medications before enrolment in the study. Patients using anti convulsivant therapy, significant hepatic disease or smokers were also excluded. Using the GINA score system (GINA 2002) all patients were classified in the more severe class of asthma (4th group, severe persistent asthma).
Type of interventions: patients were randomised to 2 treatment groups:
troleandomycin (250 mg)/methylprednisolone (37 patients);
placebo/methylprednisolone (38 patients).
Both groups were also treated with calcium in a dose of 1500 mg per day to reduce bone loss effects, if not contraindicated by history of renal calculi or hyper‐calcaemia.
The 2 groups were not significantly different for demographic data. The dosage of daily theophylline treatment was reduced 25% in all study subjects. Steroid dose reduction was initiated immediately with a 25% reduction in the alternate day dose, at intervals of 6 days and, subsequently, 2 weeks. General guidelines for steroid tapering were that symptoms should remain well controlled and peak flow should remain if possible within 10% of the level recorded during the baseline period of optimum asthma control. Acute exacerbations were treated in the majority of cases by guidelines indications; during exacerbations troleandomycin treatment was temporally stopped, methylprednisolone in a dose of at least 16 mg twice day, until optimal control of symptoms. The study protocol was then restarted following symptoms resolution. The majority of steroid adjustments were made under the supervision of the Principal Investigator.
18 patients failed to complete the 1 year of double‐blind participation (7 in the troleandomycin and 11 in the placebo group, p value not significant). When considering asthma control, dropouts didn't differed significantly from those completing 1 year of participation and were not considered as treatment failures.
Among the 30 patients remaining in the troleandomycin group, 17 completed a 2 year period in double‐blind. In the placebo group, 27 completed the 1 year and 8 completed the 2 year period of the study.
Outcome measures.
The principal analysis was by comparison of group means by Student's t test or distribution by chi‐square testing. When indicated because of non normal distribution , Wilcoxon's rank‐sum test was employed and when insufficient numbers of individuals cells made chi‐square inappropriate, Fisher's exact test was substituted. |
| Kamada 1993 | Carried out to assess the efficacy and the safety of low dose troleandomycin in severe, steroid requiring children, especially to test the use of this macrolide for a 12 week time period. | Patients: 19 patients, ages 6 to 17 years, all affected by reversible obstructive airways disease (ATS 1987), all requiring prednisone at a daily dose of at least 20 mg, using inhaled bronchodilator at least 4 times daily, taking theophylline and with a previously failed treatment with cromolyn sodium. All patients were receiving inhaled glucocorticoid therapy (during the study all patients used flunisolide in dose of 2 to 4 puff twice daily). Using the GINA scoring system (GINA 2002), all patients were classified in the more severe class of asthma (4th group, severe persistent asthma).
Exclusion criteria: pregnancy, viral upper airways infections within 4 weeks of enrolment; abnormal hepatic or renal function, inadequately controlled cardiac sinus or thyroid disease or gastroesophageal reflux, severe psychologic disorders, current use of anticonvulsants, erythromycin, oral contraceptives, rifampin, ergotamine, haemoglobin <12 gm/dl or platelet <150 k/µl or other complicating pulmonary disease.
Among the 19 patients enrolled, 2 were discontinued; 1 receiving troleandomycin‐prednisone because of failure to maintain adequate lung function after 8 week of treatment. Data from this patient is included in the analysis because a follow‐up evaluation was obtained before termination. A second patient, also in the troleandomycin‐prednisone group, was dropped after 3 week of treatment for an elevation of liver enzymes level, which necessitated discontinuation of the antibiotic. This patient was excluded in the final analysis. | Types of intervention. The patients were randomised in three treatment groups:
troleandomycin (250 mg) / methylprednisolone once daily (6 patients);
troleandomycin (250 mg) / prednisolone once daily (8 patients);
placebo / methylprednisolone once daily (5 patients);
Randomisation was stratified on 2 levels of severity of asthma. After a single‐blind run‐in period of at least 1 week, patients were randomised to receive one of the three above treatments in a double blind fashion using two identically appearing capsules and one white capsule.
Steroid doses were tapered using a previously published protocol (Eitches 1985) to achieve dosing on every other day or a 50% reduction during the first 2 weeks. Investigators who were not blinded to the data, tapered the doses of steroid on the basis of reported symptoms and FEV1 and/or PEF values, as recommended by investigators blinded to data; doses were tapered in general by 2.5 to 5 mg per week.
Short courses of supplemental prednisone were allowed if FEV1 or PEF measurements dropped below 65% of predicted values, or if extra inhaled bronchodilator treatments within a 6‐hour period or three extra treatments within 24‐hours period were required. Study medications were discontinued during these courses and were restarted at a dose equivalent to that when the patient was clinically stable.
Differences among groups were significant for height between troleandomycin‐methyl prednisone and methyl prednisone alone. The troleandomycin‐methyl prednisone group also had an higher symptom scores and steroids requirement during the baseline period, likely result of the stratified randomisation procedure. | Outcome measures
Data were summarized as means and standard errors within groups, and, where applicable, 95% confidence intervals are computed on individual treatment effects. The analysis for treatment differences was performed with one‐way analysis of variance on the differences between 12 weeks of treatments and base‐line for all variables except methacholine PC20, glucocorticoid dose reduction and symptoms score. Methacholine PC20 was analysed as the ratio of 12 week measurement to the base‐line reduction and percent symptoms score reduction were calculated as (baseline‐final)/baseline*100. Analysis for changes within groups was performed with one‐sample t tests. Multiple comparisons among the treatment groups means were performed with Fisher's protected least significant difference procedure with an alpha level of 0.05. |
| Shoji 1999 | Designed to investigate the effect of roxithromycin on airways responsiveness to the sulpyrine provocation test and to investigate the effect on urinary aspirin‐induced excretion of leukotriene E4 and on eosinophilic inflammation. | 14 patients, with clinical history of aspirin‐intolerant asthma, with a positive sulpyrine and/or lysine aspirin provocation test, non smokers, with a diagnosis of mild or moderate asthma following ATS 1987 criteria (ATS 1987) were included. All were stable and free of symptoms of respiratory infection for at least 6 weeks. Patients using antiasthmatic drugs other than beta agonists, and/or roxithromycin were excluded. Using the GINA score system (GINA 2002), all patients were classified in the 1st group, intermittent asthma, based on current treatment used. An evaluation on the frequency of asthmatic symptoms was not possible, because baseline symptoms were not reported in the paper. | Types of interventions
Patients were randomised in two blocks:
roxithromycin (150 mg twice a day)
placebo (twice a day)
for 8 weeks. FEV1, FVC, blood analyses was performed at the start and the end of period.
After a 4 weeks washout period, the subjects crossed over to receive the alternative treatment for 8 weeks.
All patients underwent a sulpyrine provocation test after each 8 week treatment course with either roxithromycin or placebo in a double‐blind manner, performing spirometry before and after 5, 10 and 15 minutes after inhalation. The urinary level of leukotriene E4 was measured before and after antibiotic use and provocation testing. | A symptoms score (including 4 step of symptoms severity) was recorded every week by physicians.
Outcome measurements
All PC20 values were logarithmically transformed before analysis and summary statistics were all expressed as means and standard deviations. Student's paired t‐test was used to compare mean differences. Wilcoxon's signed rank test was used for comparison of the two treatment groups at the same time point regarding FEV1 and leukotrienes values. |
| Amayusu 2000 | Designed to evaluate the effect of clarithromycin on bronchial hyper responsiveness and eosinophilic inflammation in patients with allergy induced asthma. | 17 patients affected by allergy‐induced asthma were enrolled in this study. All patients met the ATS 1987 criteria (ATS 1987) for mild or moderate asthma, they were treated with beta‐agonists only to control asthmatic symptoms. Based on the current treatment, patients could be classified as intermittent asthma following GINA 2002 recommendations (GINA 2002). Elsewhere, there was no clear indication about the frequency and severity of asthmatic symptoms before starting the trial.
Patients were excluded if there was evidence on viral infection in the 6 weeks prior to the study, if they were treated with anti‐asthmatic drugs other than beta‐agonists, or with clarithromycin. | Patients were randomly assigned to 2 treatment groups:
clarithromycin (200 mg twice a day)
placebo (twice a day)
for 8 weeks. Blood samples for cell counts and serum eosinophilic cationic protein measurements were taken before and after the 8 week period and sputum analyses were performed following a standard protocol. Methacholine provocation testing was performed after the 8 weeks, with lung function measurements performed before and after 5, 10, 15 minutes of the provocation test.
Patients previously randomised in the two group underwent a crossover period with the same type of intervention and, then, were resubmitted to the study analyses.
A symptoms score was assessed weekly following a 4 grade scale of severity. | Outcome measurements
All PC20 values were logarithmically transformed before analysis and summary statistics were all expressed as means and standard deviations. Student's paired t‐test was used to compare mean differences. Wilcoxon's signed rank test was used for comparison of the two treatment groups at the same time point regarding FEV1 and ECP values. |
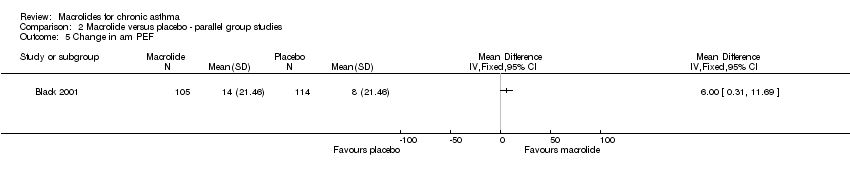
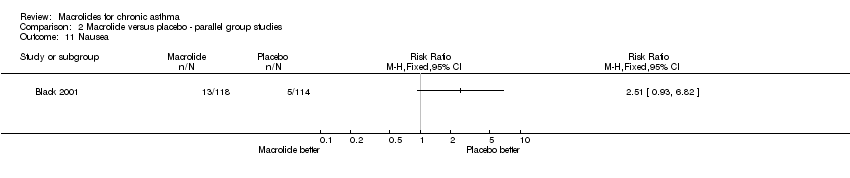
| Black 1999 | Multicenter multinational study on the effect of a roxithromycin in asthmatic patients with serological evidence of Chlamydia pneumoniae infection. | Patients
232 patients 18‐60 yrs of age, with a defined diagnosis of asthma, with FEV1 50‐90% of predicted were enrolled in four different Countries (Australia, New Zealand, Italy and Argentina). Patients had serological evidence of Chlamydia pneumoniae infection, as demonstrated by IgG and IgA antibody titres. Exclusion criteria were: previous treatment with macrolides, quinolone and tetracycline in the 4 weeks before entering the study, use of ergot alkaloids, terfenadine or astemizole, smoking history of 20 pack years or more, bronchiectasis, other serious systemic disease, hypersensitivity to macrolides or any significant change in asthma medication in the previous month, respiratory tract infection during the run‐in period or abnormal liver or kidney function test. Due to the lack in the paper of a complete description of symptoms or drugs needed to control symptoms for each patient, a classification following the GINA score (GINA 2002) was not possible. | Types of intervention: patients were randomly assigned to 2 treatment groups:
roxithromycin 150 mg bd
placebo
for 6 weeks. | Outcome measures: symptoms and morning and evening PEF were recorded during treatment and for the following 6 months. The Asthma Quality of Life Questionnaire (AQLQ) was administered at randomisation, at week 2, 6, 12 and 24 after the beginning if the treatment. A the same times a spirometry was performed.
13 patients randomised to treatment withdrew from the study. Among the remaining 219, 105 were in the roxithromycin and 114 in the placebo group. No significant differences between the 2 groups were recorded for demographic and lung function tests. |
| Kraft 2002 | The study by Kraft 2002 was designed to assess the effect of the treatment with clarithromycin on pulmonary function tests and inflammation in asthmatic patients with an evidence of infection by M. pneumoniae or C. pneumoniae. | Patients: 55 asthmatic patients, whose 31 had an evidence of infection by M. pneumoniae or C. pneumoniae were recruited in the study. All were classified as asthmatic following the ATS 1987 criteria. According to the ATS 1987 criteria, all subjects were considered asthmatics of moderate severity. No clear classification based on the severity of asthma is reported in the study; based on the percent predicted FEV1 and drugs used at the baseline (about 69% in both PCR+ and PCR‐ subjects), the patients are likely to be for the most part moderate persistent asthmatics (Class III of the GINA 2002). One patient was reported to be continuously treated with oral steroids, and, thus, considered a severe persistent asthmatic (GINA 2002).
Exclusion criteria included the inpatient status, upper or lower respiratory tract infections and/or use of macrolides, tetracyclines or quinolones within 3 months from the beginning of the study, smoking history > 5 pack/years or any cigarette within the previous 2 years, other significant respiratory diseases or other medical problems. | Interventions: The patients were randomised in a double blind fashion into two arms:
‐clarithromycin 500 mg bid for 6 weeks
‐placebo for 6 weeks
No clear limitation of the use of other drugs (especially oral steroids) was included in the protocol for the duration of the treatment.
3 patients were excluded from the treatment analysis, but it is not clearly reported in which arm of the study they were allocated. Twenty‐six patients were reported as allocated to each of the study's arms. The number of patients with a positive PCR for either M. pneumoniae or C. pneumoniae at the baseline was similar in the chlarithromycin and in the placebo group (13 vs 14, respectively), as well as no significant difference was reported for the FEV1 mean values in the two groups (2.72±0.17 L in the clarithromycin vs 2.52±0.13 L in the placebo group, p=0.37). No other demographic data were reported to better compare the two arms of the study. | Outcome measures.
Presence or absence of a positive PCR for M. pneumoniae or C. pneumoniae between with 2 arms was compared by Fisher exact test. The outcome variables (FEV1, changes in FEV1, FVC and levels of cytokines in the BAL) were compared using unpaired t test or Wilcoxon sign rank, depending on the distribution of the data. Within‐group comparisons were performed using the t test or Wilcoxon rank sum. Data were presented as mean±SEM or median. All tests were two‐sided with a level of significance p?0.05. |
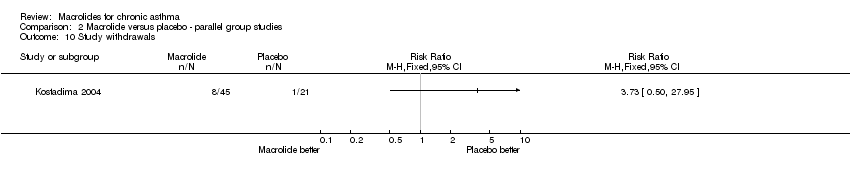
| Kostadima 2004 | Designed to evaluate the effect of clarithromycin on bronchial hyper‐responsiveness to methacholine in patients with a diagnosis of asthma. | Patients: 75 patients were enrolled, aged 18‐70 years, with a diagnosis of mild persistent asthma for more then 1 year according to the GINA 2002, and a provocative dose of methacholine causing a 20% fall in FEV1 (PD 20) of <20 mg. During the study no other medications were allowed, and exclusion criteria included: history of allergic rhinitis or occupational asthma, smoking habit (past or current), exacerbations requiring oral steroids or upper tract infections in the 4 weeks before the trial, a FEV1<50% of the predicted value or <1 L at the baseline, other systemic diseases, use of beta‐blockers or pregnancy or nursing mothers. Exacerbations during the study were a criteria for withdrawn. | Interventions: the patients were randomised in a double blind fashion in 3 arms:
‐Group A: clarithromycin 250 mg b.i.d. for 8 weeks
‐Group B: clarithromycin 250 t.i.d. for 8 weeks
‐Group C: placebo dextrose tablets for 8 weeks.
Bronchodilators were discontinued at least 12 hours before the provocation tests.
Side effects were recorded and assessed by total blood count, renal function and liver function. Some patients underwent serum free cortisol levels at the baseline and at the end of the study.
The allocation method is not described in details and ir seems to be questionable: a research nurse, who was declared to do not had other roles in the study, was in charge of randomising the patients in the 3 groups.
Demographic data are reported for every arm of the study, without including the drop outs.
‐group A: 22 patients (3 drop outs, 1 for exacerbation 2 for not adherence to the protocol) were 48±16 year old, 6 (27%) females. At the baseline, the mean FEV1% value was 85±12, with a median PD 20 of 0.3 (0.1‐1) mg.
‐group B: 20 patients (5 drop outs, 3 for exacerbations, 1 for a gastrointestinal disorder, 1 for not adherence to the protocol) were 42±12 year old, 12 (60%) females. At the baseline, the mean FEV1% value was 85±13, with a median PD 20 of 0.4 (0.1‐0.9) mg.
‐group C: 21 patients (4 drop outs, 3 exacerbations and 1 not adherent to the protocol) were 41±16 year old, 15 (71%) females, with a mean FEV1% value of 86±14 and a median PD 20 of 0.3 (0.1‐0.6) mg.
Age and pulmonary function test values were similar among the three groups. | Statistics: results are presented as either median (interquartile range) or mean±SD. PD 20 and spirometric indices before and after the treatment were compared using a Wilcoxon signed‐rank test or a two‐tailed paired t test. Changes in PD 20 in the treatment groups were compared using the Mann‐Whitney test. |