Scolaris Content Display Scolaris Content Display

Comparison 1 Exercise vs no exercise, Outcome 1 Glycated haemoglobin (%).
Figuras y tablas -
Analysis 1.1

Comparison 1 Exercise vs no exercise, Outcome 1 Glycated haemoglobin (%).

Comparison 1 Exercise vs no exercise, Outcome 2 Visceral adipose tissue (cm2).
Figuras y tablas -
Analysis 1.2

Comparison 1 Exercise vs no exercise, Outcome 2 Visceral adipose tissue (cm2).

Comparison 1 Exercise vs no exercise, Outcome 3 Subcutaneous adipose tissue (cm2).
Figuras y tablas -
Analysis 1.3

Comparison 1 Exercise vs no exercise, Outcome 3 Subcutaneous adipose tissue (cm2).

Comparison 1 Exercise vs no exercise, Outcome 4 Body Mass (kg).
Figuras y tablas -
Analysis 1.4

Comparison 1 Exercise vs no exercise, Outcome 4 Body Mass (kg).

Comparison 1 Exercise vs no exercise, Outcome 5 Triglycerides (mmol/litre).
Figuras y tablas -
Analysis 1.5

Comparison 1 Exercise vs no exercise, Outcome 5 Triglycerides (mmol/litre).

Comparison 1 Exercise vs no exercise, Outcome 6 Maximal exercise capacity (VO2max)(ml/(kg*min)).
Figuras y tablas -
Analysis 1.6

Comparison 1 Exercise vs no exercise, Outcome 6 Maximal exercise capacity (VO2max)(ml/(kg*min)).

Comparison 1 Exercise vs no exercise, Outcome 7 Systolic blood pressure (mmHg).
Figuras y tablas -
Analysis 1.7

Comparison 1 Exercise vs no exercise, Outcome 7 Systolic blood pressure (mmHg).

Comparison 1 Exercise vs no exercise, Outcome 8 Diastolic blood pressure (mmHg).
Figuras y tablas -
Analysis 1.8

Comparison 1 Exercise vs no exercise, Outcome 8 Diastolic blood pressure (mmHg).

Comparison 1 Exercise vs no exercise, Outcome 9 Fasting plasma glucose concentration (mmol/L).
Figuras y tablas -
Analysis 1.9

Comparison 1 Exercise vs no exercise, Outcome 9 Fasting plasma glucose concentration (mmol/L).

Comparison 1 Exercise vs no exercise, Outcome 10 Insulin (fasting concentration (pmol/litre).
Figuras y tablas -
Analysis 1.10

Comparison 1 Exercise vs no exercise, Outcome 10 Insulin (fasting concentration (pmol/litre).

Comparison 1 Exercise vs no exercise, Outcome 11 Body Mass index (kg/m2).
Figuras y tablas -
Analysis 1.11

Comparison 1 Exercise vs no exercise, Outcome 11 Body Mass index (kg/m2).

Comparison 1 Exercise vs no exercise, Outcome 12 Total cholesterol (mmol/l).
Figuras y tablas -
Analysis 1.12

Comparison 1 Exercise vs no exercise, Outcome 12 Total cholesterol (mmol/l).

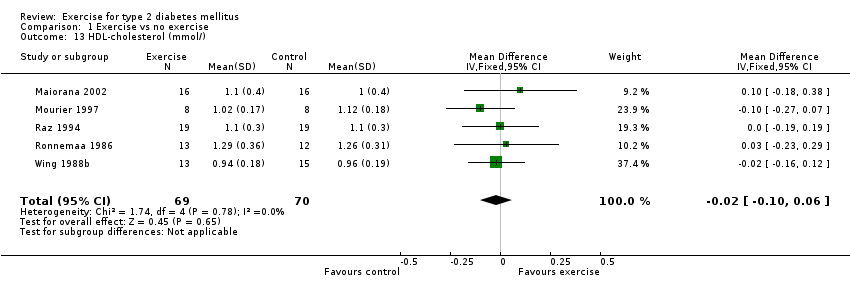
Comparison 1 Exercise vs no exercise, Outcome 13 HDL‐cholesterol (mmol/).
Figuras y tablas -
Analysis 1.13

Comparison 1 Exercise vs no exercise, Outcome 13 HDL‐cholesterol (mmol/).

Comparison 1 Exercise vs no exercise, Outcome 14 LDL‐cholesterol (mmol/).
Figuras y tablas -
Analysis 1.14

Comparison 1 Exercise vs no exercise, Outcome 14 LDL‐cholesterol (mmol/).

Comparison 1. Exercise vs no exercise

Outcome or subgroup title

No. of studies

No. of participants

Statistical method

Effect size

1 Glycated haemoglobin (%) Show forest plot

13

361

Mean Difference (IV, Fixed, 95% CI)

‐0.62 [‐0.91, ‐0.33]

2 Visceral adipose tissue (cm2) Show forest plot

2

40

Mean Difference (IV, Fixed, 95% CI)

‐45.54 [‐63.76, ‐27.31]

3 Subcutaneous adipose tissue (cm2) Show forest plot

2

Mean Difference (IV, Fixed, 95% CI)

Subtotals only

4 Body Mass (kg) Show forest plot

10

248

Mean Difference (IV, Fixed, 95% CI)

‐0.04 [‐3.83, 3.76]

5 Triglycerides (mmol/litre) Show forest plot

5

139

Mean Difference (IV, Fixed, 95% CI)

‐0.25 [‐0.48, ‐0.02]

6 Maximal exercise capacity (VO2max)(ml/(kg*min)) Show forest plot

3

95

Mean Difference (IV, Fixed, 95% CI)

4.84 [2.55, 7.12]

7 Systolic blood pressure (mmHg) Show forest plot

4

127

Mean Difference (IV, Fixed, 95% CI)

‐4.16 [‐9.46, 1.14]

8 Diastolic blood pressure (mmHg) Show forest plot

3

78

Mean Difference (IV, Fixed, 95% CI)

‐0.13 [‐3.70, 3.45]

9 Fasting plasma glucose concentration (mmol/L) Show forest plot

9

238

Mean Difference (IV, Fixed, 95% CI)

‐0.45 [‐1.09, 0.18]

10 Insulin (fasting concentration (pmol/litre) Show forest plot

7

168

Mean Difference (IV, Fixed, 95% CI)

‐0.71 [‐4.13, 2.71]

11 Body Mass index (kg/m2) Show forest plot

7

216

Mean Difference (IV, Fixed, 95% CI)

‐0.21 [‐1.35, 0.93]

12 Total cholesterol (mmol/l) Show forest plot

5

139

Mean Difference (IV, Fixed, 95% CI)

‐0.11 [‐0.41, 0.18]

13 HDL‐cholesterol (mmol/) Show forest plot

5

139

Mean Difference (IV, Fixed, 95% CI)

‐0.02 [‐0.10, 0.06]

14 LDL‐cholesterol (mmol/) Show forest plot

3

73

Mean Difference (IV, Fixed, 95% CI)

0.12 [‐0.29, 0.53]

Figuras y tablas -
Comparison 1. Exercise vs no exercise