Impfung von Frauen zur Vorbeugung von Neugeborenen‐Tetanus (Wundstarrkrampf)
Referencias
References to studies included in this review
References to studies excluded from this review
Additional references
References to other published versions of this review
Characteristics of studies
Characteristics of included studies [ordered by study ID]
Ir a:
| Methods | Volunteers received 1 of the 2 treatments on a double‐blind basis, there was no information about the adopted manner of randomisation. | |
| Participants | Children between 1 and 14 years of age and non‐pregnant women at least 15 years old from Matlab, a community in rural Bangladesh. Altogether 92,928 participants were immunised and their 8641 infants followed up. | |
| Interventions | 1 or 2 doses of adult dose Al‐adsorbed tetanus‐diphtheria toxoid vs cholera toxoid. Both as 0.5 mL dose, intramuscular, double‐blind. | |
| Outcomes | Neonatal mortality on days 4‐14 (as indicator for neonatal tetanus). | |
| Notes | Immunisations carried out between July 1974 and August 1974. Neonatal outcomes were assessed during 'censuses' between April 1975 and March 1977. Government supported. | |
| Risk of bias | ||
| Bias | Authors' judgement | Support for judgement |
| Random sequence generation (selection bias) | Unclear risk | Descibed as randomised but no description about sequence generation is present. |
| Allocation concealment (selection bias) | Unclear risk | Allocation concealment not described. |
| Blinding of participants and personnel (performance bias) | Unclear risk | Described as double‐blind but reported details do not allow to state whether the study was really carried out under blind conditions. |
| Blinding of outcome assessment (detection bias) | Low risk | Outcomes of interest (death cases occurred among newborns during the first 28 days) assessed by means of demographic surveillance system. |
| Incomplete outcome data (attrition bias) | Low risk | No loss from follow‐up (infants). |
| Selective reporting (reporting bias) | Low risk | Not detected. |
| Other bias | Unclear risk | Mortality between 4 and 14 days is only an indicator outcome for neonatal tetanus death. |
| Overall risk of bias | Unclear risk | Indirect estimate of effectiveness. |
| Methods | Phase 1‐2 randomised, double‐blind, placebo‐controlled, cross‐over trial (see notes) carried out through 3 National Institutes of Health in Houston, Durham, Seattle (USA) between October 2008 and May 2012. Both academic and private obstetric office practices were included. | |
| Participants | Healthy pregnant women aged 18 to 45 years and at low risk for obstetrical complications, with no underlying chronic medical conditions, a singleton pregnancy, and prenatal evaluation that predicted an uncomplicated pregnancy with normal first or second trimester screening test results and detailed anatomic fetal ultrasound at 18 to 22 weeks' gestation were invited to participate. Out of the 172 who agreed 76 were excluded because they met exclusion criteria (prior receipt of Tdap, medical condition, high‐risk pregnancy, mental illness, smoker, receipt of blood products, receipt of TT or tetanus and diphtheria vaccine during the past 2 years), a further 18 were excluded because they did not meet inclusion criteria. The remaining 48 were randomised (2:1) to receive 1 dose of Tdap or saline placebo between the 30th and 32nd gestation week. An age‐matched comparison group of healthy non‐pregnant women was open label immunised with Tdap. Children were also immunised with DTaP (Pentacel, Sanfi) and Hib at 2, 4, 6, and 12 months of age. | |
| Interventions | Participants were randomised 2:1 within each centre (block randomisation) in order to receive 1 intramuscular dose of either: ‐ Licensed Tdap vaccine (Adacel, Sanofi Pasteur): 1 a 0.5‐mL injection containing 5 Lf TT, 2 Lf diphtheria toxoid, 2.5 μg detoxified pertussis toxin, 5 μg filamentous hemagglutinin, 3 μg pertactin, and 5 μg fimbriae types 2 and 3 in a sterile liquid suspension adsorbed onto aluminium phosphate in single‐dose vials. Women who received saline during pregnancy (n = 15) were given Tdap vaccine postpartum prior to hospital discharge, and women who received Tdap during pregnancy (n = 33) were given saline postpartum. | |
| Outcomes | 1) Injection site reactions: pain, erythema/redness, induration/swelling. Assessed by 30‐minute observation and completion of a 7‐day symptom diary after each injection. 3) Adverse events and serious adverse events: for non‐pregnant women, for 6 months after Tdap immunisation. Attribution of an adverse event to vaccination was judged by the investigators considering temporality, biologic plausibility, and identification of alternative etiologies for each event. 4) Pregnancy outcomes: documented for mothers and infants at the time of delivery through review of delivery records. 5) Infant growth: weight, length, and fronto‐occipital circumference were assessed at each study visit at ages 2, 7 and 13 months, Bayley‐III Scales of Infant and Toddler Development at the last study visit. 6) Immunogenicity assessment (ELISA). | |
| Notes | For the review's purpose, only the first part of the study (i.e. vaccine administration during pregnancy) is included and considered as parallel group trial. | |
| Risk of bias | ||
| Bias | Authors' judgement | Support for judgement |
| Random sequence generation (selection bias) | Unclear risk | The study is reported as randomised, but no description of the method of randomisation or about generation of allocation sequence is present in the text. |
| Allocation concealment (selection bias) | Low risk | From the "Methods" section:"Randomization was stratified by site with random block sizes. Each participant was assigned a unique treatment number that corresponded to her treatment allocation". 1 woman received pharmacy stock vaccine outside randomisation. No information about block size, also considering the small number of participants at each site. |
| Blinding of participants and personnel (performance bias) | Unclear risk | From the "Methods" section:"Only the unblinded vaccine administrator had access to the treatment allocation". Not clear whether vaccine and placebo were distinguishable for their appearance. |
| Blinding of outcome assessment (detection bias) | Unclear risk | Local and systemic adverse event were reported on a diary symptoms card. Bias in detection should instead be low for adverse events and pregnancy outcomes. |
| Incomplete outcome data (attrition bias) | Low risk | All mothers accounted for safety assessment. 1 child born from a vaccinated mother and 2 children born from mothers who received saline placebo as first were lost from follow‐up. |
| Selective reporting (reporting bias) | Low risk | All outcomes in the methods has been assessed. |
| Other bias | High risk | Sample size. Authors did not power the study to test any specific hypothesis. The study was designed and preformed as cross‐over trial: only the first part of the study was included in the review and considered as parallel group trial. |
| Overall risk of bias | High risk | Not conceived and not powered to detect possible important safety issue or consequence of tetanus immunisation during pregnancy. |
| Methods | RCT (all registered were allotted a code number according to their ascertainment, which was previously randomly divided in 2 groups, A and B. Those who declined to participate were placed in a third group C, n = 1158). | |
| Participants | Women between 13 and 45 years of age from Corregimiento of Guacene (Colombia) were immunised with TT or polyvalent influenza vaccine (n = 1618). Follow‐up was carried out on 1182 infants. | |
| Interventions | 1 or 2‐3 doses of 10 LF AlPO4 adsorbed TT vs polyvalent influenza vaccine, 1 mL intramuscularly, both preparations were not perfectly undistinguishable. | |
| Outcomes | Incidence of neonatal tetanus cases or deaths. | |
| Notes | Carried out between 1961 and 1965. Lederle Laboratories provided TT. | |
| Risk of bias | ||
| Bias | Authors' judgement | Support for judgement |
| Random sequence generation (selection bias) | Low risk | Random sampling number. |
| Allocation concealment (selection bias) | Unclear risk | Even if formally adequate (i.e. code numbers allotted to participant women by order of ascertainment; code numbers were previously randomised to treatment and control arm), injected preparations were not perfectly indistinguishable (see below). Refusal of immunisation could have introduced some bias in selection. |
| Blinding of participants and personnel (performance bias) | High risk | Vial labels were of different colours. It was noted early by both participants and personnel that 1 of the 2 preparations was more painful after inoculation. This together with refusal (see above) might have caused an higher refusal rate in intervention group (about 10%). |
| Blinding of outcome assessment (detection bias) | Low risk | Even if not described, it is plausible that outcome assessors were unaware of the immunisation status of the women. |
| Incomplete outcome data (attrition bias) | Unclear risk | Not estimable. |
| Selective reporting (reporting bias) | Low risk | Not detected. |
| Other bias | Unclear risk | The method of cutting and dressing the umbilical cord by birth attendant could have had an effect on outcome. |
| Overall risk of bias | Unclear risk | Apart from possible bias in selection, this study could provide a reliable estimate of effectiveness. |
ELISA: enzyme‐linked immunoabsorbent assay
Hib: H. Influenza
RCT: randomised controlled trial
Tdap: tetanus‐diphtheria acellular pertussis vaccine
TT: tetanus toxoid
vs: versus
10 LF AlPO4: aluminium phosphate absorbed tetanus toxoid
Characteristics of excluded studies [ordered by study ID]
Ir a:
| Study | Reason for exclusion |
| Not a trial. Serological outcomes only: antibody titre against tetanus and diphtheria in paired maternal cord sera. | |
| Not a trial. | |
| Narrative review. | |
| Not a trial. Serological measurement with means of the Toxin Binding Inhibition Test on pregnant women and children after 2 doses TT. | |
| Review on umbilical cord care and prevention of infections. | |
| Surveillance study. | |
| Case‐control study on efficacy of prenatal TT immunisation in preventing neonatal tetanus. | |
| Cross‐sectional study assessing vaccination coverage and educational status in a sample of undergraduate female students in Bangladesh. | |
| Retrospective survey. | |
| Systematic review. | |
| Follow‐up study assessing schooling attainment on babies born from mothers who were immunised several years earlier (Black 1980). | |
| Case‐control study. | |
| Incidence of neonatal tetanus mortality before and after mass immunisation in Thailand. | |
| Not comparative. | |
| Not a trial. Only serological outcomes. | |
| Review. | |
| Not a trial. Serological outcomes only: antibody titre against tetanus and diphtheria in paired maternal cord sera. | |
| Cohort study. | |
| Interventions (vaccine or placebo) were administered after delivery (post‐partum study) | |
| Not a trial (cohort study). Antibody titre in maternal, cord blood and infant. | |
| Survey assessing the reasons for low vaccination coverage. | |
| Not a trial. Only serological assessment. | |
| Case‐control study. | |
| Not a comparative study. Seroprevalence and TT vaccine coverage assessed on a sample of 600 pregnant women in Iraq. | |
| Trial assessing antibody response to 2 TT vaccines that underwent either controlled temperature chain or standard cold chain in women between 14 and 49 years. | |
| Not a trial. Administration of TT with 2 different adjuvants in women of reproductive age. Only serological outcomes. | |
| Not a trial. 10‐year follow‐up conducted on half of the area where Black 1980 was carried out. | |
| Study assessing whether differential excess mortality among Indian girl children could be associated with vaccinations (GBS, DTP, measles). | |
| Cochrane review about efficacy of community‐based intervention packages to prevent neonatal tetanus. Vaccination is not included. | |
| No intervention: administration of vaccines containing same toxoids but different adjuvants in women of reproductive age. Efficacy outcomes are only serological. | |
| No intervention: trial with polyribosylribitol phosphate‐tetanus vaccine. | |
| No intervention: participants were children receiving conjugate Hib and DTP vaccine, who were born from mother immunised with different doses of TT (0, 1, 2, 3 and more). | |
| Not about tetanus immunisation. | |
| Report on TT immunisation coverage. | |
| Consensus to vaccination. | |
| Not a trial. Vaccination of pregnant women with 3 doses of TT. Immunisation program conducted in half of the Matlab area after Black 1980. | |
| Only serological outcomes. | |
| Efficacy outcome is not of interest: immune response to vaccination assessed in women after immunisation. | |
| Not a trial. | |
| Cohort study. | |
| Case‐control to assess relationship between exposition to TT in pregnancy and malformation in the newborns. | |
| Not a trial. Variation of seral antitoxin after administration of different TT preparation to pregnant women. | |
| Not a trial. Different TT preparations were administered and antitoxins in cord blood were measured. | |
| Case‐control study. | |
| Case‐control study for assessing risk of developing neonatal tetanus, TT immunisation of the mothers was not evaluated as associated factor. | |
| Not a trial. | |
| Follow‐up survey to determine incidence of neonatal tetanus before and after a vaccination campaign in Indonesia. |
DTP: diphtheria, tetanus and pertussis
GBS: group B streptococcus
Hib: H. Influenza
TT: tetanus toxoid
Data and analyses
| Outcome or subgroup title | No. of studies | No. of participants | Statistical method | Effect size |
| 1 Neonatal tetanus deaths Show forest plot | 1 | Risk Ratio (M‐H, Fixed, 95% CI) | Subtotals only | |
| Analysis 1.1 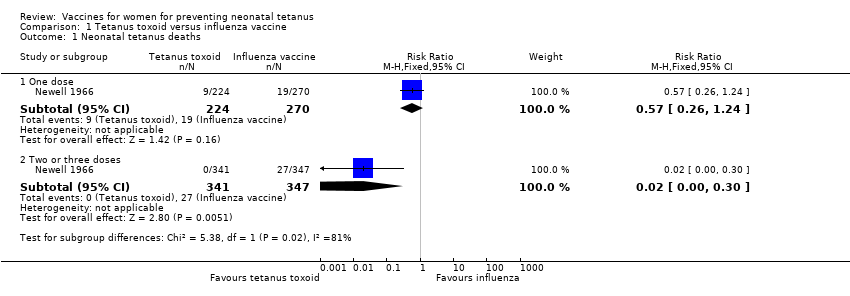 Comparison 1 Tetanus toxoid versus influenza vaccine, Outcome 1 Neonatal tetanus deaths. | ||||
| 1.1 One dose | 1 | 494 | Risk Ratio (M‐H, Fixed, 95% CI) | 0.57 [0.26, 1.24] |
| 1.2 Two or three doses | 1 | 688 | Risk Ratio (M‐H, Fixed, 95% CI) | 0.02 [0.00, 0.30] |
| 2 All causes of death Show forest plot | 1 | Risk Ratio (M‐H, Fixed, 95% CI) | Subtotals only | |
| Analysis 1.2  Comparison 1 Tetanus toxoid versus influenza vaccine, Outcome 2 All causes of death. | ||||
| 2.1 One dose | 1 | 494 | Risk Ratio (M‐H, Fixed, 95% CI) | 1.08 [0.65, 1.79] |
| 2.2 Two or three doses | 1 | 688 | Risk Ratio (M‐H, Fixed, 95% CI) | 0.31 [0.17, 0.55] |
| 3 Neonatal tetanus cases Show forest plot | 1 | Risk Ratio (M‐H, Fixed, 95% CI) | Subtotals only | |
| Analysis 1.3 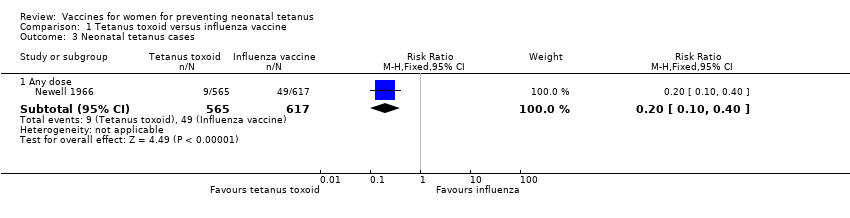 Comparison 1 Tetanus toxoid versus influenza vaccine, Outcome 3 Neonatal tetanus cases. | ||||
| 3.1 Any dose | 1 | 1182 | Risk Ratio (M‐H, Fixed, 95% CI) | 0.20 [0.10, 0.40] |
| 4 Deaths from non‐neonatal tetanus causes (not prespecified) Show forest plot | 1 | Risk Ratio (M‐H, Fixed, 95% CI) | Subtotals only | |
| Analysis 1.4  Comparison 1 Tetanus toxoid versus influenza vaccine, Outcome 4 Deaths from non‐neonatal tetanus causes (not prespecified). | ||||
| 4.1 One dose | 1 | 494 | Risk Ratio (M‐H, Fixed, 95% CI) | 2.14 [0.97, 4.76] |
| 4.2 Two or three doses | 1 | 688 | Risk Ratio (M‐H, Fixed, 95% CI) | 0.75 [0.38, 1.47] |
| Outcome or subgroup title | No. of studies | No. of participants | Statistical method | Effect size |
| 1 Neonatal mortality Show forest plot | 1 | 8641 | Risk Ratio (M‐H, Fixed, 95% CI) | 0.68 [0.56, 0.82] |
| Analysis 2.1 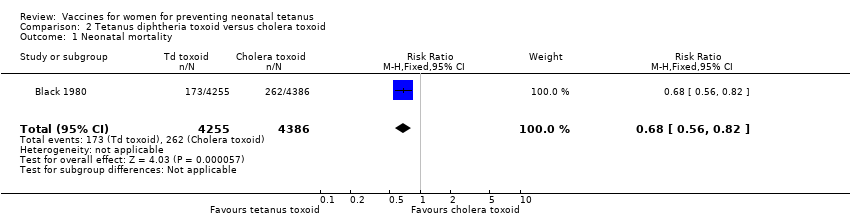 Comparison 2 Tetanus diphtheria toxoid versus cholera toxoid, Outcome 1 Neonatal mortality. | ||||
| 2 Four to 14 days neonatal mortality Show forest plot | 1 | 8641 | Risk Ratio (M‐H, Fixed, 95% CI) | 0.38 [0.27, 0.55] |
| Analysis 2.2  Comparison 2 Tetanus diphtheria toxoid versus cholera toxoid, Outcome 2 Four to 14 days neonatal mortality. | ||||
| Outcome or subgroup title | No. of studies | No. of participants | Statistical method | Effect size |
| 1 Injection site reactions Show forest plot | 1 | Risk Ratio (M‐H, Fixed, 95% CI) | Subtotals only | |
| Analysis 3.1  Comparison 3 Tetanus Diphtheria Acellular pertussis versus saline placebo local and systemic reactions, Outcome 1 Injection site reactions. | ||||
| 1.1 Pain at injection site | 1 | 48 | Risk Ratio (M‐H, Fixed, 95% CI) | 5.68 [1.54, 20.94] |
| 1.2 Erythema ‐ redness | 1 | 48 | Risk Ratio (M‐H, Fixed, 95% CI) | 1.36 [0.15, 12.05] |
| 1.3 Induration ‐ swelling | 1 | 48 | Risk Ratio (M‐H, Fixed, 95% CI) | 3.29 [0.18, 60.05] |
| 1.4 Any injection site symptoms | 1 | 48 | Risk Ratio (M‐H, Fixed, 95% CI) | 3.94 [1.41, 11.01] |
| 2 Systemic reactions Show forest plot | 1 | Risk Ratio (M‐H, Fixed, 95% CI) | Subtotals only | |
| Analysis 3.2 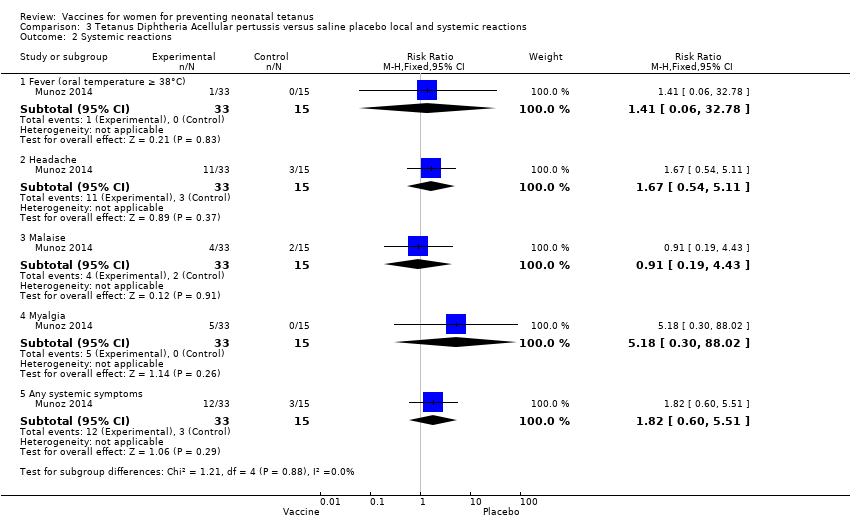 Comparison 3 Tetanus Diphtheria Acellular pertussis versus saline placebo local and systemic reactions, Outcome 2 Systemic reactions. | ||||
| 2.1 Fever (oral temperature ≥ 38°C) | 1 | 48 | Risk Ratio (M‐H, Fixed, 95% CI) | 1.41 [0.06, 32.78] |
| 2.2 Headache | 1 | 48 | Risk Ratio (M‐H, Fixed, 95% CI) | 1.67 [0.54, 5.11] |
| 2.3 Malaise | 1 | 48 | Risk Ratio (M‐H, Fixed, 95% CI) | 0.91 [0.19, 4.43] |
| 2.4 Myalgia | 1 | 48 | Risk Ratio (M‐H, Fixed, 95% CI) | 5.18 [0.30, 88.02] |
| 2.5 Any systemic symptoms | 1 | 48 | Risk Ratio (M‐H, Fixed, 95% CI) | 1.82 [0.60, 5.51] |

'Risk of bias' graph: review authors' judgements about each risk of bias item presented as percentages across all included studies.

'Risk of bias' summary: review authors' judgements about each risk of bias item for each included study.

Comparison 1 Tetanus toxoid versus influenza vaccine, Outcome 1 Neonatal tetanus deaths.

Comparison 1 Tetanus toxoid versus influenza vaccine, Outcome 2 All causes of death.

Comparison 1 Tetanus toxoid versus influenza vaccine, Outcome 3 Neonatal tetanus cases.

Comparison 1 Tetanus toxoid versus influenza vaccine, Outcome 4 Deaths from non‐neonatal tetanus causes (not prespecified).

Comparison 2 Tetanus diphtheria toxoid versus cholera toxoid, Outcome 1 Neonatal mortality.

Comparison 2 Tetanus diphtheria toxoid versus cholera toxoid, Outcome 2 Four to 14 days neonatal mortality.

Comparison 3 Tetanus Diphtheria Acellular pertussis versus saline placebo local and systemic reactions, Outcome 1 Injection site reactions.

Comparison 3 Tetanus Diphtheria Acellular pertussis versus saline placebo local and systemic reactions, Outcome 2 Systemic reactions.
| Tetanus toxoid versus influenza vaccine for women to prevent neonatal tetanus | ||||||
| Patient or population: women aged between 13 and 45 years. Setting: rural community | ||||||
| Outcomes | Illustrative comparative risks* (95% CI) | Relative effect | No of participants | Quality of the evidence | Comments | |
| Assumed risk | Corresponding risk | |||||
| Control | Tetanus toxoid versus influenza vaccine | |||||
| Neonatal tetanus deaths ‐ 1 dose | Study population | RR 0.57 | 494 | ⊕⊕⊝⊝ | ||
| 70 per 1000 | 40 per 1000 | |||||
| Moderate | ||||||
| 70 per 1000 | 40 per 1000 | |||||
| Neonatal tetanus deaths ‐ 2 or 3 doses | Study population | RR 0.02 | 688 | ⊕⊕⊕⊝ | ||
| 78 per 1000 | 2 per 1000 | |||||
| Moderate | ||||||
| 78 per 1000 | 2 per 1000 | |||||
| All causes of deaths ‐ 1 dose | Study population | RR 1.08 | 494 | ⊕⊕⊝⊝ | About 57% of non‐tetanus deaths were observed in the first 7 days of life. | |
| 104 per 1000 | 112 per 1000 | |||||
| Moderate | ||||||
| 104 per 1000 | 112 per 1000 | |||||
| All causes of deaths ‐ 2 or 3 doses | Study population | RR 0.31 | 688 | ⊕⊕⊕⊝ | ||
| 133 per 1000 | 41 per 1000 | |||||
| Moderate | ||||||
| 133 per 1000 | 41 per 1000 | |||||
| Neonatal tetanus cases ‐ Any dose | Study population | RR 0.2 | 1182 | ⊕⊕⊕⊝ | Only 3 non fatal tetanus cases observed (all in the control group). | |
| 79 per 1000 | 16 per 1000 | |||||
| Moderate | ||||||
| 79 per 1000 | 16 per 1000 | |||||
| *The basis for the assumed risk (e.g. the median control group risk across studies) is provided in footnotes. The corresponding risk (and its 95% confidence interval) is based on the assumed risk in the comparison group and the relative effect of the intervention (and its 95% CI). | ||||||
| GRADE Working Group grades of evidence | ||||||
| 1 Design & Implementation (selection bias): Different aspect of the vials used for intervention and control vaccine could have introduced a certain bias in selection. | ||||||
| Tetanus diphtheria toxoid immunisation of women of reproductive age compared with cholera toxoid for preventing neonatal mortality | ||||||
| Patient or population: women of reproductive age ≥ 15 years. Intervention: tetanus diphtheria toxoid versus cholera toxoid. | ||||||
| Outcomes | Illustrative comparative risks* (95% CI) | Relative effect | No of participants | Quality of the evidence | Comments | |
| Assumed risk | Corresponding risk | |||||
| Control | Tetanus diphtheria toxoid | |||||
| Neonatal mortality in the first 28 days of life | Study population | RR 0.68 | 8641 | ⊕⊕⊝⊝ | ||
| 60 per 1000 | 41 per 1000 | |||||
| Moderate | ||||||
| 60 per 1000 | 41 per 1000 | |||||
| Neonatal mortality between day 4‐14 of life | Study population | RR 0.38 | 8641 | ⊕⊕⊝⊝ | ||
| 25 per 1000 | 10 per 1000 | |||||
| Moderate | ||||||
| 25 per 1000 | 9 per 1000 | |||||
| *The basis for the assumed risk (e.g. the median control group risk across studies) is provided in footnotes. The corresponding risk (and its 95% confidence interval) is based on the assumed risk in the comparison group and the relative effect of the intervention (and its 95% CI). | ||||||
| GRADE Working Group grades of evidence | ||||||
| 1 Design & Implementation (selection bias): Even if several important methodological details are missing, the possibility of a certain bias in selection could not be totally excluded. | ||||||
| Local and systemic reactions after administration of Tetanus Diphtheria acelluar Pertussis vaccine versus saline placebo in pregnant women | ||||||
| Patient or population: patients with local and systemic reactions | ||||||
| Outcomes | Illustrative comparative risks* (95% CI) | Relative effect | No of participants | Quality of the evidence | Comments | |
| Assumed risk | Corresponding risk | |||||
| Saline placebo | Tetanus Diphtheria acellular Pertussis vaccine | |||||
| Injection site reactions ‐ pain at injection site | Study population | RR 5.68 | 48 | ⊕⊕⊕⊝ | ||
| 133 per 1000 | 757 per 1000 | |||||
| Moderate | ||||||
| 133 per 1000 | 755 per 1000 | |||||
| Injection site reactions ‐ erythema ‐ redness | Study population | RR 1.36 | 48 | ⊕⊕⊕⊝ | ||
| 67 per 1000 | 91 per 1000 | |||||
| Moderate | ||||||
| 67 per 1000 | 91 per 1000 | |||||
| Injection site reactions ‐ induration ‐ swelling | Study population | RR 3.29 | 48 | ⊕⊕⊕⊝ | ||
| 0 per 1000 | 0 per 1000 | |||||
| Moderate | ||||||
| 0 per 1000 | 0 per 1000 | |||||
| Systemic reactions ‐ fever (oral temperature ≥ 38°C) | Study population | RR 1.41 | 48 | ⊕⊕⊕⊝ | ||
| 0 per 1000 | 0 per 1000 | |||||
| Moderate | ||||||
| 0 per 1000 | 0 per 1000 | |||||
| Systemic reactions ‐ headache | Study population | RR 1.67 | 48 | ⊕⊕⊕⊝ | ||
| 200 per 1000 | 334 per 1000 | |||||
| Moderate | ||||||
| 200 per 1000 | 334 per 1000 | |||||
| Systemic reactions ‐ malaise | Study population | RR 0.91 | 48 | ⊕⊕⊕⊝ | ||
| 133 per 1000 | 121 per 1000 | |||||
| Moderate | ||||||
| 133 per 1000 | 121 per 1000 | |||||
| Systemic reactions ‐ myalgia | Study population | RR 5.18 | 48 | ⊕⊕⊕⊝ | ||
| 0 per 1000 | 0 per 1000 | |||||
| Moderate | ||||||
| 0 per 1000 | 0 per 1000 | |||||
| *The basis for the assumed risk (e.g. the median control group risk across studies) is provided in footnotes. The corresponding risk (and its 95% confidence interval) is based on the assumed risk in the comparison group and the relative effect of the intervention (and its 95% CI). | ||||||
| GRADE Working Group grades of evidence | ||||||
| 1 Imprecision: Small sample size. The study was not powered to test any specific hypotheses. | ||||||
| References | Design | Study Population | Treatment | Outcomes | Results |
| Case‐control study. | 54 neonates admitted to hospital diagnosed with NT. 50 | Immunisation with TT, considered immunised if received at least 2 doses of TT during pregnancy, otherwise not. | Incidence of immunisation: cases (1/54), controls (12/49). | Protective effect against NT if at least 2 doses of TT. | |
| Case‐control study. | Cases: 60 children with NT (WHO case definition) reported by cards and hospital record in Bobai country (province of Guangxi, China) to the National Notifiable Disease Reporting System (NNDRS) from 1.1.97 to 30.4.98. Only children with accurate locating information were included. Controls: 60 infants born in the same village as the cases. | Mother of children were immunised with TT. No information about the number of administered doses is reported. | TT immunisation status of the mothers and other information (maternal: age, education level, annual income < 1000 Yuan; infant: gender, order of birth, home delivery; parental knowledge and attitude regarding NT) were assessed by means of a detailed questionnaire given to parents of both cases and controls. TT immunisation history was based only of mother's recall because they were not provided with vaccinal records. Mothers of 7 cases and 17 controls received previously TT. | Receiving of 1 or more of TT was significant protective against NT. Maternal age, education, family income, birth order, parental knowledge, were also significantly associated with NT. | |
| Survey. | 1688 pregnant women. India. | Immunisation with TT, considered immunised if received 2 doses of TT at least 4 weeks apart or a booster dose. Partially immunised, if received 1 dose of TT either during the current pregnancy or in the past 3 years. | Deaths from NT within 3 to 30 days of birth. | Immunisation during the antenatal period is highly protective against occurrence of NT. | |
| Case‐control study. | Infants with clinically‐diagnosed tetanus. 3 controls. Bangladesh. | Immunisation with TT, 2 doses 4 weeks apart, with second dose administered at least 30 days before delivery. | Incidence of immunisation: cases (33/112), controls (122/336). | Immunisation failed to provide the expected high level of protection. | |
| Follow‐up survey. | Women aged 10 to 45 years. Indonesia. | Immunisation with TT, 1 or 2 doses. | Deaths from NT within 3 to 28 days of birth. | Immunisation caused an 85% reduction of NT. | |
| Survey study. | Women aged 15 to 45 years. Thailand. | Immunisation with TT. | Cases of NT. | Immunisation caused a 8 to 10 times reduction of NT. | |
| Surveillance study. | Women from surveillance area. Bangladesh. | Immunised with TT at 6th, 7th, 8th month. Considered immunised if received 2 injections in 1974 or in the 1978 to 1979 programme. | Deaths attributed to NT within 4 to 14 days after birth. | Full immunisation reduced neonatal mortality rates by about one half and mortality rates on days 4 to 14 by about 70%. | |
| Survey. | Children between 1 to 14 years and non‐pregnant women at least 15 years. Bangladesh. | Immunised with cholera toxoid (1 or 2 0.5 mL doses) vs tetanus ‐ diphtheria toxoid (1 or 2 0.5 mL doses). | Deaths attributed to NT within 4 to 14 days after birth. | 2 injections provided significant protection. Protection of 1 dose not significant. | |
| Observational. | Pregnant women from 62 villages in New Guinea (Maprik, Wingei and Wosera areas). A retrospective "history‐taking survey" on children born from 1945 to the time of the study was also performed in the Maprik area. | 3 doses of fluid formalinised TT (Commonwealth Serum Laboratories, Melbourne). The first dose was administered as early as possible in pregnancy, the second 6 weeks later and the third between 6 weeks and 6 months after the second. | Cases of NT observed in children born from mothers who received different number of doses of TT during pregnancy. | 3 doses of formalinised TT administered during pregnancy afforded substantial protection against NT. Immunisation with only 2 doses provided also a significant protection level. No reactions to the vaccine were noticed. | |
| NT: neonatal tetanus | |||||
| References | Study design | Study population | Intervention | Safety outcomes | Results |
| 2 studies are reported in this paper: | Both studies were performed in New Guinea on indigenous populations. | a) TT prepared by Parke Davis & co with different adjuvants and administered in different doses (Drakeol, 1 dose vs H ‐ 24, 1 dose vs AlPO4, 2 doses vs none, 3 doses) or TT prepared by the Commonwealth Serum Laboratories without adjuvant, 3 doses. | a) Swelling (severe or no tender). | Although oil‐adjuvated preparations provide longer persistence of antitoxin and require to be administered only once, they caused frequently severe side‐effects. The Al‐adjuvated preparations, administered in 2 doses, appeared to be the best way at the time of the study to prevent the occurrence of NNT. | |
| Case‐control study. | Cases (n = 34,293): newborn with congenital malformation. The 10 most frequent in South America were considered. | Immunisation of the mothers with TT during pregnancy. | Cleft lip, pes equinovarus, postaxial polydactyly, hip subluxation, hemangioma, periauricular tag, fistula auris, pigmented naevus, other skin defects, multiple malformed. | No association for each of the examined factors was found. | |
| RCT. | Healthy pregnant Egyptian women at about 20 weeks of gestational age (n = 122). | Participants were randomised to : a) 0.5 mL of TT (TT, 5Lf, n = 62). b) 0.5 mL of combined tetanus and reduced diphtheria (Td, 5 Lf of each toxoids, n = 60). First dose at 20 to 26 weeks of pregnancy, 2nd and 3rd administered respectively 8 and 4 weeks apart. | Systemic (fever, malaise, headache, | Pain at the site of injection was complained more frequently in Td group after both first (P < 0.01) and second (P < 0.04) dose. | |
| Retrospective Cohort study | ‐ Exposed cohort: 138 women aged between 12 and 45 years with documented Tdap immunisation during pregnancy. They were identified among the 162,448 pregnancies occurred within the Intermountain Healthcare facilities (Salt Lake, Utah) between May 2005 and August 2009. ‐ Not exposed cohort: 552 randomly selected women from the same population (without documented vaccination during pregnancy). | In the exposed cohort Tdap immunisation occurred more frequently within 1st (63%), than during 2nd (17%) and 3rd (20%) pregnancy trimester. Immunisation with Tdap occurred mainly as prophylactic measure in consequence of wound, trauma or routine health supervision. | Spontaneous or elective abortion Stillbirth Preterm delivery (<37 weeks) Gestational age Birth weight Congenital anomalies | Incidence of spontaneous or elective abortion was no greater in Tdap cases than in controls. No significant differences in preterm delivery, gestational age, or birth weight between groups. Frequence of ICD‐9‐CM codes diagnosis for congenital anomalies reported among children born to Tdap exposed women do not differ significantly from that observed among born to not Tdap exposed women. | |
| Lf: limit of flocculation units | |||||
| Outcome or subgroup title | No. of studies | No. of participants | Statistical method | Effect size |
| 1 Neonatal tetanus deaths Show forest plot | 1 | Risk Ratio (M‐H, Fixed, 95% CI) | Subtotals only | |
| 1.1 One dose | 1 | 494 | Risk Ratio (M‐H, Fixed, 95% CI) | 0.57 [0.26, 1.24] |
| 1.2 Two or three doses | 1 | 688 | Risk Ratio (M‐H, Fixed, 95% CI) | 0.02 [0.00, 0.30] |
| 2 All causes of death Show forest plot | 1 | Risk Ratio (M‐H, Fixed, 95% CI) | Subtotals only | |
| 2.1 One dose | 1 | 494 | Risk Ratio (M‐H, Fixed, 95% CI) | 1.08 [0.65, 1.79] |
| 2.2 Two or three doses | 1 | 688 | Risk Ratio (M‐H, Fixed, 95% CI) | 0.31 [0.17, 0.55] |
| 3 Neonatal tetanus cases Show forest plot | 1 | Risk Ratio (M‐H, Fixed, 95% CI) | Subtotals only | |
| 3.1 Any dose | 1 | 1182 | Risk Ratio (M‐H, Fixed, 95% CI) | 0.20 [0.10, 0.40] |
| 4 Deaths from non‐neonatal tetanus causes (not prespecified) Show forest plot | 1 | Risk Ratio (M‐H, Fixed, 95% CI) | Subtotals only | |
| 4.1 One dose | 1 | 494 | Risk Ratio (M‐H, Fixed, 95% CI) | 2.14 [0.97, 4.76] |
| 4.2 Two or three doses | 1 | 688 | Risk Ratio (M‐H, Fixed, 95% CI) | 0.75 [0.38, 1.47] |
| Outcome or subgroup title | No. of studies | No. of participants | Statistical method | Effect size |
| 1 Neonatal mortality Show forest plot | 1 | 8641 | Risk Ratio (M‐H, Fixed, 95% CI) | 0.68 [0.56, 0.82] |
| 2 Four to 14 days neonatal mortality Show forest plot | 1 | 8641 | Risk Ratio (M‐H, Fixed, 95% CI) | 0.38 [0.27, 0.55] |
| Outcome or subgroup title | No. of studies | No. of participants | Statistical method | Effect size |
| 1 Injection site reactions Show forest plot | 1 | Risk Ratio (M‐H, Fixed, 95% CI) | Subtotals only | |
| 1.1 Pain at injection site | 1 | 48 | Risk Ratio (M‐H, Fixed, 95% CI) | 5.68 [1.54, 20.94] |
| 1.2 Erythema ‐ redness | 1 | 48 | Risk Ratio (M‐H, Fixed, 95% CI) | 1.36 [0.15, 12.05] |
| 1.3 Induration ‐ swelling | 1 | 48 | Risk Ratio (M‐H, Fixed, 95% CI) | 3.29 [0.18, 60.05] |
| 1.4 Any injection site symptoms | 1 | 48 | Risk Ratio (M‐H, Fixed, 95% CI) | 3.94 [1.41, 11.01] |
| 2 Systemic reactions Show forest plot | 1 | Risk Ratio (M‐H, Fixed, 95% CI) | Subtotals only | |
| 2.1 Fever (oral temperature ≥ 38°C) | 1 | 48 | Risk Ratio (M‐H, Fixed, 95% CI) | 1.41 [0.06, 32.78] |
| 2.2 Headache | 1 | 48 | Risk Ratio (M‐H, Fixed, 95% CI) | 1.67 [0.54, 5.11] |
| 2.3 Malaise | 1 | 48 | Risk Ratio (M‐H, Fixed, 95% CI) | 0.91 [0.19, 4.43] |
| 2.4 Myalgia | 1 | 48 | Risk Ratio (M‐H, Fixed, 95% CI) | 5.18 [0.30, 88.02] |
| 2.5 Any systemic symptoms | 1 | 48 | Risk Ratio (M‐H, Fixed, 95% CI) | 1.82 [0.60, 5.51] |