Баллонная ангиопластика, со стенированием и без, по сравнению с медикаментозной терапией у гипертензивных пациентов со стенозом почечной артерии
Appendices
Appendix 1. CENTRAL search strategy
| #1 | MESH DESCRIPTOR Angioplasty EXPLODE ALL TREES | 3965 |
| #2 | (angioplas* or percutan* or PTA):TI,AB,KY | 9496 |
| #3 | (recanali* or revascular*):TI,AB,KY | 5021 |
| #4 | dilat*:TI,AB,KY | 5684 |
| #5 | (balloon or baloon):TI,AB,KY | 5600 |
| #6 | MESH DESCRIPTOR Endovascular Procedures EXPLODE ALL TREES | 5436 |
| #7 | endovascular:TI,AB,KY | 772 |
| #8 | MESH DESCRIPTOR Blood Vessel Prosthesis EXPLODE ALL TREES | 380 |
| #9 | MESH DESCRIPTOR Blood Vessel Prosthesis Implantation EXPLODE ALL TREES | 362 |
| #10 | MESH DESCRIPTOR Stents EXPLODE ALL TREES | 2649 |
| #11 | (stent* or graft* or endograft* or endoprosthe*):TI,AB,KY | 17228 |
| #12 | #1 OR #2 OR #3 OR #4 OR #5 OR #6 OR #7 OR #8 OR #9 OR #10 OR #11 | 32959 |
| #13 | MESH DESCRIPTOR Renal Artery Obstruction EXPLODE ALL TREES | 97 |
| #14 | MESH DESCRIPTOR Hypertension, Renal EXPLODE ALL TREES | 241 |
| #15 | (renal or reno* or kidney):TI,AB,KY | 29792 |
| #16 | #13 OR #14 OR #15 | 29792 |
| #17 | #12 AND #16 | 4327 |

Study flow diagram.

Risk of bias graph: review authors' judgements about each risk of bias item presented as percentages across all included studies.

Risk of bias summary: review authors' judgements about each risk of bias item for each included study.

Comparison 1 Balloon angioplasty versus medical therapy, Outcome 1 Change in systolic BP at 2 years or end of follow‐up.

Comparison 1 Balloon angioplasty versus medical therapy, Outcome 2 Change in diastolic BP at 2 years or end of follow‐up.

Comparison 1 Balloon angioplasty versus medical therapy, Outcome 3 Serum creatinine at 2 years or end of follow up.

Comparison 1 Balloon angioplasty versus medical therapy, Outcome 4 Number of antihypertensive drugs.
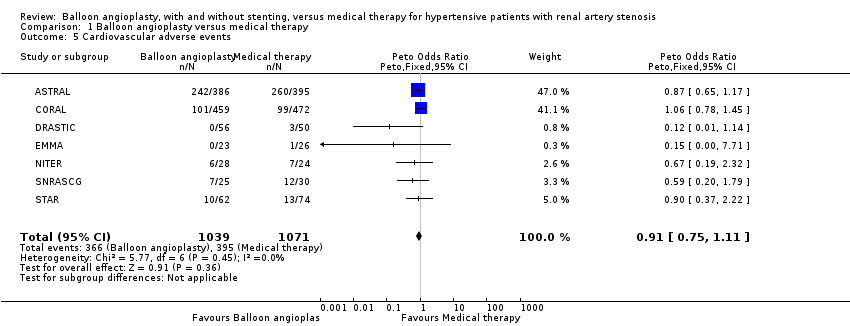
Comparison 1 Balloon angioplasty versus medical therapy, Outcome 5 Cardiovascular adverse events.

Comparison 1 Balloon angioplasty versus medical therapy, Outcome 6 Renal adverse events.
| Complications | ASTRAL | CORAL | DRASTIC | EMMA | NITER | SNRASCG | STAR |
| Angina/myocardial infarction/heart failure | 112 in BA, 131 in MT | 40 in BA, 37 in MT | 0 in BA, 2 in MT | 0 in any group | Data not available | 4 in each group | 4 in BA, 6 in MT (defined as CAD + HF) |
| Cholesterol embolisation | 3 in BA, 0 in MT | 6 in BA, 0 in MT | 0 in BA, 1 in MT | 0 in any group | Data not available | 0 in any group | 1 in BA, 0 in MT |
| Non‐procedure‐related symptomatic hypotension | Data not available | Data not available | 0 in any group | 0 in BA, 1 in MT | Data not available | 0 in any group | Data not available |
| Stroke | 24 in BA, 23 in MT | 16 in BA, 23 in MT | 0 in any group | 0 in any group | 3 in BA, 4 in MT | 1 in BA, 4 in MT | 0 in BA, 1 in MT (defined as cerebro vascular disease) |
| Death | 103 in BA, 106 in MT | 63 in BA, 76 in MT | 0 in any group | 0 in any group | 3 in BA, 3 in MT | 2 in BA, 4 in MT | 6 in MT, 5 in BA |
| BA: balloon angioplasty group | |||||||
| Complications | ASTRAL | CORAL | DRASTIC | EMMA | NITER | SNRASCG | STAR |
| > 50% increase in serum creatinine or | Data not available | Data not available | 1 in BA, 3 in MT | 0 in BA, 1 in MT | Data not available | 0 in any group | 10 in BA, 16 in MT (data provided for 20% fall in CrCl only) |
| Renal failure | 55 in BA, 54 in MT (defined as AKI + dialysis for end stage renal disease) | 16 in BA, 8 in MT (defined as permanent RRT) | 0 in any group | 0 in any group | 10 in BA, 8 in MT (but unclear how worsening renal failure was defined) | 2 in each group | Data not available |
| Total occlusion of stenotic artery | 5 in BA, 4 in MT | Data not available | 0 in BA, 4 in MT | 0 in any group | Data not available | 0 in any group | Data not available |
| AKI: acute kidney injury | |||||||
| Outcome or subgroup title | No. of studies | No. of participants | Statistical method | Effect size |
| 1 Change in systolic BP at 2 years or end of follow‐up Show forest plot | 5 | 1743 | Mean Difference (IV, Fixed, 95% CI) | ‐1.07 [‐3.45, 1.30] |
| 2 Change in diastolic BP at 2 years or end of follow‐up Show forest plot | 4 | 809 | Mean Difference (IV, Fixed, 95% CI) | 0.00 [‐3.72, ‐0.27] |
| 3 Serum creatinine at 2 years or end of follow up Show forest plot | 3 | 725 | Mean Difference (IV, Fixed, 95% CI) | ‐7.99 [‐22.60, 6.62] |
| 4 Number of antihypertensive drugs Show forest plot | 3 | 1717 | Mean Difference (IV, Fixed, 95% CI) | ‐0.18 [‐0.34, ‐0.03] |
| 5 Cardiovascular adverse events Show forest plot | 7 | 2110 | Peto Odds Ratio (Peto, Fixed, 95% CI) | 0.91 [0.75, 1.11] |
| 6 Renal adverse events Show forest plot | 7 | 2104 | Peto Odds Ratio (Peto, Fixed, 95% CI) | 1.02 [0.75, 1.38] |