| 1 Idoxuridine versus inactive control: 7‐day & 14‐day healing Show forest plot | 10 | | Risk Ratio (M‐H, Fixed, 95% CI) | Subtotals only |
|
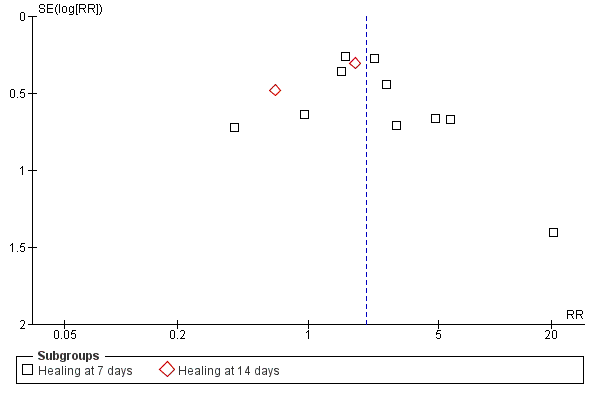
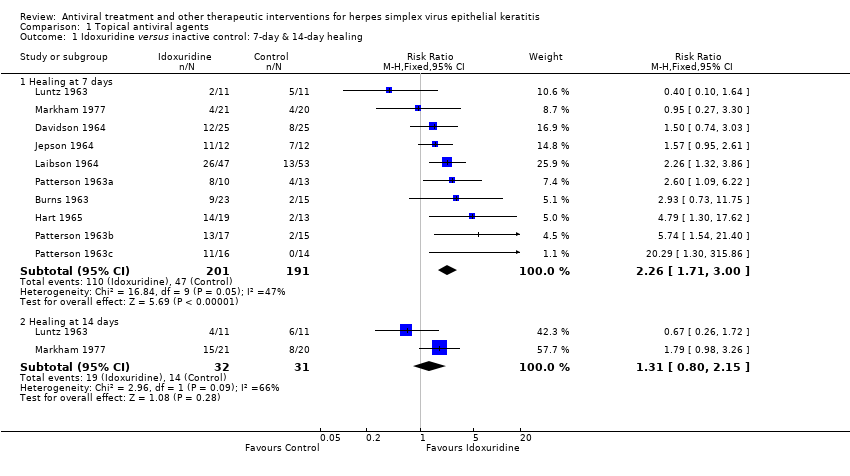
| 1.1 Healing at 7 days | 10 | 392 | Risk Ratio (M‐H, Fixed, 95% CI) | 2.26 [1.71, 3.00] |
| 1.2 Healing at 14 days | 2 | 63 | Risk Ratio (M‐H, Fixed, 95% CI) | 1.31 [0.80, 2.15] |
| 2 Idoxuridine versus inactive control: healing rate Show forest plot | 3 | 95 | Hazard Ratio (95% CI) | 2.02 [1.16, 3.49] |
|
| 3 Vidarabine versus inactive control: 7‐day & 14‐day healing Show forest plot | 1 | | Risk Ratio (M‐H, Fixed, 95% CI) | Subtotals only |
|
| 3.1 Healing at 7 days | 1 | 43 | Risk Ratio (M‐H, Fixed, 95% CI) | 2.17 [0.81, 5.87] |
| 3.2 Healing at 14 days | 1 | 43 | Risk Ratio (M‐H, Fixed, 95% CI) | 1.96 [1.10, 3.49] |
| 4 Vidarabine versus inactive control: healing rate Show forest plot | 1 | 43 | Hazard Ratio (95% CI) | 2.47 [1.14, 5.33] |
|
| 5 Vidarabine versus idoxuridine: 7‐day & 14‐day healing Show forest plot | 3 | | Risk Ratio (M‐H, Fixed, 95% CI) | Subtotals only |
|
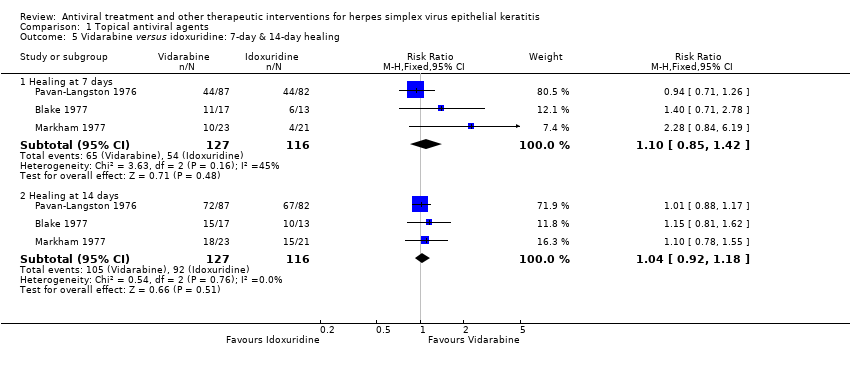
| 5.1 Healing at 7 days | 3 | 243 | Risk Ratio (M‐H, Fixed, 95% CI) | 1.10 [0.85, 1.42] |
| 5.2 Healing at 14 days | 3 | 243 | Risk Ratio (M‐H, Fixed, 95% CI) | 1.04 [0.92, 1.18] |
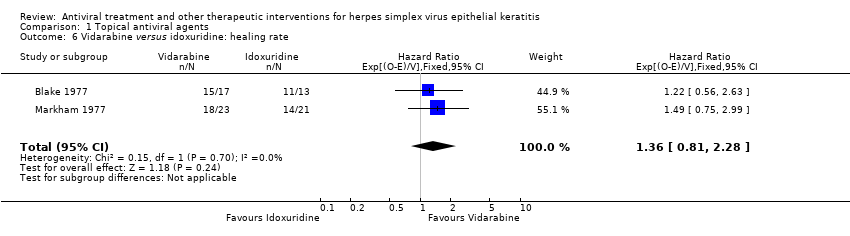
| 6 Vidarabine versus idoxuridine: healing rate Show forest plot | 2 | 74 | Hazard Ratio (95% CI) | 1.36 [0.81, 2.28] |
|
| 7 para‐Fluorophenylalanine versus idoxuridine: 7‐day & 14‐day healing Show forest plot | 3 | | Risk Ratio (M‐H, Fixed, 95% CI) | Subtotals only |
|
| 7.1 Healing at 7 days: without débridement | 2 | 85 | Risk Ratio (M‐H, Fixed, 95% CI) | 0.95 [0.59, 1.54] |
| 7.2 Healing at 14 days: without débridement | 2 | 85 | Risk Ratio (M‐H, Fixed, 95% CI) | 0.92 [0.75, 1.14] |
| 7.3 Healing at 7 days: with débridement | 1 | 33 | Risk Ratio (M‐H, Fixed, 95% CI) | 1.12 [0.87, 1.43] |
| 7.4 Healing at 14 days: with débridement | 1 | 33 | Risk Ratio (M‐H, Fixed, 95% CI) | 0.99 [0.83, 1.18] |
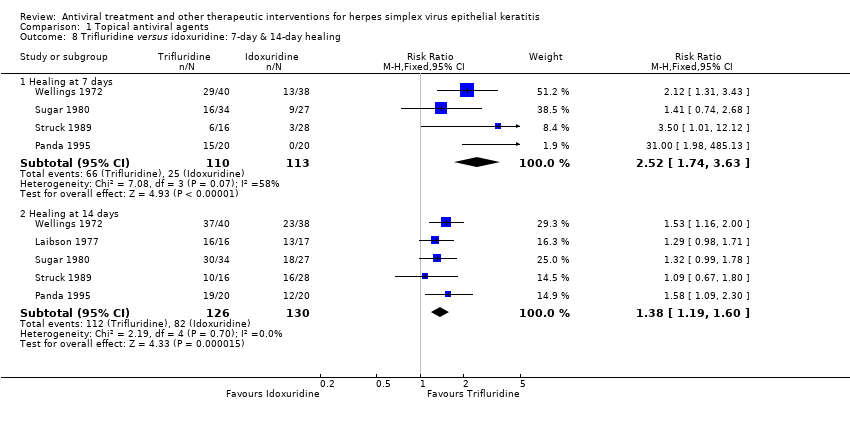
| 8 Trifluridine versus idoxuridine: 7‐day & 14‐day healing Show forest plot | 5 | | Risk Ratio (M‐H, Fixed, 95% CI) | Subtotals only |
|
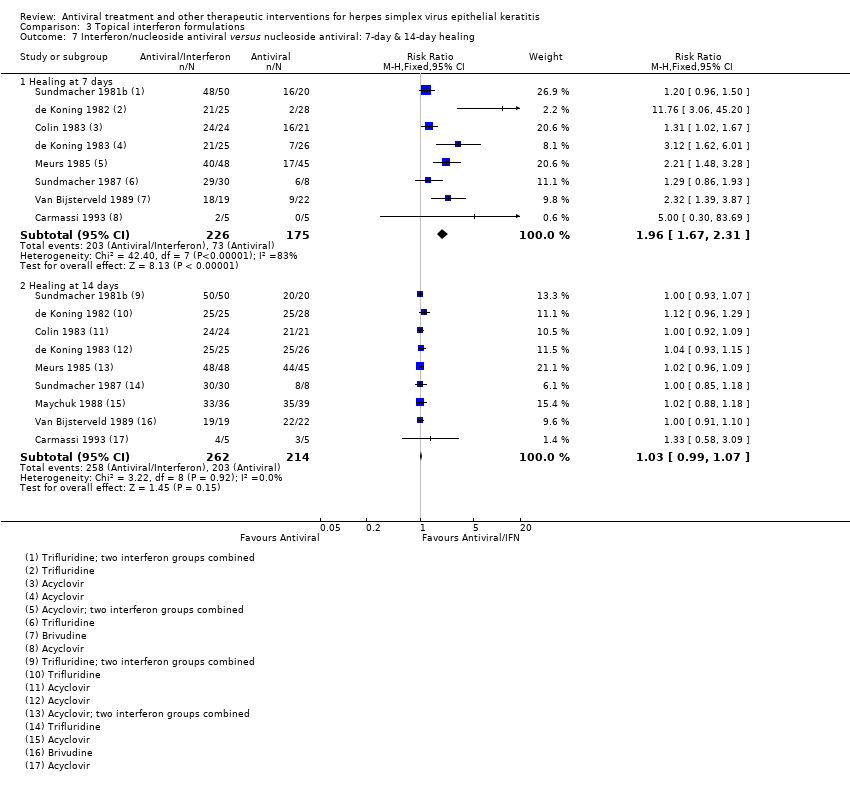
| 8.1 Healing at 7 days | 4 | 223 | Risk Ratio (M‐H, Fixed, 95% CI) | 2.52 [1.74, 3.63] |
| 8.2 Healing at 14 days | 5 | 256 | Risk Ratio (M‐H, Fixed, 95% CI) | 1.38 [1.19, 1.60] |
| 9 Trifluridine versus idoxuridine: healing rate Show forest plot | 1 | 78 | Hazard Ratio (95% CI) | 2.29 [1.37, 3.83] |
|
| 10 Acyclovir versus idoxuridine: 7‐day & 14‐day healing Show forest plot | 12 | | Risk Ratio (M‐H, Fixed, 95% CI) | Subtotals only |
|
| 10.1 Healing at 7 days: acyclovir vs. idoxuridine | 9 | 468 | Risk Ratio (M‐H, Fixed, 95% CI) | 1.96 [1.64, 2.34] |
| 10.2 Healing at 14 days: acyclovir vs. idoxuridine | 11 | 606 | Risk Ratio (M‐H, Fixed, 95% CI) | 1.23 [1.14, 1.32] |
| 10.3 Healing at 7 days: acyclovir vs. iododeoxycytidine | 1 | 32 | Risk Ratio (M‐H, Fixed, 95% CI) | 1.42 [0.76, 2.63] |
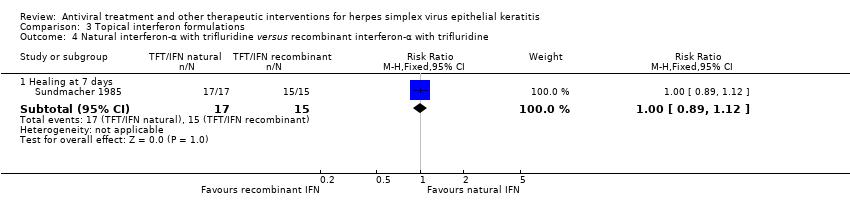
| 10.4 Healing at 14 days: acyclovir vs. iododeoxycytidine | 1 | 32 | Risk Ratio (M‐H, Fixed, 95% CI) | 1.0 [0.89, 1.12] |
| 11 Acyclovir versus idoxuridine: healing rate Show forest plot | 8 | 355 | Hazard Ratio (95% CI) | 2.15 [1.70, 2.72] |
|
| 12 Brivudine versus idoxuridine: 7‐day & 14‐day healing Show forest plot | 2 | | Risk Ratio (M‐H, Fixed, 95% CI) | Subtotals only |
|
| 12.1 Healing at 7 days | 2 | 99 | Risk Ratio (M‐H, Fixed, 95% CI) | 7.94 [2.80, 22.53] |
| 12.2 Healing at 14 days | 2 | 99 | Risk Ratio (M‐H, Fixed, 95% CI) | 1.38 [1.05, 1.81] |
| 13 Trifluridine versus vidarabine: 7‐day & 14‐day healing Show forest plot | 4 | | Risk Ratio (M‐H, Fixed, 95% CI) | Subtotals only |
|
| 13.1 Healing at 7 days: all groups | 4 | 288 | Risk Ratio (M‐H, Fixed, 95% CI) | 1.05 [0.91, 1.22] |
| 13.2 Healing at 14 days: all groups | 3 | 188 | Risk Ratio (M‐H, Fixed, 95% CI) | 1.09 [0.98, 1.22] |
| 13.3 Healing at 7 days: geographic epithelial keratitis | 1 | 30 | Risk Ratio (M‐H, Fixed, 95% CI) | 1.31 [0.55, 3.13] |
| 13.4 Healing at 14 days: geographic epithelial keratitis | 1 | 30 | Risk Ratio (M‐H, Fixed, 95% CI) | 1.96 [1.16, 3.33] |
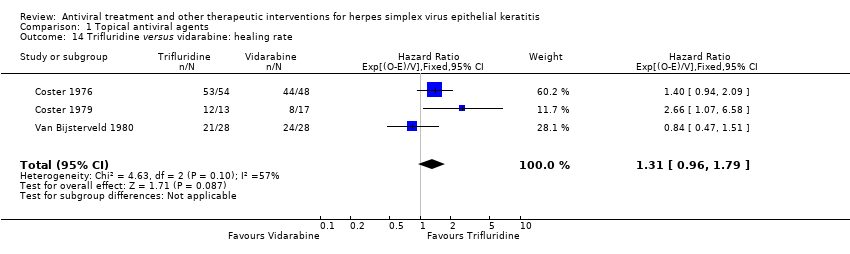
| 14 Trifluridine versus vidarabine: healing rate Show forest plot | 3 | 188 | Hazard Ratio (95% CI) | 1.31 [0.96, 1.79] |
|
| 15 Acyclovir versus vidarabine: 7‐day & 14‐day healing Show forest plot | 7 | | Risk Ratio (M‐H, Fixed, 95% CI) | Subtotals only |
|
| 15.1 Healing at 7 days: all groups | 6 | 314 | Risk Ratio (M‐H, Fixed, 95% CI) | 1.23 [1.05, 1.44] |
| 15.2 Healing at 14 days: all groups | 7 | 342 | Risk Ratio (M‐H, Fixed, 95% CI) | 1.09 [1.00, 1.18] |
| 15.3 Healing at 7 days: geographic epithelial keratitis | 1 | 51 | Risk Ratio (M‐H, Fixed, 95% CI) | 1.66 [0.94, 2.94] |
| 15.4 Healing at 14 days: geographic epithelial keratitis | 1 | 51 | Risk Ratio (M‐H, Fixed, 95% CI) | 0.85 [0.63, 1.14] |
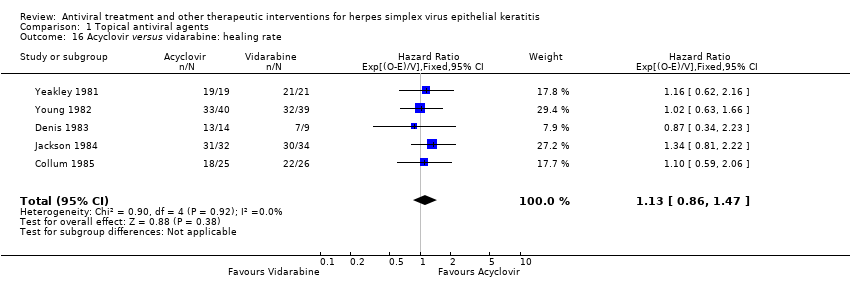
| 16 Acyclovir versus vidarabine: healing rate Show forest plot | 5 | 259 | Hazard Ratio (95% CI) | 1.13 [0.86, 1.47] |
|
| 17 Acyclovir versus trifluridine: 7‐day & 14‐day healing Show forest plot | 4 | | Risk Ratio (M‐H, Fixed, 95% CI) | Subtotals only |
|
| 17.1 Healing at 7 days | 4 | 178 | Risk Ratio (M‐H, Fixed, 95% CI) | 0.99 [0.82, 1.20] |
| 17.2 Healing at 14 days | 4 | 178 | Risk Ratio (M‐H, Fixed, 95% CI) | 0.99 [0.90, 1.09] |
| 18 Acyclovir versus trifluridine: healing rate Show forest plot | 3 | 140 | Hazard Ratio (95% CI) | 0.92 [0.65, 1.32] |
|
| 19 Brivudine versus trifluridine: 7‐day & 14‐day healing Show forest plot | 3 | | Risk Ratio (M‐H, Fixed, 95% CI) | Subtotals only |
|
| 19.1 Healing at 7 days | 3 | 147 | Risk Ratio (M‐H, Fixed, 95% CI) | 0.93 [0.71, 1.21] |
| 19.2 Healing at 14 days | 3 | 147 | Risk Ratio (M‐H, Fixed, 95% CI) | 1.00 [0.88, 1.14] |
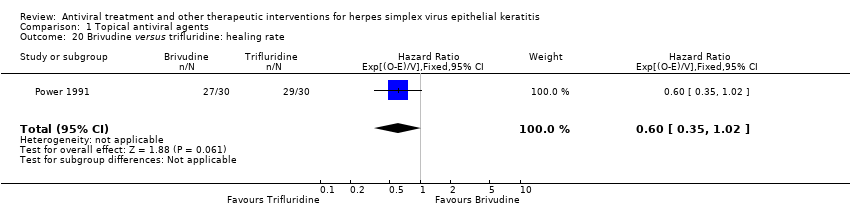
| 20 Brivudine versus trifluridine: healing rate Show forest plot | 1 | 60 | Hazard Ratio (95% CI) | 0.60 [0.35, 1.02] |
|
| 21 Brivudine versus acyclovir: 7‐day & 14‐day healing Show forest plot | 1 | | Risk Ratio (M‐H, Fixed, 95% CI) | Subtotals only |
|
| 21.1 Healing at 7 days | 1 | 40 | Risk Ratio (M‐H, Fixed, 95% CI) | 1.19 [0.93, 1.51] |
| 21.2 Healing at 14 days | 1 | 40 | Risk Ratio (M‐H, Fixed, 95% CI) | 1.05 [0.92, 1.20] |
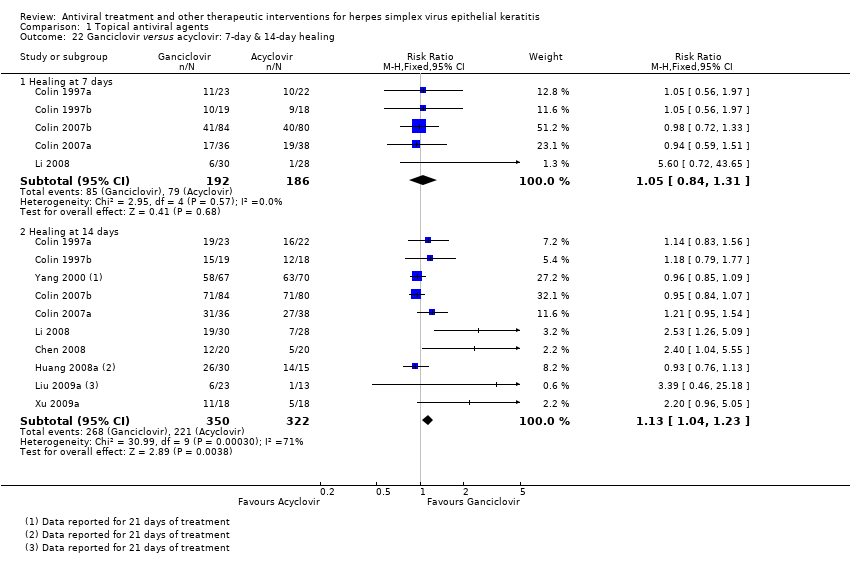
| 22 Ganciclovir versus acyclovir: 7‐day & 14‐day healing Show forest plot | 10 | | Risk Ratio (M‐H, Fixed, 95% CI) | Subtotals only |
|
| 22.1 Healing at 7 days | 5 | 378 | Risk Ratio (M‐H, Fixed, 95% CI) | 1.05 [0.84, 1.31] |
| 22.2 Healing at 14 days | 10 | 672 | Risk Ratio (M‐H, Fixed, 95% CI) | 1.13 [1.04, 1.23] |
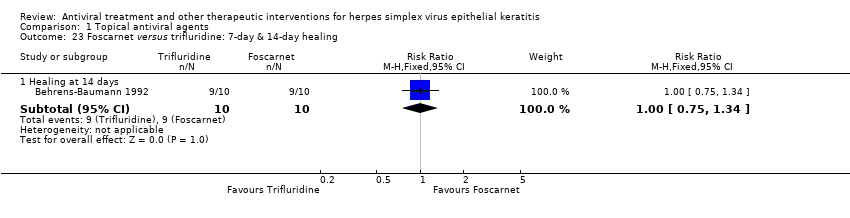
| 23 Foscarnet versus trifluridine: 7‐day & 14‐day healing Show forest plot | 1 | | Risk Ratio (M‐H, Fixed, 95% CI) | Subtotals only |
|
| 23.1 Healing at 14 days | 1 | 20 | Risk Ratio (M‐H, Fixed, 95% CI) | 1.0 [0.75, 1.34] |
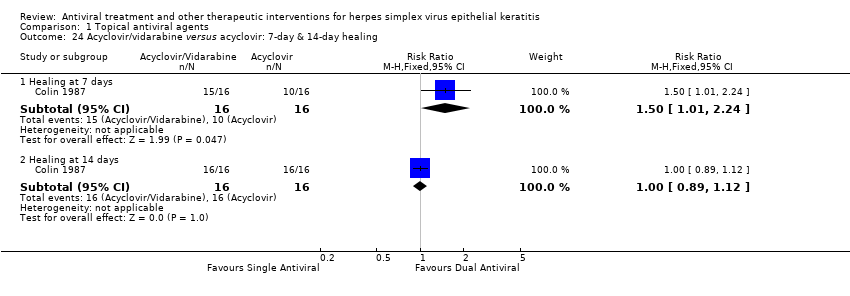
| 24 Acyclovir/vidarabine versus acyclovir: 7‐day & 14‐day healing Show forest plot | 1 | | Risk Ratio (M‐H, Fixed, 95% CI) | Subtotals only |
|
| 24.1 Healing at 7 days | 1 | 32 | Risk Ratio (M‐H, Fixed, 95% CI) | 1.5 [1.01, 2.24] |
| 24.2 Healing at 14 days | 1 | 32 | Risk Ratio (M‐H, Fixed, 95% CI) | 1.0 [0.89, 1.12] |
| 25 Trifluridine (aqueous) versus trifluridine (viscous) Show forest plot | 1 | | Risk Ratio (M‐H, Fixed, 95% CI) | Subtotals only |
|
| 25.1 Healing at 7 days | 1 | 20 | Risk Ratio (M‐H, Fixed, 95% CI) | 1.53 [0.58, 4.05] |
| 25.2 Healing at 14 days | 1 | 20 | Risk Ratio (M‐H, Fixed, 95% CI) | 1.52 [0.96, 2.41] |
| 26 Ganciclovir 0.15% versus ganciclovir 0.05% Show forest plot | 2 | | Risk Ratio (M‐H, Fixed, 95% CI) | Subtotals only |
|
| 26.1 Healing at 7 days | 1 | 45 | Risk Ratio (M‐H, Fixed, 95% CI) | 0.96 [0.53, 1.74] |
| 26.2 Healing at 14 days | 2 | 116 | Risk Ratio (M‐H, Fixed, 95% CI) | 1.07 [0.90, 1.28] |