Intervenciones individuales para reducir el estrés laboral del personal sanitario
Resumen
Antecedentes
El personal sanitario puede sufrir estrés laboral como consecuencia de un desequilibrio entre las exigencias, las capacidades y el apoyo social en el trabajo. Esto puede provocar estrés, desgaste profesional y problemas psicosomáticos, así como el deterioro de la prestación de los servicios. Se trata de una actualización de una revisión Cochrane que se actualizó por última vez en 2015, y que en este caso se ha dividido en dos partes: esta revisión y una revisión sobre intervenciones a nivel institucional.
Objetivos
Evaluar la efectividad de las intervenciones de reducción del estrés dirigidas a trabajadores sanitarios individuales en comparación con ninguna intervención, lista de espera, placebo, ninguna intervención para reducir el estrés u otro tipo de intervención de reducción del estrés para reducir los síntomas de estrés.
Métodos de búsqueda
Se utilizó la versión anterior de la revisión como una fuente de estudios (fecha de búsqueda: noviembre de 2013). Se realizaron búsquedas en el Registro Cochrane central de ensayos controlados (Cochrane Central Register of Controlled Trials; CENTRAL), MEDLINE, Embase, PsycINFO, CINAHL, Web of Science y en un registro de ensayos desde 2013 hasta febrero de 2022.
Criterios de selección
Se incluyeron los ensayos controlados aleatorizados (ECA) que evaluaron la efectividad de las intervenciones para el estrés dirigidas a los trabajadores sanitarios. Solo se incluyeron intervenciones dirigidas a trabajadores sanitarios individuales con el objetivo de reducir los síntomas de estrés.
Obtención y análisis de los datos
Dos autores de la revisión seleccionaron de forma independiente los ensayos para inclusión, evaluaron el riesgo de sesgo y extrajeron los datos. Se utilizaron los procedimientos metodológicos estándar previstos por Cochrane. Las intervenciones se clasificaron en las que:
1. centraron la atención en la (modificación de la) experiencia de estrés (pensamientos, sentimientos, comportamiento);
2. desviaron la atención de la experiencia de estrés por diversos medios de desconexión psicológica (p. ej., relajación, ejercicios);
3. modificaron los factores de riesgo relacionados con el trabajo a nivel individual; y las que
4. combinaron dos o más de las anteriores.
La medida de desenlace fundamental estuvo relacionada con los síntomas de estrés medidos con diversos cuestionarios autoinformados, como el Maslach Burnout Inventory (MBI), medidos a corto plazo (hasta tres meses inclusive después de finalizar la intervención), a medio plazo (> 3 a 12 meses después de finalizar la intervención) y en el seguimiento a largo plazo (> 12 meses después de finalizar la intervención).
Resultados principales
Esta es la segunda actualización de la revisión Cochrane original publicada en 2006, número 4. Esta actualización de la revisión incluye 89 estudios nuevos, lo que eleva el número total de estudios de la revisión actual a 117, con un total de 11 119 participantes asignados al azar.
El número de participantes por grupo de estudio fue ≥ 50 en 32 estudios. El riesgo de sesgo más importante fue la falta de cegamiento de los participantes.
Centrar la atención en la experiencia de estrés versus ninguna intervención/lista de espera/placebo/ninguna intervención para reducir el estrés
Cincuenta y dos estudios analizaron una intervención centrada en la experiencia de estrés. En general, estas intervenciones podrían dar lugar a una reducción de los síntomas de estrés a corto plazo (diferencia de medias estandarizada [DME] ‐0,37; intervalo de confianza [IC] del 95%: ‐0,52 a ‐0,23; 41 ECA; 3645 participantes; evidencia de certeza baja) y a medio plazo (DME ‐0,43; IC del 95%: ‐0,71 a ‐0,14; 19 ECA; 1851 participantes; evidencia de certeza baja). La DME del resultado a corto plazo se traduce en 4,6 puntos menos en la escala de agotamiento emocional del MBI (MBI‐EE, una escala de 0 a 54). Es muy incierta la evidencia relacionada con centrar la atención en la experiencia de estrés (un ECA; 68 participantes, evidencia de certeza muy baja) en el efecto a largo plazo sobre los síntomas de estrés.
Desviar la atención de la experiencia de estrés versus ninguna intervención/lista de espera/placebo/ninguna intervención para reducir el estrés
Cuarenta y dos estudios evaluaron una intervención en la que se desvió la atención de la experiencia de estrés. En general, estas intervenciones podrían dar lugar a una reducción de los síntomas de estrés a corto plazo (diferencia de medias estandarizada [DME] ‐0,55; intervalo de confianza [IC] del 95%: ‐0,70 a ‐0,40; 35 ECA; 2366 participantes; evidencia de certeza baja) y a medio plazo (DME ‐0,41; IC del 95%: ‐0,79 a ‐0,03; seis ECA; 427 participantes; evidencia de certeza baja). La DME a corto plazo se traduce en 6,8 puntos menos en el MBI‐EE. Ningún estudio informó del efecto a largo plazo.
Centrarse en factores individuales relacionados con el trabajo versus ninguna intervención/ninguna intervención para reducir el estrés
Siete estudios estudiaron una intervención centrada en la modificación de factores relacionados con el trabajo. La evidencia acerca de los efectos a corto plazo (ninguna estimación del efecto agrupado; tres ECA; 87 participantes; evidencia de certeza muy baja) y los efectos a medio y largo plazo (ninguna estimación del efecto agrupado; dos ECA; 152 participantes, y un ECA; 161 participantes, evidencia de certeza muy baja) de este tipo de intervención para el control del estrés es muy incierta.
Una combinación de intervenciones a nivel individual versus ninguna intervención/lista de espera/ninguna intervención para reducir el estrés
Diecisiete estudios estudiaron una combinación de intervenciones. A corto plazo, este tipo de intervención podría dar lugar a una reducción de los síntomas de estrés (DME ‐0,67; IC del 95%: ‐0,95 a ‐0,39; 15 ECA; 1003 participantes; evidencia de certeza baja). La DME se traduce en 8,2 puntos menos en el MBI‐EE. A medio plazo, una combinación de intervenciones a nivel individual podría dar lugar a una reducción de los síntomas de estrés, pero la evidencia no excluye la falta de efecto (DME ‐0,48; IC del 95%: ‐0,95 a 0,00; seis ECA; 574 participantes; evidencia de certeza baja). La evidencia acerca de los efectos a largo plazo de una combinación de intervenciones sobre los síntomas de estrés (un ECA, 88 participantes; evidencia de certeza muy baja) es muy incierta.
Centrar la atención en el estrés versus otro tipo de intervención
Tres estudios compararon centrarse en el estrés versus desviar la atención del estrés y un estudio comparó una combinación de intervenciones versus centrarse en el estrés. La evidencia sobre qué tipo de intervención es mejor, o si su efecto es similar, es muy incierta .
Conclusiones de los autores
Esta revisión muestra que podría haber un efecto sobre la reducción del estrés en los trabajadores sanitarios a partir de intervenciones a nivel individual sobre el estrés, tanto si centran la atención en la experiencia de estrés como si desvían la atención de esta. Este efecto podría durar hasta un año después de finalizar la intervención. Una combinación de intervenciones también podría tener efectos beneficiosos, al menos a corto plazo. Aún se desconocen los efectos a largo plazo de las intervenciones de control del estrés a nivel individual. Lo mismo se puede decir de las intervenciones sobre los factores de riesgo (a nivel individual) relacionados con el trabajo.
La evaluación del sesgo de los estudios de esta revisión mostró la necesidad de estudios metodológicamente mejor diseñados y realizados, ya que casi todos los estudios carecían de informar adecuadamente de los procedimientos de asignación al azar, había una falta de cegamiento de los participantes y una falta de registro del ensayo. Se necesitan ensayos mejor diseñados con tamaños muestrales más grandes para aumentar la certeza de la evidencia. Por último, se necesitan más estudios sobre intervenciones centradas en los factores de riesgo relacionados con el trabajo.
PICO
Resumen en términos sencillos
Efecto de las intervenciones individuales para reducir el estrés laboral del personal sanitario
Mensajes clave
‐ Las intervenciones individuales en las que la atención se centra en la experiencia de estrés (como centrarse en los pensamientos, los sentimientos, el comportamiento) o la atención se desvía de la experiencia de estrés (como hacer ejercicio, relajarse) podrían reducir el estrés entre los trabajadores sanitarios hasta un año después de la intervención.
‐ Una combinación de intervenciones individuales podría reducir el estrés hasta un par de meses después de la intervención.
‐ No se sabe si las intervenciones centradas en los factores de riesgo relacionados con el trabajo a nivel individual tienen algún efecto sobre el estrés.
¿Qué es el estrés?
Actualmente no existe una definición clara de estrés (laboral). Esta revisión trata sobre el personal sanitario con niveles de estrés de bajos a moderados y con desgaste profesional, que pueden provocar depresión y ansiedad, pero no tienen por qué. Las personas con estrés pueden experimentar síntomas físicos como dolores de cabeza, tensión muscular o dolor, pero también mentales, como problemas de concentración. También pueden tener problemas de comportamiento (como conflictos con otras personas) y problemas emocionales (como inestabilidad emocional).
¿Qué se puede hacer contra el estrés del personal sanitario?
El estrés entre el personal sanitario se puede abordar a nivel organizativo, pero también a nivel individual. Las intervenciones de control del estrés a nivel individual tienen como objetivo:
‐centrarla atención en la experiencia de estrés (pensamientos, sentimientos, comportamiento), por ejemplo mediante la terapia cognitivo‐conductual o la capacitación en habilidades de afrontamiento;
‐ desviar la atención de la experiencia de estrés, por ejemplo mediante yoga, Tai Chi, el dibujo o la acupuntura;
‐ modificar los factores de riesgo relacionados con el trabajo a nivel individual, como las variaciones en las exigencias.
¿Qué se quería averiguar?
Se quería averiguar si varios tipos de intervenciones de control del estrés a nivel individual son mejores que ninguna intervención (u otra intervención) para reducir el estrés en los trabajadores sanitarios que actualmente ejercen como tales.
¿Qué se hizo?
Se buscaron estudios que analizaran intervenciones para el control del estrés en los trabajadores sanitarios e informaran sobre los síntomas de estrés. El personal sanitario comprende una amplia variedad de profesiones y ocupaciones que prestan algún tipo de servicio sanitario, incluidos los profesionales de atención directa y los profesionales afines.
Los resultados de los estudios se compararon y resumieron y la confianza en la evidencia se calificó según factores como la metodología y el tamaño de los estudios.
¿Qué se encontró?
Se encontraron 117 estudios en los que participaron 11 119 profesionales sanitarios. La mayoría de los estudios siguieron a los participantes hasta tres meses y algunos hasta 12 meses, pero solo unos pocos estudios los siguieron más de un año.
Se determinó que podría haber un efecto en la reducción del estrés en los trabajadores sanitarios a partir de las intervenciones de control del estrés, tanto si centran la atención en la experiencia de estrés como si la desvían de ella. Este efecto podría durar hasta un año después de finalizar la intervención. Una combinación de intervenciones también podría tener efectos beneficiosos, al menos a corto plazo. Aún se desconocen los efectos a largo plazo de las intervenciones de control del estrés, más allá de un año después de finalizar la intervención. Lo mismo se puede decir de las intervenciones sobre los factores de riesgo (a nivel individual) relacionados con el trabajo.
¿Cuáles son las limitaciones de la evidencia?
Las estimaciones de los efectos de las intervenciones de control del estrés a nivel individual podrían estar sesgadas debido a la falta de cegamiento de los participantes de los estudios incluidos. Además, muchos estudios eran relativamente pequeños. En conjunto, la confianza en los efectos encontrados es reducida.
¿Cuál es el grado de actualización de esta evidencia?
La evidencia está actualizada hasta febrero de 2022.
Authors' conclusions
Summary of findings
| An intervention in which one's attention is on the experience of stress compared to no intervention/wait list/placebo/no stress‐reduction intervention for stress reduction in healthcare workers | ||||
| Patient or population: healthcare workers | ||||
| Outcomes | Anticipated absolute effects* (95% CI) | № of participants | Certainty of the evidence | What happens |
|---|---|---|---|---|
| Effect with an intervention in which one's attention is on the experience of stress | ||||
| Stress symptoms (follow‐up up to and including 3 months after end of intervention) | SMD 0.37 lower | 3645 | ⊕⊕⊝⊝ | On the short term, an intervention in which one's attention is on the experience of stress may result in a reduction in stress symptoms. The standardized mean difference translates back to 4.6 fewer (6.4 fewer to 2.8 fewer) points on the MBI‐emotional exhaustion scale2. |
| Stress symptoms (follow‐up > 3 to 12 months after end of intervention) | SMD 0.43 lower | 1851 | ⊕⊕⊝⊝ | On the medium term, focus one's attention on the experience of stress may result in a reduction in stress symptoms. The standardized mean difference translates back to 5.3 fewer (8.7 fewer to 1.7 fewer) points on the MBI‐emotional exhaustion scale3. |
| Stress symptoms (follow‐up >12 months after end of intervention) | no effect estimate | 68 | ⊕⊝⊝⊝ | The evidence is very uncertain about the long‐term effect on stress symptoms of focusing one's attention on the experience of stress. |
| *The risk in the intervention group (and its 95% confidence interval) is based on the assumed risk in the comparison group and the relative effect of the intervention (and its 95% CI). | ||||
| GRADE Working Group grades of evidence | ||||
| 1 The certainty of the evidence was downgraded by two levels for very serious risk of bias (bias arising from the randomisation process and lack of blinding; i.e. performance bias) in combination with some inconsistency and suspicion of publication bias. 2 The certainty of the evidence was downgraded by three levels for very serious risk of bias (bias arising from the randomisation process and lack of blinding; i.e. performance bias) and very serious imprecision (small sample size, the confidence interval includes both a benefit and a harm). 3 The MBI‐Emotional exhaustion scale has a total score of 54 and we used the mean score (23.6) and standard deviation (12.2) of the control healthcare workers population in Fiol DeRoque 2021 as reference for interpreting the effect sizes. A score below 18 points is regarded as a low score on emotional exhaustion and a score above 36 as a high score on emotional exhaustion (Maslach 1996). | ||||
| An intervention in which one's attention is away from the experience of stress compared to no intervention/wait list/placebo/no stress‐reduction intervention for stress reduction in healthcare workers | ||||
| Patient or population: healthcare workers | ||||
| Outcomes | Anticipated absolute effects* (95% CI) | № of participants | Certainty of the evidence | What happens |
|---|---|---|---|---|
| Risk with an intervention in which one's attention is away from the experience of stress | ||||
| Stress symptoms (follow‐up up to and including 3 months after end of intervention) | SMD 0.55 lower | 2366 | ⊕⊕⊝⊝ | On the short term, an intervention in which one's attention is away from the experience of stress may result in a reduction in stress symptoms. The standardized mean difference translates back to 6.8 fewer (8.6 fewer to 4.9 fewer) points on the MBI‐emotional exhaustion scale2. |
| Stress symptoms (follow‐up > 3 to 12 months after end of intervention) | SMD 0.41 lower | 427 | ⊕⊕⊝⊝ | On the medium term, an intervention in which one's attention is away from the experience of stress may result in a reduction in stress symptoms. The standardized mean difference translates back to 5.0 fewer (9.7 fewer to 0.4 fewer) points on the MBI‐emotional exhaustion scale2. |
| Stress symptoms (follow‐up >12 months after end of intervention) | ‐ | (0 RCTs) | ‐ | No studies reported the long‐term effect on stress symptoms of focusing one's attention away from the experience of stress. |
| *The risk in the intervention group (and its 95% confidence interval) is based on the assumed risk in the comparison group and the relative effect of the intervention (and its 95% CI). | ||||
| GRADE Working Group grades of evidence | ||||
| 1 The certainty of the evidence was downgraded by two levels for very serious risk of bias (bias arising from the randomisation process and lack of blinding; i.e. performance bias) in combination with some inconsistency and suspicion of publication bias. 3 The MBI‐emotional exhaustion scale has a total score of 54 and we used the mean score (23.6) and standard deviation (12.2) of the control healthcare workers population in Fiol DeRoque 2021 as reference for interpreting the effect sizes. A score below 18 points is regarded as a low score on emotional exhaustion and a score above 36 as a high score on emotional exhaustion (Maslach 1996). | ||||
| An intervention in which the focus is on work‐related risk factors on an individual level compared to no intervention/no stress‐reduction intervention for stress reduction in healthcare workers | ||||
| Patient or population: healthcare workers | ||||
| Outcomes | Anticipated absolute effects* (95% CI) | № of participants | Certainty of the evidence | What happens |
|---|---|---|---|---|
| Effect with an intervention in which the focus is on work‐related risk factors on an individual level | ||||
| Stress symptoms (follow‐up up to and including 3 months after end of intervention) | no effect estimate | 87 | ⊕⊝⊝⊝ | The evidence is very uncertain about the short‐term effect of an intervention in which the focus is on work‐related risk factors on stress symptoms. |
| Stress symptoms (follow‐up > 3 to 12 months after end of intervention) | no effect estimate | 152 | ⊕⊝⊝⊝ | The evidence is very uncertain about the medium‐term effect of an intervention in which the focus is on work‐related risk factors on stress symptoms. |
| Stress symptoms (follow‐up >12 months after end of intervention) | no effect estimate | 161 | ⊕⊝⊝⊝ | The evidence is very uncertain about the long‐term effect of an intervention in which the focus is on work‐related risk factors on stress symptoms. |
| *The risk in the intervention group (and its 95% confidence interval) is based on the assumed risk in the comparison group and the relative effect of the intervention (and its 95% CI). | ||||
| GRADE Working Group grades of evidence | ||||
| 1 The certainty of the evidence was downgraded by three levels for very serious risk of bias (bias arising from the randomisation process and lack of blinding; i.e. performance bias), inconsistency and very serious imprecision (small sample size, the confidence interval includes both a benefit and a harm). 2 The certainty of the evidence was downgraded by three levels for very serious risk of bias (bias arising from the randomisation process and lack of blinding; i.e. performance bias) and very serious imprecision (small sample size, the confidence interval includes both a benefit and no effect). | ||||
| A combination of individual‐level interventions compared to no intervention/wait list/no stress‐reduction intervention for stress reduction in healthcare workers | ||||
| Patient or population: healthcare workers | ||||
| Outcomes | Anticipated absolute effects* (95% CI) | № of participants | Certainty of the evidence | What happens |
|---|---|---|---|---|
| Effect with a combination of individual‐level interventions | ||||
| Stress symptoms (follow‐up up to and including 3 months after end of intervention) | SMD 0.67 lower | 1003 | ⊕⊕⊝⊝ | On the short term, a combination of individual‐level interventions may result in a reduction in stress symptoms. The standardized mean difference translates back to 8.2 fewer (11.7 fewer to 4.8 fewer) points on the MBI‐Emotional exhaustion scale4. |
| Stress symptoms (follow‐up > 3 to 12 months after end of intervention) | SMD 0.48 lower | 574 | ⊕⊕⊝⊝ | On the medium term, a combination of individual‐level interventions may result in a reduction in stress symptoms, but the evidence does not exclude no effect. The standardized mean difference translates back to 5.9 fewer points (11.7 fewer to no difference) on the MBI‐Emotional exhaustion scale4. |
| Stress symptoms (follow‐up >12 months after end of intervention) | no effect estimate | 88 | ⊕⊝⊝⊝ | The evidence is very uncertain about the long‐term effect of a combination of individual‐level interventions on stress symptoms. |
| CI: confidence interval; SMD: standardized mean difference | ||||
| GRADE Working Group grades of evidence | ||||
| 1 The certainty of the evidence was downgraded by two levels for very serious risk of bias (bias arising from the randomisation process and lack of blinding; i.e. performance bias) in combination with some inconsistency and suspicion of publication bias. 2 The certainty of the evidence was downgraded by two levels for very serious risk of bias (lack of blinding; i.e. performance bias) and inconsistency. We did not downgrade for imprecision, as the wide confidence interval is due to the inconsistency between study results. 3 The certainty of the evidence was downgraded by three levels for very serious risk of bias (bias arising from the randomisation process and lack of blinding; i.e. performance bias) and very serious imprecision (small sample size, the confidence interval includes both a benefit and a harm). 4 The MBI‐emotional exhaustion scale has a total score of 54 and we used the mean score (23.6) and standard deviation (12.2) of the control HCW population in Fiol DeRoque 2021 as reference for interpreting the effect sizes. A score below 18 points is regarded as a low score on emotional exhaustion and a score above 36 as a high score on emotional exhaustion (Maslach 1996). | ||||
Background
This is the second update of the original Cochrane Review (Marine 2006) published in 2006, Issue 4. Healthcare workers can suffer from work‐related stress as a result of organisational factors and an imbalance of demands, skills, and social support at work. Prolonged exposure to these factors negatively impacts the service these workers are able to provide (Tawfik 2019). Frequently, this leads to severe distress, burnout, or psychosomatic disorders amongst healthcare works and subsequent deterioration in service quality (Tawfik 2019).
Description of the condition
Healthcare workers are at high risk of work‐related stress compared to the general working population. Prolonged exposure to work‐related stressors can overwhelm the coping capacities of healthcare workers leading to work‐related stress, which can gradually develop into a Stress‐Related Disorder (SRD) (van der Molen 2020). Symptoms of stress or SRDs, can manifest as physical (e.g. headaches, muscle tension or pain), mental (impaired concentration), behavioural (conflict with other people), and emotional (emotional instability) problems (van Dam 2021).
It is challenging to determine the prevalence of SRDs globally as there is little agreement on the case definition (De Hert 2020). However, multiple studies report high levels of stress and burnout in groups of healthcare workers representing various disciplines. For example, Bridgeman 2018 reported that 30% to 70% of physicians and nurses experience burnout symptoms, while another study reported that 56% of anaesthesiologists experience burnout symptoms (Bridgeman 2018; De Hert 2020; Sanfilippo 2017).
There are a variety of factors in the workplace that may contribute to SRDs, such as lack of role clarity, effort–reward imbalance, systemic inequities, lack of social support, high emotional demands, and lack of decision authority (Bridgeman 2018; van der Molen 2020). Besides, personal factors, such as perfectionism or high standards, may also add to stress suggesting a multifactorial contribution to the development of SRDs (De Hert 2020).
The consequences of SRDs in healthcare workers are more far‐reaching than in some other professions as they can adversely affect the quality of patient care (Shanafelt 2010). Furthermore, the negative health effects for the individual healthcare worker should also not be underestimated as SRDs have been associated with coronary health problems, but also with low job satisfaction and cynicism (Bridgeman 2018; Costello 2016). SRDs may also affect healthcare organisations due to increased turnover rates and absenteeism (Maunder 2006). SRDs also have a large economic impact (Hassard 2018) which makes identifying effective interventions to reduce this burden an urgent one.
Description of the intervention
Interventions at both the organisational level and the individual employee level are needed to prevent and reduce work‐related stress in healthcare workers. The scope of this review is limited to stress management interventions at the individual level. After the previous update of this review, we decided to modify our approach in describing individual‐level stress interventions. For this purpose, we looked at stress as a generic term that refers to two distinct concepts, namely ‘stressors’ (environmental characteristics, or thoughts which cause an adverse reaction in the individual) and ‘strain’ (the individual’s adverse reaction to the stressor) (Bamber 2006; Beehr 1987; Knapp 1988). Given these concepts of stress, one can differentiate three separate avenues of intervention: 1. factors in one’s environment (e.g. work) that cause stress (the focus of the Cochrane Review by Giga 2018), 2. one’s thoughts relating to stress, and 3. the adverse emotional experience resulting from the former two. Various cognitive‐behavioural approaches aim to alleviate the experience of stress and prevent it from becoming chronic (e.g. burnout, depression or somatic illness) by changing the ways in which an individual worker thinks about and manages the perception of stressors in his/her work and the resulting thoughts and feelings. The third approach springs from the idea that the emotional experience of stress is harmful in itself, especially when extended over a long period of time, and so the aim of intervention is to alleviate the emotional response directly by, for example, relaxation techniques. In effect, something else is brought in to take the place mostly occupied by stressful thoughts and feelings (Bamber 2006; Beehr 1987; Knapp 1988). In order to maximise usability and intuitiveness of the results of our review, we reframed the latter two approaches as interventions that focus at thoughts and feelings related to stress and as interventions in which the focus is turned away from thoughts and feelings related to stress.
We conceptualised four distinct approaches to addressing work‐related stress at the individual level:
-
focus one’s attention on the (modification of the) experience of stress (thoughts, feelings, behaviours);
-
focus one’s attention away from the experience of stress by various means of psychological disengagement;
-
alter work‐related risk factors on an individual level; and
-
combine two or more of the above.
The first approach consists of, but is not limited to, the following: cognitive‐behavioural techniques: assertiveness training, coping skills training, and communication skills training. The second approach includes approaches such as relaxation, massage, mindfulness meditation, exercise (e.g. yoga, tai chi, stretch‐release, drawing, acupuncture, etc.), and playing or listening to music.
Note that with regard to mindfulness it is sometimes difficult to judge whether the central element of the intervention is to focus on the experience of stress or away from it. For example, the general principles of mindfulness‐based stress reduction and cognitive‐behavioural therapy are similar such as increased awareness, regulation, cognitive flexibility and goals‐based behaviours. However, some studies such as mindfulness‐meditation solely used mindfulness techniques to shift focus away from the experience of stress by directing attention to the present moment (Hofmann 2017; Tang 2015). We therefore categorise interventions like mindfulness‐based stress reduction as type 1 and mindfulness‐based meditation as type 2.
The third approach focus' on work‐related risk factors and typically includes planning, scheduling, adjusting work demands on an individual level.
The last approach consists of a combination of two or more of the first three approaches. For instance, combining cognitive behavioural techniques with relaxation.
How the intervention might work
By focusing on the experience of stress and its possible causes, it may be possible to manage one's thoughts, feelings, behaviours and to change these by learning new techniques to do so (Beck 2005). For example, cognitive behavioural therapy (CBT) focus' on the thoughts and feelings that drive behaviours. The overarching goal of this approach is to manage stress at work is to help individuals control the automatic thoughts that exacerbate emotional difficulties such as severe distress, burnout, and depression (Beck 2005).
By diverting one's attention away from the experience of stress by means of relaxation, exercise, or something else, it may be possible to reduce the overall experience of stress (Creswell 2014). The goal is to induce a state of mental and bodily calm in order to counteract the agitation caused by stress. This can be achieved by, for example, being a passive recipient of a massage (Mahdizadeh 2019), or by actively performing various exercises such as yoga (Fang 2015). The focus is thus directed towards a specific relaxing activity and away from the unpleasant thoughts and feelings associated with stress (Borges 2021).
Modifying work‐related risk factors on an individual level may also influence stress levels. An example of this approach is that healthcare workers can have a say in their own work schedule or can make adjustments to their workloads or receive training to identify what may cause stress and think about alterations they could make to their job to discuss with their supervisor (Arrigoni 2015).
Why it is important to do this review
An extensive number of reviews have been published on the effectiveness of interventions to reduce stress in healthcare workers (Aryankhesal 2019; Busireddy 2016; Patel 2019; Sanfilippo 2017; Wiederhold 2018; Zhang 2020). However, some reviews are focused on one specific group of healthcare workers like nurses or physicians (Aryankhesal 2019) and other reviews have only focused on the effectiveness of one type of intervention such as mindfulness (Fendel 2021). To the best of our knowledge there are no up‐to‐date reviews that examine the effectiveness of various types of individual‐level interventions aimed at reducing stress in various healthcare workers to provide a more complete overview. Despite the fact that healthcare workers consist of a multitude of job tasks and titles they still form a reasonably homogeneous population such that it is reasonable to assume interventions directed to them would achieve roughly similar results regardless of specific job title.
It is important to offer healthcare workers interventions that are aimed at reducing the adverse effects of stress. When prevention is offered in a timely manner, it can reduce stress and prevent SRDs. It is therefore important to investigate which interventions are effective (Alberdi 2016). Prevention of SRDs has several advantages. Firstly, it can protect the health of the healthcare workers (Bridgeman 2018). Second, it is also better for the quality of patient care (De Hert 2020). And lastly, there is already a shortage of healthcare workers due to high turnover rates and effective prevention of SRDs may help reduce this. However, there is no consensus about which interventions are effective to prevent SRDs in healthcare workers. It is therefore important to publish an updated version of this review, also because healthcare workers have been affected more by SRDs than before the COVID‐19 pandemic (Blake 2020).
Because the characteristics of interventions designed for healthcare workers may be different from those of other occupations, the aim of this review is to determine the effectiveness of interventions to reduce SRDs specifically in healthcare workers. Given the large amount of included studies in the review evaluating all stress interventions in healthcare workers (Ruotsalainen 2015), the update was divided into this review on individual‐level interventions and another one by Giga 2018 which focus' solely on organisational interventions. These two reviews together supersede the review that was first published in 2006 (Marine 2006) and updated in 2015 (Ruotsalainen 2015). Since this review focus' on individual‐level interventions, studies that solely focused on organisational factors (i.e. quantitative demands, emotional tasks, variation of work, influence at work) are excluded.
Objectives
To evaluate the effectiveness of stress‐reduction interventions targeting individual healthcare workers compared to no intervention, wait list, placebo, no stress‐reduction intervention or another type of stress‐reduction intervention in reducing stress symptoms.
Methods
Criteria for considering studies for this review
Types of studies
Consistent with the previous versions of this review, we limited inclusion to randomised controlled trials (RCTs) to evaluate intervention effectiveness. We only included completed studies published in peer‐reviewed scientific journals; abstracts without accompanying full texts and dissertations were excluded.
Types of participants
We included studies in which the interventions were directed at healthcare workers who had not actively sought help for conditions such as burnout, depression, or anxiety disorder. This included all healthcare workers and trainees in any healthcare setting engaged in clinical work. We excluded studies in which any portion of participants were not doing clinical work, e.g. administrators, receptionists or when the outcomes were not reported separately for the participants who were doing clinical work. Personal caregivers who were family members or friends were excluded from this review.
Types of interventions
We included RCTs that evaluated the effectiveness of any type of intervention for individual healthcare workers aimed at preventing or reducing symptoms of stress. We excluded interventions targeting healthcare organisations because they are covered by the Giga 2018 review. Generally, four approaches to managing work‐related stress at the individual level can be distinguished:
1. focus one’s attention on the (modification of the) experience of stress (thoughts, feelings, behaviour);
2. focus one’s attention away from the experience of stress by various means of psychological disengagement;
3. alter work‐related risk factors on an individual level; and
4. combine two or more of the above.
Interventions such as mindfulness‐based stress reduction which focus on increasing awareness, regulation, cognitive flexibility and goals‐based behaviour directly related to stress were classified as type 1, whereas mindfulness ‐based meditation (Hofmann 2017; Tang 2015) that aim to shift attention away from the experience of stress and unpleasant thoughts was in type 2.
We included all trials that compared the effectiveness of an active intervention with no intervention (including usual care), wait list, a placebo intervention, no stress‐reduction intervention or to another type of stress‐reduction intervention.
The distinction between no intervention, wait list, placebo intervention, and no stress‐reduction intervention is not always apparent. We considered the comparison with a placebo intervention when participants were blinded to group assignment and both groups were told that they received a stress reduction intervention and the placebo intervention has no ‘active ingredient’. For instance when transcranial magnetic stimulation is compared to sham transcranial magnetic stimulation (Kim 2016). Trials with placebo arms were combined with those with no‐intervention controls, wait list controls and no stress‐reduction intervention controls in the meta‐analysis.
We considered the comparison with another type of stress‐reduction intervention when both groups received some kind of stress reduction intervention that was not part of regular care. In this comparison participants may or may not be blinded to group assignment. The comparison could include only different types of interventions, for instance, type 1 versus type 2 (psycho‐educational stress management (SMC) vs mindfulness‐based stress reduction (MSBR) (Errazuriz 2022).
Types of outcome measures
We included studies that evaluated the effectiveness of interventions using validated and standardised self‐report questionnaires measuring symptoms of work‐related stress or burnout. We deemed all other outcomes that do not measure stress or its effects on individuals beyond the scope of this review. Examples of excluded outcomes are: risk factors for stress (such as workload, conflicts, support), coping skills, knowledge or attitude change, work performance, patient satisfaction and claims from clients, employee absenteeism and turnover.
We considered the following follow‐up times for outcome measurement:
-
short term defined as up to and including three months after the intervention has been completed;
-
medium term defined as more than three months up to 12 months; and
-
long term defined as 12 months or longer.
Primary outcomes
Validated and standardised self‐report questionnaires measuring symptoms of work‐related stress or burnout examples of these measures include the following.
-
Perceived Stress Scale (PSS) (Cohen 1983).
-
Maslach Burnout Inventory (MBI) (comprised of three subscales: emotional exhaustion, depersonalisation, personal accomplishment) (Maslach 1982).
-
Depression Anxiety Stress Scale (DASS) (Lovibond 1995).
-
General Health Questionnaire (GHQ) (Goldberg 1991).
-
Oldenburg Burnout Inventory (OBI) (Demerouti 2003).
-
Visual Analogue Scale ‐ stress symptoms.
-
Copenhagen Burnout Inventory (CBI) (Kristensen 2005).
Secondary outcomes
For secondary outcomes we considered all outcome measures of the detrimental effects of stress or burnout. These included measures such as:
(a) Psychological symptoms: anxiety and depression, such as the State‐Trait Anxiety Inventory (Spielberger 1970), Beck Depression Inventory (BDI) (Beck 1961) and Hospital Anxiety Depression Scale (HADS) (Zigmond 1983);
(b) Measures of the cost‐effectiveness of interventions, such as incremental cost‐effectiveness ratios (ICERs), incremental cost‐per‐QALY (quality‐adjusted life year) and cost‐benefit ratios. Studies that reported only one or more of the secondary outcomes without any primary outcomes were excluded.
Search methods for identification of studies
We used a replacement approach and used the previous review (Ruotsalainen 2015) as one source of studies. Hence, two sources were used:
-
Included studies in the previous version of this review (Ruotsalainen 2015), search date up to November 2013.
-
Electronic searches (2013 to February 2022)
Electronic searches
-
Cochrane Central Register of Controlled Trials (CENTRAL) (The Cochrane Library, 2013 to February 2022)
-
MEDLINE/PubMed (2013 to February 2022)
-
Embase (2013 to February 2022)
-
PsycINFO (2013 to February 2022)
-
CINAHL/EBSCO (2013 to February 2022)
-
Web of Science (2013 to February 2022)
Searching other resources
We examined the reference lists from included articles and reviews for any additional eligible studies.
Data collection and analysis
Selection of studies
We used Covidence (Covidence 2022) for screening. Six review authors (ST, LE, AL, AT, KN, HM) independently screened titles and abstracts followed by full‐texts against the inclusion criteria. If there was any disagreement, the two review authors involved discussed this until disagreement was resolved.
Data extraction and management
Three review authors conducted the extraction of data by using a made‐to‐measure data extraction form in Covidence (ST, LE, AL) (Covidence 2022). Data extraction of the outcomes was done independently by the three review authors or researchers and students from the medical faculty of the University of Amsterdam. One review author checked all data extraction and reached consensus in cases of conflict. All questions concerning data extraction processes were resolved by discussion with all review authors.
Assessment of risk of bias in included studies
We used the Cochrane risk of bias tool (Higgins 2011) to assess the risk of bias in included studies. The tool includes the following assessment items: adequate sequence generation, allocation concealment, blinding, incomplete outcome data addressed, selective outcome reporting, and other bias.
Measures of treatment effect
We plotted the results of each trial as means and standard deviations (SDs) for continuous outcomes. Because in many cases different instruments were used to measure stress, we transformed the means into standardised mean differences (SMDs).
In many cases multiple similar outcome measures were used, or an instrument had several subscales but no summary measure. In case of multiple similar outcomes, we chose the outcome which we deemed to best represent a measure of stress symptoms in healthcare workers, such as the PSS (Cohen 1983). When study authors used subscales such as with the MBI (Maslach 1996), we chose the subscale that in our view best represented stress, such as the emotional exhaustion scale of the MBI (Maslach 1996).
Unit of analysis issues
For studies that employed a cluster‐randomised design and that reported sufficient data to be included in the meta‐analysis and that did not make an allowance for the design effect, we calculated the design effect based on a fairly large assumed intra‐cluster correlation (ICC) of 0.10. Even though we did not find information for the ICC)for these types of studies we assumed that 0.10 would be a realistic estimate. We used studies from implementation research to support this assumption (Campbell 2001). We followed the methods stated in the Cochrane Handbook for Systematic Reviews of Interventions (Cochrane Handbook, Higgins 2022) for the calculations: design effect = 1+(M‐1)*ICC, where M is the average cluster size and ICC is the intra‐cluster correlation coefficient.
For studies with multiple study arms and one control condition, we combined groups to create a single pair‐wise comparison with the control condition.
For studies with multiple study arms and no control condition, we entered the first two study arms in the meta‐analysis.
Dealing with missing data
Where necessary, we sought missing data (means and standard deviations (SDs)) from authors. In total, 16 study authors either provided data that had not been published in their articles which enabled us to enter these studies into the meta‐analyses, provided clarification on their published article, or referred us to supplementary information (Barattucci 2019; Cohen‐Katz 2005; Dunne 2019; Dyrbye 2019; Errazuriz 2022; Gärtner 2013; Jensen 2006; Kline 2020; Moody 2013a; Oman 2006; Ozgundondu 2019; Pehlivan 2020; Sampson 2019; Sawyer 2021; West 2014; West 2021).
Where necessary and possible, we used WebPlotDigitizer (Rohatgi, 2022) to retrieve means and SDs from figures for the following studies: CezardaCosta 2019; Cheng 2015; Luthar 2017; Kline 2020 (control group only).
When SDs were not reported we calculated them from other reported values according to the methods stated in the Cochrane Handbook (Higgins 2022).
For West 1984 we took the means and SDs that resulted from the post‐hoc comparisons in the repeated measures analyses. For Norvell 1987, we took the post‐treatment values and calculated SDs based on the P value. We calculated a t‐value from this P value even though the authors used a Mann‐Whitney U test. For Shapiro 2005, we took the post‐treatment values and the F‐value reported by the authors. We calculated a t‐value and subsequent SDs by taking the square root of the F‐value as the t‐value. For Tsai 1993, we took the post‐treatment values from the figure reporting the results of the repeated measures' analysis. We took the reported P value belonging to the repeated measures' analysis as if it had resulted from a t‐test and calculated the SDs based on this t‐value. For Ewers 2002, we took the post‐treatment scores and the P values belonging to the independent t‐tests to calculate a t‐value and subsequently SDs.
For Dahlgren 2022 and Gunasingam 2015, we calculated SDs based on 95% confidence intervals (CIs). For CezardaCosta 2019, Mao 2021 and Riley 2017 we calculated SDs based on the standard error (SE.) For Seidel 2021, the N per group was not reported, we assumed that there were an equal number of participants in the two study groups, i.e. 41 and 42.
Lee 2021, Mealer 2014 and Ozgundondu 2019 reported their stress outcomes with a median and interquartile range (IQR). In accordance with the Cochrane Handbook (Higgins 2022) we requested mean and SDs. In the case we did not receive a response, we entered the median and IQR in the meta‐analysis, and we assumed that outcome data were normally distributed.
Participants are included in the groups to which they were originally randomised, but missing data for participants were not included in the denominator.
In the case missing SDs were either not provided by the study authors or could not be calculated, these missing data were not imputed.
Assessment of heterogeneity
We assessed heterogeneity in line with GRADE guidance (Schünemann 2013). We deemed an I² value of more than 50% to indicate considerable heterogeneity. When we identified heterogeneity, we tried to understand the reasons for the heterogeneity by exploring the options outlined in the Cochrane Handbook (Higgins 2022) and we investigated the presence of outlying studies. When the heterogeneity could not be explained, we downgraded the certainty of the evidence. In addition, we calculated the prediction intervals, to provide information about how much the true effect size varies across studies calculated with CMA Prediction Intervals.
Assessment of reporting biases
We avoided reporting bias by including studies and not articles. If multiple articles reported results from a single study, we consolidated all the data from all articles under one study ID only. We avoided language bias by including studies in any language. Because standardised mean differences (SMDs) are related to their standard error (SE) (Zwetsloot 2017), we did not use the SEs to generate a funnel plot instead we used the sample size as recommended by Zwetsloot 2017. The funnel plots were generated in STATA 17 (STATA 2022).
Data synthesis
We combined studies that we deemed sufficiently similar regarding participants, intervention, control, outcome and follow‐up time in one comparison.
We pooled the results statistically when the outcomes were similar concepts, such as perceived stress symptoms. Because many instruments were used, we used SMDs to combine the stress‐related outcomes using meta‐analysis. Not all instruments used one summary score, but presented the results of various subscales. In cases where there was no summary measure, we chose the subscale that best represented a measure of stress. For example, for this analysis, we used only the emotional exhaustion subscale of the Maslach Burnout Inventory (MBI). In this way, we considered the various stress symptoms scales to measure the same concept. We pooled the results using a random‐effects model.
To interpret the effect size, the mean (23.6) and SD (12.2) on the MBI of the control healthcare worker population in Fiol DeRoque 2021 was used. The MBI‐Emotional exhaustion scale has a total score of 54. A score below 18 points is regarded as a low score on emotional exhaustion and a score above 36 as a high score on emotional exhaustion (Maslach 1996).
Subgroup analysis and investigation of heterogeneity
We conducted the following subgroup analyses and incorporated them in all comparisons:
-
type of intervention (see Types of interventions for more details);
-
length of follow‐up (see Types of outcome measures for more details);
-
type of outcome (see Primary outcomes; Secondary outcomes for more details).
On top of those subgroups, we considered the subgroups mentioned in the original protocol, i.e. type of healthcare worker and duration and intensity of the intervention (Marine 2000). When considering those subgroups, we took into account that subgroup effects on top of the current subgroups in interventions and outcomes may prove spurious and may not explain all the variability in the extent of inconsistency, as most putative subgroup effects ultimately prove spurious (Schünemann 2013).
Type of healthcare worker
For the current update of the review that includes only individual‐level interventions, we considered a subgroup analysis by type of healthcare worker as redundant. The reason is that we think that the intervention types included in this review work the same way for various healthcare workers (e.g. physicians, nurses). The previous findings of this review and a recent publication on this topic (de Wijn 2022) supported this assumption. In the previous review update (Ruotsalainen 2015), it was concluded that a subgroup analyses based on type of healthcare worker did not explain heterogeneity (“Since working conditions differ considerable between various occupations in health care, we analysed if there were differences in the effects of CBT and relaxation between various occupations. We did so only for comparisons with sufficient studies: CBT versus no intervention and relaxation versus no intervention. We ignored the previous subgroups in the CBT and relaxation intervention categories and divided the studies according to the occupation of the participants into nurses, physicians, all staff and other healthcare professionals. There were no differences between these subgroups. Within the subgroups however, there was still considerable statistical heterogeneity. We therefore do not think that the occupation of the participants explains statistical heterogeneity between studies.") Therefore, we cancelled this subgroup analysis and reported this in the section "Differences between protocol and review".
Duration and intensity of the intervention
For this update, we discussed the proposed subgroup analyses based on the duration and intensity of the intervention as stated in the original protocol (Marine 2000). We discussed what a proper grouping would be and found that dividing the studies in short or longer and intense or less intense interventions would be an arbitrary approach as no definition was formulated a priori. Moreover, such a grouping would ideally be based on a mixture of the duration and intensity of the intervention (e.g. number of sessions, the length of the sessions, homework assignments) and the compliance with the intervention. However, we explored whether the arbitrary cut‐off for duration of the intervention of 12 weeks shows an effect in effect size. We added this in the "Differences between protocol and review".
Compliance
de Wijn 2022 found that stress management interventions for nurses in which the sample was exposed to the majority of the planned sessions reached greater effect sizes compared to interventions in which the compliance to the intervention/attendance to the planned sessions was lower. This finding should be interpreted with caution due to a lot of missing data (de Wijn 2022). However, we aimed to explore if the effect sizes based on studies in which participants attended 80% or more of the scheduled sessions would differ from the studies where participants attended less than 80% of the scheduled sessions. We added this in the "Differences between protocol and review".
Sensitivity analysis
To assess the effect of risk of bias on the pooled results, we performed a sensitivity analysis in which we excluded studies with a high risk of bias and assessed whether this changed the results appreciably. We defined a study having a high risk of bias overall when we judged it to have a high risk of bias in three or more domains.
Summary of findings and assessment of the certainty of the evidence
We used the GRADE approach to assess the certainty of the body of evidence for the intervention categories and comparisons most important for health decision‐making (Guyatt 2011). A priori, we decided that the comparisons of an intervention with no intervention are most important for decision‐making for the primary outcome of stress symptoms only for all three follow‐up times. Comparisons of one intervention versus another intervention were considered to be less informative. We downgraded the certainty of the evidence by one to three levels depending on the seriousness of the violations in each domain. We considered the risk of bias tables for each study in that intervention category to assess the risk of bias for an intervention category. We downgraded the certainty of the evidence if there were one or more limitations in the following domains: risk of bias, consistency, directness of the evidence, precision of the pooled estimate and the possibility of publication bias. All statements on the effects of interventions, such as in the summary of finding tables and the conclusion were worded in line with the recommendations on communicating findings when using the GRADE approach (Santesso 2020). Review authors ST and JB undertook GRADE, which was then also discussed with JR, RS, KN, LE and HM until consensus was reached.
Results
Description of studies
Results of the search
From the initial set of included articles for the earlier systematic review (Ruotsalainen 2015), we included 28 eligible articles. Furthermore, we included one previously excluded article (Gärtner 2013). The systematic searches updated in 2018 and February 2022 yielded altogether 4776 references, excluding duplicates. We assessed 254 full‐text articles for eligibility and excluded 160. This left 92 new articles. Put together, 120 articles describing 117 studies fulfilled our inclusion criteria (Figure 1).

In addition, we located eight ongoing studies (Baker 2015; Bateman 2020; Bratt 2022; Kuribayashi 2019; Ng 2019; Pérula‐de Torres 2019; Rees 2018; Weiner 2020) for which we could not find published outcome data.
In addition, six studies were published in a language other than English or Dutch, for which we were currently unable to find professional translation (Ahmadi 2019; Ghods 2017; Lu 2020; Rogala 2016; Taft 2021; Xiao Yan 2019). In three studies (Fei 2019; Klatt 2012; Valipour 2020) no full‐text was available, and two (Imamura 2019; Sasaki 2021) did not report on stress symptoms despite being specified in the trial protocol. Details for these studies are provided in "Characteristics of studies awaiting classification".
We sought additional information regarding study details and statistical data or both from 26 included studies, and we received a response from 11 study authors (Barattucci 2019; Dunne 2019; Dyrbye 2019; Errazuriz 2022; Kline 2020; Ozgundondu 2019; Pehlivan 2020; Sampson 2019; Sawyer 2021; West 2014; West 2021). From the set of included studies from Ruotsalainen 2015, the previous author team received additional information from five study authors (Cohen‐Katz 2005; Gärtner 2013; Jensen 2006; Moody 2013a; Oman 2006).
Nine included studies could not be included in the meta‐analysis for various reasons. For Chen 2015, Duchemin 2015, Ghawadra 2020, Martins 2011, Novoa 2014, Palumbo 2012, Schrijnemaekers 2003 and Tonarelli 2018 it was due to missing data. Our efforts to reach these study authors were unsuccessful. Leao 2017 used a dichotomous outcome measure that we could not enter into the meta‐analysis.
One final update search was run on the 26th of September 2022, yielding 555 records excluding duplicates. We assessed 29 full‐text articles for eligibility and excluded 12. Seventeen articles were added to the "Studies awaiting classification" and will be considered in the next update of this review. We furthermore assessed 44 trial registration records and excluded 42. Two were added to the "Ongoing studies" (Al‐Hammouri 2022; Jeffers 2017).
Included studies
This second review update included 117 included studies (11,119 participants), this included an additional 89 studies (8691 participants) since the last update (Ruotsalainen 2015).
Study designs
Of the 117 included studies, 109 were individually randomised controlled trials (RCTs), and eight were cluster‐RCTs.
Seven of the cluster‐RCTs that we included in the meta‐analysis had a unit of analysis error. In other words, these studies ignored the clustering of the data in their analysis. To address this we used a formula (see "Unit of analysis issues") to calculate the design effect based on average cluster size (M) and an intra‐cluster correlation coefficient. We calculated the design effect as 2.4 for the Barbosa 2015 study (four clusters, M = 14.5), 1.5 for Gärtner 2013 (57 clusters, M = 5.4); 2.01 for the Jensen 2006 study (19 clusters, M = 11.05), 2.0 for Kesselheim 2020 (nine clusters, M = 11.1), 3.15 for Sampson 2019 (four clusters, M = 22.5); 3.7 for Verdes Montenegro Atalaya 2021 (six clusters, M = 27.5) and 3.5 for Sharif 2013 (two clusters, M = 26). We used the design effect to reduce the number of participants in both intervention and control groups if we were able to use quantitative outcome data in meta‐analyses.
Country and time period
Forty‐one studies had been carried out in North America, 35 in Europe, 19 in Asia, nine in the Middle East, nine in South America, three in Oceania and one on two continents.
Type of settings and participants
Altogether 94 of the included studies had been conducted in hospitals, four in residential care homes for the elderly or persons with disabilities, 14 in mixed or other healthcare settings, and five in a Medical Emergency service. Sixty studies included exclusively nurses, 23 included physicians, and 34 various or other healthcare staff. Almost all studies (N = 105) did not formulate inclusion or exclusion criteria based on stress symptom levels, while 12 studies (Behnammoghadam 2019; Chen 2015; Ghawadra 2020; Günüsen 2010; Kurebayashi 2012; Kurebayashi 2014; Montibeler 2018; Novoa 2014; Peterson 2008; Prado 2018; Saganha 2012; Stanton 1988) included healthcare workers with a medium and/or high level of stress symptoms only.
Sample sizes
The total number of participants randomised was 11,119. The number of participants per study arm was (Simmons 2018) < 50 in 85 studies (Alexander 2015; Amutio 2015; Aranda Ausern 2016; Axisa 2019; Bagheri 2019; Barbosa 2015; Behnammoghadam 2019; Bernburg 2019; Bernburg 2020; Brennan 2006; CezardaCosta 2019; Cheng 2015; Chesak 2020; Cho 2021; Cohen‐Katz 2005; Concilio 2021; Copeland 2021; deSouza 2021; Dincer 2021; Duchemin 2015; Dunne 2019; Dyrbye 2019; Emani 2020; Errazuriz 2022; Ewers 2002; Gollwitzer 2018; Gunasingam 2015; Günüsen 2010; Hilcove 2021; Ho 2021; Huang 2020a; Janzarik 2022; Kavurmaci 2022; Kharatzadeh 2020; Kim 2016; Kline 2020; Kurebayashi 2012; Leao 2017; Lebares 2021; Lee 1994; Lee 2021; Lin 2015; Lin 2019; Luthar 2017; Mache 2015; Mache 2016; Mache 2017; Mache 2018; Mackenzie 2006; Martins 2011; McGonagle 2020; Mealer 2014; Medisauskaite 2019; Moench 2021; Montibeler 2018; Moody 2013a; Norvell 1987; Novoa 2014; OBrien 2019; Oman 2006; Ozbas 2016; Ozgundondu 2019; Palumbo 2012; Pehlivan 2020; Prado 2018; Redhead 2011; Reynolds 1993; Riley 2017; Saganha 2012; Sampson 2019; Sawyer 2021; Schroeder 2018; Seidel 2021; Shapiro 2005; Sharif 2013; Shin 2020; Sood 2011; Stanton 1988; Tonarelli 2018; Verdes Montenegro Atalaya 2021; West 1984; West 2014; Yazdani 2010; Yung 2004; Zarvijani 2021) and ≥ 50 in 32 studies (Barattucci 2019; Brazier 2022; Chen 2015; Dahlgren 2022; Dyrbye 2016; ElKhamali 2018; Fendel 2021; Finnema 2005; Fiol DeRoque 2021; Foji 2020; Frogeli 2020; Gärtner 2013; Ghawadra 2020; Grabbe 2020; Hersch 2016; Huang 2020; Jensen 2006; Kesselheim 2020; Kurebayashi 2014; Lee 2020; Mandal 2021; Mao 2021; McConachie 2014; Melchior 1996; Montaner 2021; PelitAksu 2020; Peterson 2008; Schrijnemaekers 2003; Tsai 1993; Wei 2017; West 2021; Xie 2020).
Interventions
Fifty‐two studies examined the effectiveness of focusing on the experience of stress (Amutio 2015; Axisa 2019; Bagheri 2019; Barattucci 2019; Behnammoghadam 2019; Cheng 2015; Chesak 2020; Dyrbye 2016; Dyrbye 2019; Errazuriz 2022; Fendel 2021; Fiol DeRoque 2021; Foji 2020; Frogeli 2020; Gärtner 2013; Ghawadra 2020; Gollwitzer 2018; Grabbe 2020; Gunasingam 2015; Günüsen 2010; Huang 2020; Huang 2020a; Jensen 2006; Kesselheim 2020; Kharatzadeh 2020; Lee 1994; Lee 2020; Lin 2019; Mache 2015; Mache 2016; Mache 2017; Mache 2018; Mackenzie 2006; Mao 2021; Martins 2011; McConachie 2014; McGonagle 2020; Medisauskaite 2019; Moody 2013a; Pehlivan 2020; Riley 2017; Sampson 2019; Sawyer 2021; Schroeder 2018; Sharif 2013; Tonarelli 2018; Verdes Montenegro Atalaya 2021; Wei 2017; West 1984; West 2021; Xie 2020; Zarvijani 2021). The content of the interventions varies for instance from cognitive‐behavioral therapy to emotional skills training.
Forty‐two studies examined the effectiveness of focusing away of the experience of stress (Alexander 2015; Aranda Ausern 2016; Brennan 2006; CezardaCosta 2019; Chen 2015; Cho 2021; Cohen‐Katz 2005; Copeland 2021; Dahlgren 2022; deSouza 2021; Dincer 2021; Duchemin 2015; Dunne 2019; Emani 2020; Errazuriz 2022; Hilcove 2021; Ho 2021; Kavurmaci 2022; Kim 2016; Kline 2020; Kurebayashi 2012; Kurebayashi 2014; Leao 2017; Lebares 2021; Lee 2021; Lin 2015; Mandal 2021; Montibeler 2018; Novoa 2014; Oman 2006; Ozgundondu 2019; Palumbo 2012; PelitAksu 2020; Prado 2018; Saganha 2012; Seidel 2021; Shapiro 2005; Shin 2020; Stanton 1988; Tsai 1993; Yazdani 2010; Yung 2004). The content of the interventions varies from yoga to meditation to music listening.
Seven studies examined ways to alter work‐related risk factors on an individual level (Concilio 2021; Ewers 2002; Finnema 2005; Melchior 1996; Peterson 2008; Redhead 2011; Schrijnemaekers 2003).
Seventeen studies examined a combination of interventions (Barbosa 2015; Bernburg 2019; Bernburg 2020; Brazier 2022; ElKhamali 2018; Hersch 2016; Janzarik 2022; Luthar 2017; Mealer 2014; Moench 2021; Montaner 2021; Norvell 1987; OBrien 2019; Ozbas 2016; Reynolds 1993; Sood 2011; West 2014).
Three studies compared only two different types of stress prevention interventions with one another (Barbosa 2015; Riley 2017; Xie 2020).
The duration of the intervention ranged from one session (e.g. Axisa 2019) to 12 weeks (e.g. Chesak 2020) with most interventions lasting a few sessions only.
Type of control group
Most included studies used a no‐intervention control group (N = 72). Another 27 studies used a waiting‐list control group. Eight studies used a no stress‐reduction control group (Brennan 2006; Concilio 2021; Grabbe 2020; Jensen 2006; Mao 2021; Tsai 1993; West 2014; Tonarelli 2018) and another seven studies used a placebo control group (Chen 2015; Fiol DeRoque 2021; Kim 2016; Lee 2021; Prado 2018; Shin 2020; Novoa 2014).
Multiple intervention arms
Fifteen studies compared two or more active stress interventions with a control condition (Cheng 2015; Copeland 2021; Errazuriz 2022; Gärtner 2013; Gollwitzer 2018; Günüsen 2010; Kline 2020; Kurebayashi 2012; Kurebayashi 2014; Leao 2017; Lebares 2021; Pehlivan 2020; Verdes Montenegro Atalaya 2021; West 1984; Yung 2004).
With Cheng 2015; Copeland 2021; Gärtner 2013; Gollwitzer 2018; Günüsen 2010; Kline 2020; Kurebayashi 2012; Kurebayashi 2014; Pehlivan 2020; Verdes Montenegro Atalaya 2021; Yung 2004, we combined intervention arms to create a single pair‐wise comparison.
With Lebares 2021 we entered both interventions in the same comparison with the two control groups. We entered the intervention reported in Errazuriz 2022 in different comparisons. West 1984 had five study arms but finally reported data only on one study arm versus a no‐intervention or no‐effect condition. We used this as an intervention versus no‐intervention comparison. We did not enter Leao 2017 in the comparison as the outcomes were dichotomous.
Multiple control arms
Four studies included two control arms (Jensen 2006; Novoa 2014; Lebares 2021; Prado 2018). With Jensen 2006 we compared the intervention arm with the no stress‐reduction intervention arm. With Prado 2018 we used the placebo control arm instead of the wait list control group. We did not include Novoa 2014 in the meta‐analysis due to missing values. With Lebares 2021 we compared both control arms to the two intervention arms.
Outcomes
Altogether 43 studies used the Maslach Burnout Inventory (MBI) while 29 studies used the Perceived Stress Scale (PSS). The remaining studies used stress symptom questionnaires such as Perceived Stress Questionnaire (PSQ), Depression Anxiety Stress Scale (DASS‐stress), or General Health Questionnaire (GHQ). Twenty‐one studies reported a depression or anxiety outcome measure such as the State‐Trait Anxiety Inventory (STAI), DASS or Center for Epidemiologic Studies Depression Scale (CES‐D).
Only one study (Gärtner 2013) reported the cost‐effectiveness of their intervention.
Follow‐up
(i) Short term
There were 105 studies with an outcome measurement between the end of the intervention up to and including three months after the intervention.
(ii) Medium term
In 34 studies there was a follow‐up measurement between three and 12 months after intervention.
(iii) Long term
Only four studies had a follow‐up measurement more than 12 months after the intervention.
Excluded studies
The main reasons for excluding studies from this review were as follows (see the "Characteristics of excluded studies" for more detail).
1. Wrong outcomes
2. Wrong study design
3. Wrong publication type
4. Wrong population (not only healthcare workers)
5. Wrong intervention
Risk of bias in included studies
In general, we judged most included studies to suffer from methodological issues, with at least two items that we judged to put them at a high risk of bias (Figure 2). We judged only four studies to have no domain with a high risk of bias or to NOT have more than two domains with an uncertain risk of bias (Barbosa 2015; Cheng 2015; deSouza 2021; Fiol DeRoque 2021).

Risk of bias summary: review authors' judgements about each risk of bias item for each included study.
Blinding was consistently problematic in almost all studies because study authors used self‐report to assess stress symptoms as the participants and the providers could not be blinded to the intervention. However, in 14 studies participants were (tried to be) blinded to group assignment (Barbosa 2015; Chen 2015; Cheng 2015; Concilio 2021; deSouza 2021; Fiol DeRoque 2021; Kim 2016; Lebares 2021; Lee 2021; Luthar 2017; Medisauskaite 2019; Novoa 2014; Prado 2018; Shin 2020).
Allocation
Half of the included studies did not clearly describe the method for generating random numbers or did not employ a truly random sequence. It is surprising to note that some of these studies provided only sparse details on the randomisation process. Details of allocation concealment were frequently lacking. In most of the included studies, we assumed that randomisation was applied blind to all eligible participants at the same time. If this assumption is correct then researchers and participants could not foresee assignment. We therefore rated this as unclear risk of bias.
Blinding
We considered the reporting of stress symptoms by questionnaires as an outcome assessment that could be biased by knowledge of the intervention. We judged that it could be possible that a participant in the intervention group, knowing that they have gone through a six‐week course of stress management, would rate their stress symptoms more favourably than a person in the control group. This would create an overestimation of the effect of the intervention. Most authors mentioned that blinding could be an issue, but also discussed that blinding was not possible in these circumstances. We rated these studies as having a high risk of bias. However, in 16 studies, participants were (tried to be) blinded to group assignment. These mainly came from the second category of interventions (focussing away from stress) such as aromatherapy, auriculotherapy or acupressure or studies in which two or more active interventions were compared with one another.
Incomplete outcome data
Twenty‐five percent of the included studies had attrition rates exceeding 20% of the initial sample. When explanations for loss‐to‐follow‐up were missing, when reasons were not entirely random, or when the responders differed from non‐responders on baseline characteristics, we judged these studies to be at high risk of attrition bias. In some studies, it was unclear whether participants dropped out and the studies were therefore labelled as being at unclear risk of bias.
Selective reporting
It is surprising to note that most studies lack a study protocol or trial registration. When studies lacked a protocol, it was difficult to judge if outcomes were reported as planned. If the authors mentioned a protocol, we reviewed the protocol for a priori outcomes. If there was no mention of a protocol we looked online to see whether there was a protocol published. If not, we judged reporting in the study based on the methods and results sections.”. In most studies there was no indication of selective outcome reporting. In one study (Jensen 2006) only significant differences were reported, which we took to be a sign of high risk of bias. In Finnema 2005 the results for nursing assistants consisted of covariance analyses that were not prespecified and because of this, we judged the study to be at high risk of bias. In four studies (Bagheri 2019; Dahlgren 2022; ElKhamali 2018; Errazuriz 2022) the trial protocol mentioned a stress symptom questionnaire that was not reported in the included studies, which we took to be a sign of high risk of bias. In Dincer 2021 participants randomised to the intervention group that did not attend the: Emotional Freedom Techniques (EFT) session (n = 5) were excluded, which we took to be a sign of high risk of bias. In Kurebayashi 2012 the authors present data separately for participants who had high SSL scores to begin with but not at all for participants with a moderate SSL score, which was also categorised as high risk of bias.
Other potential sources of bias
There were several risks of bias that came up in addition to the risks mentioned above, such as low or unclear compliance with the intervention or low or unclear response rate. If other biases were not apparent, we judged the other potential source of bias as low in the risk of bias tool.
Effects of interventions
See: Summary of findings 1 An intervention in which one's attention is on the experience of stress (feelings, thoughts, behavior) compared to no intervention/wait list/placebo/no stress‐reduction intervention for stress reduction in healthcare workers; Summary of findings 2 An intervention in which one's attention is away from the experience of stress compared to no intervention/wait list/placebo/no stress‐reduction intervention for stress reduction in healthcare workers; Summary of findings 3 An intervention in which the focus is on work‐related risk factors on an individual level compared to no intervention/no stress‐reduction interventionfor stress reduction in healthcare workers; Summary of findings 4 A combination of individual‐level interventions compared to no intervention/wait list/no stress‐reduction intervention for stress reduction in healthcare workers
See: summary of findings Table 1; summary of findings Table 2; summary of findings Table 3; and summary of findings Table 4 and GRADE assessment of the primary outcomes at the end of this section for full description of how we rated the certainty of the evidence.
1. Focus one's attention on the experience of stress vs. no intervention/wait list/placebo/no stress‐reduction intervention
1.1. Any symptoms of stress‐related outcome (Follow‐up to 3 months after the end of the intervention)
We combined the results of 41 studies. There was a standardised mean difference (SMD; of ‐0.37, 95% confidence interval (CI) ‐0.52 to ‐0.23) showing difference in stress symptoms between the interventions that focus one's attention on the experience of stress and no intervention/wait list/placebo/no stress‐reduction intervention up to and including three months after the end of the intervention (3645 participants; low‐certainty evidence; Analysis 1.1). We found considerable heterogeneity (I2 = 77%) and a 95% prediction interval from ‐1.19 to 0.45. When excluding three outlying SMDs, I2 reduced to 57%. The funnel plot revealed a lack of studies in the right part of the funnel where the negative studies would be expected, indicating that there could be publication bias (Figure 3).

Funnel plot (1.1 Any symptoms of stress‐related outcome (follow‐up up to 3 months after the end of the intervention)
1.2 Any symptoms of stress‐related outcome (Follow‐up from > 3 to 12 months after the end of the intervention)
Results from 19 studies suggested that an intervention focusing on the experience of stress decreased stress symptoms more than no intervention/wait list/no stress‐reduction intervention (SMD ‐0.43, 95% CI ‐0.71 to ‐0.14; 1851 participants; low‐certainty evidence; Analysis 1.2) at > 3 to 12 months follow‐up. We found considerable heterogeneity (I2 = 88%) and a 95% prediction interval from ‐1.70 to 0.84. When excluding two outlying SMDs, I2 reduced to 42%. The funnel plot revealed a lack of studies in the right part of the funnel where the negative studies would be expected, indicating that there could be publication bias (Figure 4).

Funnel plot (1.2 Any symptoms of stress‐related outcome (follow‐up > 3 to 12 months after the end of the intervention))
1.3 Any symptoms of stress‐related outcome (Follow‐up > 12 months after the end of the intervention)
One study combining two intervention arms showed no differences (mean difference (MD) 0.40, 95% CI ‐1.50 to 2.30) in stress symptoms of an intervention focusing on the experience of stress compared to no intervention at >12 months of follow‐up (68 participants; very low‐certainty evidence; Analysis 1.3). It was not possible to study heterogeneity or publication bias.
1.4 Psychological symptoms (Follow‐up to and including 3 months after the end of the intervention)
Eight studies showed no differences in psychological symptoms after interventions focusing on the experience of stress more than after no intervention/wait list up to and including three months after the intervention (SMD ‐0.27, 95% CI‐0.58 to 0.03; 742 participants; Analysis 1.4).
1.5 Psychological symptoms (Follow‐up from > 3 to 12 months after the end of the intervention)
Three studies showed no differences in psychological symptoms in the interventions focusing on the experience of stress compared to no intervention participants on psychological symptoms > 3 to 12 months after the intervention (no pooled effect estimate; 196 participants; Analysis 1.5).
2. Focus one's attention away from the experience of stress vs. no intervention/wait list/placebo/no stress‐reduction intervention
2.1. Any symptoms of stress‐related outcome (Follow‐up to and including 3 months after the end of the intervention)
We combined the results of 35 studies. This resulted in a SMD of ‐0.55 (95% CI ‐0.70 to ‐0.40) showing that stress symptoms were reduced with interventions that focus one's attention away from the experience of stress when compared to no intervention/wait list/placebo/no stress‐reduction intervention and when measured up to and including three months after the end of the intervention (2366 participants; low certainty‐evidence; Analysis 2.1). We found considerable heterogeneity (I2 = 68%) and a 95% prediction interval from ‐1.33 to 0.23. When excluding one outlying SMD, I2 reduced to 33%. The funnel plot revealed a lack of studies in the right part of the funnel where the negative studies would be expected, indicating that there could be publication bias (Figure 5).

Funnel plot (2.1 Any symptoms of stress‐related outcome (follow‐up up to 3 months after the end of the intervention))
2.2 Any symptoms of stress‐related outcome (Follow‐up from >3 to 12 months after the end of the intervention)
Results from six studies indicated that an intervention focusing away from the experience of stress decreased stress symptoms more than no intervention/wait list (SMD ‐0.41, 95% CI ‐0.79 to ‐0.03; 427 participants; low‐certainty evidence; Analysis 2.2) at > 3 to 12 months follow‐up. We found considerable heterogeneity (I2 = 71%) and a 95% prediction interval from ‐1.71 to 0.89. When excluding one outlying SMD, I2 reduced to 0%. It was not possible to study publication bias with a funnel plot due to the low number of studies included in the analysis.
2.3 Any symptoms of stress‐related outcome (Follow‐up from > 12 months after the end of the intervention)
No data found for this outcome.
2.4 Psychological symptoms (Follow‐up to and including 3 months after the end of the intervention)
Seven studies found that an intervention focusing away from the experience of stress resulted in an SMD of ‐1.07 (95% CI ‐1.95 to ‐0.19) of psychological symptoms compared to no intervention/wait list/placebo up to and including three months after the end of the intervention (378 participants; Analysis 2.3). No data found for other follow‐up measurements of psychological symptoms.
3. Focus on work‐related risk factors on an individual level vs. no intervention/no stress‐reduction intervention
3.1. Any symptoms of stress‐related outcome (Follow‐up to and including 3 months after the end of the intervention)
One study showed that focusing on work‐related risk factors on an individual level decreased stress symptoms more than no intervention up to and including three months after the end of the intervention (SMD ‐1.23; 95% CI ‐2.21 to ‐0.26) while two others showed no difference in stress symptoms (no pooled effect estimate; 87 participants; very low‐certainty evidence; Analysis 3.1). We found considerable heterogeneity (I2 = 70%) and a 95% prediction interval from ‐10.12 to 9.68. It was not possible to study publication bias.
3.2 Any symptoms of stress‐related outcome (Follow‐up from > 3 to 12 months after the end of the intervention)
One study showed that focusing on work‐related risk factors on an individual level decreased stress symptoms more than no intervention >3 to 12 months after the end of the intervention (SMD ‐0.38, 95% CI ‐0.73 to ‐0.03) while one study showed no difference in stress symptoms (SMD 0.09, 95% CI ‐0.78 to 0.95) (no pooled effect estimate; 152 participants; very low‐certainty evidence; Analysis 3.2). With two studies, no funnel plot could be made.
3.3 Any symptoms of stress‐related outcome (Follow‐up > 12 months after the end of the intervention)
One study showed no difference (MD ‐1.52, 95% CI ‐3.61 to 0.57) in stress symptoms of focusing on work‐related risk factors on an individual level > 12 months after the end of the intervention (161 participants; very low‐certainty evidence; Analysis 3.3).
3.4 Psychological symptoms (Follow‐up from > 3 to 12 months after the end of the intervention)
One study showed no effect (MD ‐1.07, 95% CI ‐2.90 to 0.76) of focusing on work‐related risk factors on an individual level on psychological symptoms > 3 to 12 months after the end of the intervention (110 participants; Analysis 3.4).
4. Combination of intervention types vs. No intervention/wait list/no stress‐reduction intervention
4.1. Any symptoms of stress‐related outcome (Follow‐up to and including 3 months after the end of the intervention)
We combined the results of 15 studies and found a SMD of ‐0.67 (95% CI ‐0.95 to ‐0.39) showing less stress symptoms after the combined interventions and no intervention/wait list/no stress‐reduction intervention up to and including three months (1003 participants; low‐certainty evidence; Analysis 4.1). We found considerable heterogeneity (I2 = 77%) and a 95% prediction interval from ‐1.75 to 0.41. When excluding three outlying SMDs, I2 reduced to 46%. The funnel plot revealed a lack of studies in the right part of the funnel where the negative studies would be expected, indicating that there could be publication bias (Figure 6).

Funnel plot (4.1 Any symptoms of stress‐related outcome (follow‐up up to 3 months after the end of the intervention))
4.2 Any symptoms of stress‐related outcome (Follow‐up from > 3 to 12 months after the end of the intervention)
According to six studies, a combined intervention did not decrease stress symptoms more than no intervention/wait list/no stress‐reduction intervention at > 3 to 12 months follow‐up (SMD ‐0.48, 95% CI ‐0.95 to 0.00; 574 participants; low‐certainty evidence; Analysis 4.2). We found considerable heterogeneity (I2 = 87%) and a 95% prediction interval from ‐1.85 to 1.79. It was not possible to study heterogeneity or publication bias.
4.3 Any symptoms of stress‐related outcome (Follow‐up > 12 months after the end of the intervention)
One study showed no difference (MD ‐1.80, 95% CI ‐5.74 to 2.14) in stress symptoms of a combined intervention on an individual level > 12 months after the end of the intervention (88 participants; very low‐certainty evidence; Analysis 4.3). It was not possible to study heterogeneity or publication bias.
4.4 Psychological symptoms (Follow‐up to and including 3 months after the end of the intervention)
Four studies showed no differences in psychological symptoms of a combination of intervention types > 3 to 2 months after the end of the intervention (no pooled effect estimate, 192 participants; Analysis 4.4).
4.5 Psychological symptoms (Follow‐up from > 3 to 12 months after the end of the intervention)
One study (MD ‐2.20, 95% CI ‐5.88 to 1.48) showed no differences in psychological symptoms of a combined intervention > 3 to 12 months after the end of the intervention on psychological symptoms (91 participants; Analysis 4.5).
4.6 Psychological symptoms (Follow‐up from > 12 months after the end of the intervention)
One study showed no differences (MD ‐2.10, 95% CI ‐5.43 to 1.23) in psychological symptoms of a combined intervention > 12 months after the end of the intervention on psychological symptoms (88 participants; Analysis 4.6).
5. Focus one's attention on the experience of stress vs. focus one's attention away from the experience of stress
5.1. Any symptoms of stress‐related outcome (Follow‐up to and including 3 months after the end of the intervention)
Three studies showed no differences in stress symptoms of focusing one's attention on the experience of stress versus focusing one's attention away from the experience of stress up to an including three months after the end of the intervention (no pooled effect estimate, 193 participants; Analysis 5.1).
5.2 Any symptoms of stress‐related outcome (Follow‐up from > 3 to 12 months after the end of the intervention)
Two studies showed no differences in stress symptoms of focusing one's attention on the experience of stress versus focusing one's attention away from the experience of stress > 3 to 12 months after the end of the intervention (no pooled effect estimate, 74 participants; Analysis 5.2) at > 3 to 12 months follow‐up.
5.3 Any symptoms of stress‐related outcome (Follow‐up > 12 months after the end of the intervention)
One study showed no differences in stress symptoms of an intervention focusing on the experience of stress compared to focusing away from stress at > 12 months of follow‐up (38 participants; Analysis 5.3).
5.4 Psychological symptoms (Follow‐up to and including 3 months after the end of the intervention)
One study showed no differences in on psychological symptoms of an intervention focusing on the experience of stress compared to focusing away from stress (38 participants; Analysis 5.4).
5.5 Psychological symptoms (Follow‐up from > 3 to 12 months after the end of the intervention)
No data found for this outcome.
6. Combination of interventions vs. focus one's attention on the experience of stress
6.1. Any symptoms of stress‐related outcome (Follow‐up to and including 3 months after the end of the intervention)
One study showed no differences in stress symptoms of a combined intervention versus focus one's attention on the experience of stress up to and including three months after the end of the intervention (no effect estimate; 24 participants; Analysis 6.1).
6.2 Any symptoms of stress‐related outcome (Follow‐up from > 3 to 12 months after the end of the intervention)
One study showed no differences in stress symptoms of a combined intervention versus focus one's attention on the experience of stress > 3 to 12 months after the end of the intervention (no effect estimate; 24 participants; Analysis 6.2).
6.3 Psychological symptoms
No data found for this outcome.
GRADE assessment
1. Focus one's attention on the experience of stress vs. no intervention
The certainty of the evidence for Analysis 1.1 and Analysis 1.2 was downgraded by two levels for very serious risk of bias (bias arising from the randomisation process and lack of blinding; i.e. performance bias) in combination with some inconsistency and suspicion of publication bias. The certainty of the evidence for Analysis 1.3 was downgraded by three levels for very serious risk of bias (bias arising from the randomisation process and lack of blinding; i.e. performance bias) and very serious imprecision (small sample size, the confidence interval includes both a benefit and a harm).
2. Focus one's attention away from the experience of stress vs. no intervention
The certainty of the evidence for Analysis 2.1 and Analysis 2.2 was downgraded by two levels for very serious risk of bias (bias arising from the randomisation process and lack of blinding; i.e. performance bias) in combination with some inconsistency and suspicion of publication bias.
3. Focus on work‐related risk factors on an individual level vs. no intervention
The certainty of the evidence for Analysis 3.1 was downgraded by three levels for very serious risk of bias (bias arising from the randomisation process and lack of blinding; i.e. performance bias), inconsistency and very serious imprecision (small sample size, the confidence interval includes both a benefit and a harm). The certainty of the evidence for Analysis 3.2 and Analysis 3.3 was downgraded by three levels for very serious risk of bias (bias arising from the randomisation process and lack of blinding; i.e. performance bias) and very serious imprecision (small sample size, the confidence interval includes both a benefit and no effect).
4. Combination of intervention types vs. no intervention
The certainty of the evidence for Analysis 4.1 was downgraded by two levels for very serious risk of bias (bias arising from the randomisation process and lack of blinding; i.e. performance bias) in combination with some inconsistency and suspicion of publication bias. The certainty of the evidence for Analysis 4.2 was downgraded by two levels for very serious risk of bias (lack of blinding; i.e. performance bias) and inconsistency. We did not downgrade for imprecision, as the wide confidence interval is due to the inconsistency between study results. The certainty of the evidence for Analysis 4.3 was downgraded by three levels for very serious risk of bias (bias arising from the randomisation process and lack of blinding; i.e. performance bias) and very serious imprecision (small sample size, the confidence interval includes both a benefit and a harm).
Subgroup analysis
We considered duration of the intervention as a characteristic to analyse studies with short duration separately from studies with longer duration. Analysis 1.6 and Analysis 2.4 show an exploratory subgroup analysis based on duration. No differences were seen between these subgroups. Within the subgroups there was still considerable heterogeneity. We have no reason to assume that the duration of the intervention explains heterogeneity between studies, but we're very uncertain about the effect of duration of the intervention on stress symptoms.
We considered compliance as a characteristic to analyse studies with poor compliance separately from studies with better compliance. However, we found that compliance was not reported in about 50% of the studies. We decided that subgroup analysis in which half of the studies could not be included would not be of added value and no conclusions can be drawn from such analyses.
Sensitivity analysis
Most studies did not blind participants and therefore the overall certainty in the effect estimates is reduced. In order to provide an indication of the robustness of the overall conclusions we conducted the sensitivity analyses according to protocol for each comparison.
1. Focus one's attention on the experience of stress vs. no intervention
Removing low‐quality studies from the comparison of focusing one's attention on the experience of stress vs. no intervention on the short term left 31 studies. The SMD changed slightly from ‐0.37 (95% CI ‐0.52 to ‐0.23) to ‐0.49 (95% CI ‐0.67 to ‐0.31). For the same comparison for the medium term, removing low‐quality studies left eight studies. The SMD changed slightly from ‐0.43 (95% CI ‐0.71 to ‐0.14) to ‐0.41 (95% CI ‐0.65 to ‐0.17). The overall results and the direction of the effect for this comparison seem not to be affected by methodological quality of the included studies, and we considered the results of the analyses robust. For the same comparison for the long term, removing low‐quality studies left zero studies, so no sensitivity analysis was possible.
2. Focus one's attention away from the experience of stress vs. no intervention
Removing low‐quality studies from the comparison of focusing one's attention away from the experience of stress vs. no intervention on the short term left 24 studies. The SMD changed slightly from ‐0.55 (%95 CI ‐0.70 to ‐0.40) to ‐0.45 (95% CI ‐0.58 to ‐0.33). The overall results and the direction of the effect for this comparison seem not to be affected by methodological quality of the included studies, and we considered the results of the analyses robust. For the same comparison for the medium term, removing low‐quality studies left five studies, so no sensitivity analysis was possible.
3. Focus on work‐related risk factors on an individual level vs. no intervention
Removing low‐quality studies from the comparison of focusing one's attention on individual work‐related risk factors vs. no intervention on the short term left two studies, so no sensitivity analysis was possible. For the same comparison for the medium term, removing low‐quality studies left one study, so no sensitivity analysis was possible. For the same comparison for the long term, removing low‐quality studies left zero studies, so no sensitivity analysis was possible.
4. Combination of intervention types vs. no intervention
Removing low‐quality studies from the comparison of a combination of intervention types vs. no intervention in the short term left 13 studies in the comparison. The SMD changed slightly from ‐0.67 (95% CI ‐0.95 to ‐0.39) to ‐0.74 (95% CI ‐1.06 to ‐0.42). The overall results and the direction of the effect for this comparison seem not to be affected by methodological quality of the included studies, and we considered the results of the analyses robust. For the same comparison in the medium term, four studies were included and in the long term no studies were included precluding any analysis.
Discussion
Summary of main results
The primary objective of this review was to examine the effect of individual‐level stress management interventions on stress symptoms in healthcare workers. This review update includes an additional 89 studies, bringing the total number of studies to 117. Overall, the findings from the synthesis of randomised controlled trials (RCTs) indicate that there may be an effect on stress reduction in healthcare workers from individual‐level stress interventions, whether they focus one's attention on or away from the experience of stress. This effect may last up to a year after the end of the interventions. The evidence on the long‐term effect (more than a year after the end of the intervention) on stress symptoms for these two types of interventions is unclear.
In the short term, less than three months after the end of the intervention, a combination of individual‐level interventions may result in a reduction in stress symptoms. The evidence of effects thereafter or in the long term is inconclusive.
Only seven studies investigated interventions in which the focus is on work‐related risk factors, such as work demands. Due to this lack of evidence, we do not know if this type of intervention is effective.
Overall completeness and applicability of evidence
This systematic review includes the most recent evidence from studies published between 2013 and February 2022, which ensures that our findings are suitable for and applicable to current healthcare settings.
The majority of the included studies were conducted in hospitals (94), the remaining 23 were conducted in other healthcare contexts (14 in mixed or other healthcare settings, five in medical emergency, four in residential care homes for the elderly or disabled). We believe that the results are generalisable to most healthcare situations, but they are most applicable to the hospital setting. Half of the studies (60) included nurses only, 23 physicians and 34 various or other healthcare staff. This is a more diverse population, compared to earlier Cochrane Reviews on the same topic (Ruotsalainen 2015), enhancing the applicability of our findings.
About 64% of the studies were conducted in the Western industrialised world (North America and Europe) and 16% in Asia. The remaining 20% of the studies were spread over the Middle East, South America and Oceania and one study on two continents. Studies conducted in Africa are missing, just as in the former review (Ruotsalainen 2015). The findings are therefore not applicable to the large continent of Africa.
The outcome measurements were diverse, focusing on outcomes such as burnout (such as the Maslach Burnout Inventory (MBI)) or on the experience of stress symptoms (List of Stress symptoms). The lack of clarity on the definition of occupational stress is reflected in this wide range of outcome measurements.
With regard to the interventions, we note that a minority of the included studies focused on the root cause of occupational stress: altering work‐related risk factors. One might expect this type of intervention to yield the most long‐term, sustainable changes, so it is a shortcoming that not more studies took this approach. Almost half (44%) of the studies focused on the experience of stress in itself and 36% on focusing away from stress. A smaller percentage (15%) of the interventions focused on a combination of the above approaches. Furthermore, studies do not really seem to distinguish whether their intervention program is aimed at the prevention of occupational stress or aimed at the treatment of (early) stress symptoms which might also contribute to a lack of clarity on the definition of (occupational) stress.
Quality of the evidence
We assessed the methodological quality of the included RCTs using the Cochrane risk of bias tool (Higgins 2011). We assessed most included studies as having a high risk of bias arising from the randomisation process and lack of blinding; i.e. performance bias and to a lesser extent due to losses to follow‐up. The lack of blinding is problematic as the findings may be explained, at least in part, by a placebo effect. We tried to decrease the heterogeneity of the evidence generated by assessing intervention effects in four categories and with distinct follow‐up times (i.e. up to three months, three to 12 months, and more than one year after the intervention) and on distinct outcomes. We found some inconsistency. Inconsistency could also arise from the categorisation of interventions. The remaining variation within these categories could be due to dissimilar mechanisms of change.
We downgraded the certainty of evidence by two levels for interventions focusing attention on the experience of stress until one‐year follow‐up by two levels for very serious risk of bias (bias arising from the randomisation process and lack of blinding; i.e. performance bias) in combination with some inconsistency and suspicion of publication bias. We downgraded the certainty of evidence by two levels for interventions focusing attention on the experience of stress with three levels for longer follow‐up periods due to very serious risk of bias and very serious imprecision (intervention could be harmful or beneficial).
For interventions focusing attention away from the experience of stress until one‐year follow‐up, we downgraded the certainty of the evidence by two levels due to very serious risk of bias in combination with some inconsistency and suspicion of publication bias.
For interventions focusing on work‐related risk factors on an individual level, we downgraded three levels due to very serious risk of bias, imprecision and inconsistency.
For combined interventions, we downgraded the certainty of the evidence by two levels for the outcome until one‐year follow‐up and by three levels for longer follow‐up periods due to very serious risk of bias, inconsistency, imprecision, or suspicion of publication bias.
Potential biases in the review process
Potential biases could be caused by missing studies with our search strategy and because study authors did not always present the necessary information, sometimes even after we contacted them. However, we assess the effect of these possible biases to be very low because our search strategy was very extensive and the high number of studies we were able to include in the comparisons. Also, we checked relevant references of the included studies. By explicitly operationalising the types of individual targeted interventions that were eligible in each type of intervention and by focusing on stress symptoms only, we reduced bias due to differences in interpretation between the author team. We further substantiated this by adding explicitly that the operationalisation of the types of individual targeted interventions and focus on the effect of stress symptoms only.
We reduced bias due to differences in interpretation between the author team. Bias might have been introduced when multiple stress symptom questionnaires were measured other than the Perceived Stress Scale or the Maslach Burnout Inventory (MBI), and we had to decide which was "the best" to include in the meta‐analysis. Since, not all questionnaires have been validated very well this decision might sometimes be arbitrary and not based on high‐quality evidence (Shoman 2021). However, since all questionnaires have the same underlying construct i.e. measuring stress symptoms, we feel that the effect on the overall conclusion is small. Nonetheless, when more evidence on the psychometric properties of stress symptom questionnaires is available, these decisions might be reconsidered. We have made these decisions transparent by providing all stress symptom questionnaire that have been measured by the authors in the characteristic of included studies and providing with a footnote which stress symptom questionnaires was included in the meta‐analysis.
Potential bias might be introduced by the categorisation of interventions into focusing on stress, focusing away from stress, work‐related, and combination as variation remains within each category. In the previous version of this review, the main categorisation was in person‐ and work‐directed interventions. In this update, we further specified the person‐directed interventions based on the ideas of Bamber 2006. By doing this, we tackled the difficulties encountered with the previous categorisation (Ruotsalainen 2015). Future studies should focus on unravelling underlying stress mechanisms.
Agreements and disagreements with other studies or reviews
Our review aimed to assess the effect of all individual‐level stress interventions for all types of healthcare workers. This approach provided us with the opportunity to group interventions according to a general working mechanism (i.e. interventions that draw one's attention on the experience of stress and interventions in which one's attention is drawn away from the experience of stress or interventions that focus on work‐related risk factors) rather than according to one specific intervention type. As such, we categorised mindfulness‐based interventions into different comparisons, depending on whether yoga and relaxation was the main goal or whether mindfulness was embedded in a more cognitive‐behavioural approach, such as mindfulness‐based stress reduction.
Our review has a different conclusion than a systematic review focusing on hospital nurses (Jung 2021). That review looked at the effect of various mind‐body modalities on mental health and concluded that there was no difference in burnout symptoms between groups that received mindfulness as part of a stress‐reduction programme and those receiving no intervention. But one study comparing yoga to usual care did find a difference in burnout scores. Our review found that there may be an effect for interventions focusing one's attention away from the stress experience (such as yoga) as well as interventions focusing one's attention on the stress experience (mindfulness‐based stress reduction). Our review differs from the Jung 2021 review in that our objective was broader, including all healthcare workers and all stress‐related outcome measures. We reasoned that for individual‐level interventions, the intervention effect for different type of healthcare workers should be comparable. As a result, we were able to include more studies and calculate an effect estimate with more certainty.
The Spinelli 2019 review focused on mindfulness only but also took the approach of looking across healthcare occupations. As a result, they were able to include 38 RCTs. Overall, they found moderate effects on stress outcomes and a small effect on burnout specifically. They reported that the included mindfulness interventions all appeared to significantly affect overall outcomes. This is more in line with our findings, although we did look at non‐mindfulness individual‐level interventions as well. Another review (Zhang 2021) focusing on physical relaxation (such as yoga and massage therapy) in all healthcare workers included 15 RCTs. Their conclusion was that these methods reduce occupational stress compared to no intervention control groups. This is in line with our finding that focusing one's attention away from stress results in stress reduction. Their network analysis revealed yoga as the best method within these types of interventions.
Another Cochrane Review by Kunzler 2020 evaluated the evidence for resilience interventions in healthcare workers. As resilience building and stress reduction interventions often go hand in hand, their findings provide a valuable companion to our review. They concluded based on 17 RCTs that resilience training may lead to lower levels of stress, which was a secondary outcome in their review. Resilience training most often was based on mindfulness and cognitive‐behavioural therapy and was comparable to our category of interventions that draw one's attention to the experience of stress. However, their conclusion was based on very low‐certainty evidence, which is a problem of more reviews on healthcare workers on this topic, such as Clough 2017, while we graded the certainty of the evidence as low.
Our review focuses on healthcare workers, however it is relevant to compare our findings to other reviews examining different occupations. In the Richardson 2008 review of 55 interventions as tested in 36 experimental studies, a significant medium to large effect on occupational stress was found, and the effect was significantly and consistently larger for cognitive behavioural interventions. In contrast, in our review we found that there may be an effect for cognitive behavioural interventions as for relaxation techniques. This might be explained by the occupation of healthcare workers, we focused on, and the type of stressors these employees face. Healthcare workers often have to deal with inevitable situations like death of a patient or telling patients about their permanent loss of quality of life. In these stressful situations that cannot be influenced (any more), the active coping and practice of functional responses which is at the heart of cognitive behavioural approaches, might not be the most suitable way of coping. A more passive way of coping such as relaxation or mediation (refocus, away from the stress) might be a better fit to these types of stressors and this might explain why we did not find a bigger effect of the cognitive behavioural approaches compared to the relaxation techniques.


Risk of bias summary: review authors' judgements about each risk of bias item for each included study.
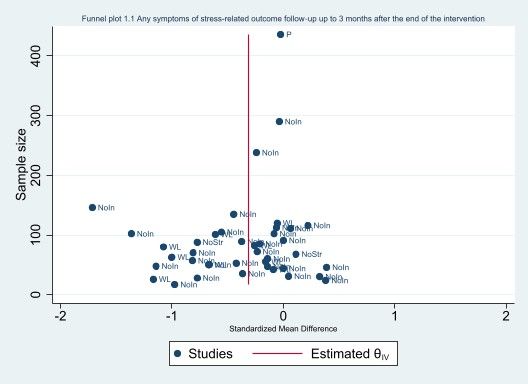
Funnel plot (1.1 Any symptoms of stress‐related outcome (follow‐up up to 3 months after the end of the intervention)

Funnel plot (1.2 Any symptoms of stress‐related outcome (follow‐up > 3 to 12 months after the end of the intervention))
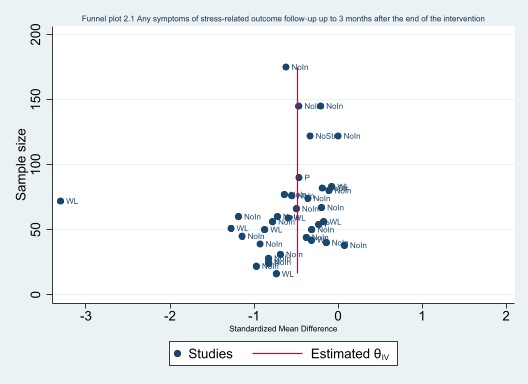
Funnel plot (2.1 Any symptoms of stress‐related outcome (follow‐up up to 3 months after the end of the intervention))

Funnel plot (4.1 Any symptoms of stress‐related outcome (follow‐up up to 3 months after the end of the intervention))

Comparison 1: ‘Focus one’s attention on the experience of stress (thoughts, feelings, behaviour)’ vs No intervention/wait list/placebo/no stress‐reduction intervention (SMD), Outcome 1: Any symptoms of stress‐related outcome (follow‐up up to 3 months after the end of the intervention)

Comparison 1: ‘Focus one’s attention on the experience of stress (thoughts, feelings, behaviour)’ vs No intervention/wait list/placebo/no stress‐reduction intervention (SMD), Outcome 2: Any symptoms of stress‐related outcome (follow‐up > 3 to 12 months after the end of the intervention)

Comparison 1: ‘Focus one’s attention on the experience of stress (thoughts, feelings, behaviour)’ vs No intervention/wait list/placebo/no stress‐reduction intervention (SMD), Outcome 3: Any symptoms of stress‐related outcome (follow‐up >12 months)

Comparison 1: ‘Focus one’s attention on the experience of stress (thoughts, feelings, behaviour)’ vs No intervention/wait list/placebo/no stress‐reduction intervention (SMD), Outcome 4: Psychological symptoms: anxiety and depression (follow‐up up to 3 months after the end of the intervention)

Comparison 1: ‘Focus one’s attention on the experience of stress (thoughts, feelings, behaviour)’ vs No intervention/wait list/placebo/no stress‐reduction intervention (SMD), Outcome 5: Psychological symptoms: anxiety and depression (follow‐up > 3 to 12 months after the end of the intervention)

Comparison 1: ‘Focus one’s attention on the experience of stress (thoughts, feelings, behaviour)’ vs No intervention/wait list/placebo/no stress‐reduction intervention (SMD), Outcome 6: Explanatory analysis ‐ subgroup (short vs long duration of intervention): any symptoms of stress‐related outcome (follow‐up up to 3 months after the end of the intervention)

Comparison 2: ‘Focus one’s attention away from the experience of stress by means of relaxation, exercise or something else’ vs No intervention/wait list/placebo/no stress‐reduction intervention (SMD), Outcome 1: Any symptoms of stress‐related outcome (follow‐up up to 3 months after the end of the intervention)

Comparison 2: ‘Focus one’s attention away from the experience of stress by means of relaxation, exercise or something else’ vs No intervention/wait list/placebo/no stress‐reduction intervention (SMD), Outcome 2: Any symptoms of stress‐related outcome (follow‐up > 3 to 12 months after the end of the intervention)

Comparison 2: ‘Focus one’s attention away from the experience of stress by means of relaxation, exercise or something else’ vs No intervention/wait list/placebo/no stress‐reduction intervention (SMD), Outcome 3: Psychological symptoms: anxiety and depression (follow‐up up to 3 months after the end of the intervention)

Comparison 2: ‘Focus one’s attention away from the experience of stress by means of relaxation, exercise or something else’ vs No intervention/wait list/placebo/no stress‐reduction intervention (SMD), Outcome 4: Explanatory analysis ‐ subgroup (short vs long duration of intervention): any symptoms of stress‐related outcome (follow‐up up to 3 months after the end of the intervention)

Comparison 3: ‘Focus on work‐related risk factors on an individual level such as work demands’ vs No intervention/no stress‐reduction intervention (SMD), Outcome 1: Any symptoms of stress‐related outcome (follow‐up up to 3 months after the end of the intervention)

Comparison 3: ‘Focus on work‐related risk factors on an individual level such as work demands’ vs No intervention/no stress‐reduction intervention (SMD), Outcome 2: Any symptoms of stress‐related outcome (follow‐up > 3 to 12 months after the end of the intervention)

Comparison 3: ‘Focus on work‐related risk factors on an individual level such as work demands’ vs No intervention/no stress‐reduction intervention (SMD), Outcome 3: Any symptoms of stress‐related outcome (follow‐up >12 months)

Comparison 3: ‘Focus on work‐related risk factors on an individual level such as work demands’ vs No intervention/no stress‐reduction intervention (SMD), Outcome 4: Psychological symptoms: anxiety and depression (follow‐up > 3 to 12 months after the end of the intervention)

Comparison 4: ‘Combination of interventions’ vs No intervention/wait list/no stress‐reduction intervention (SMD), Outcome 1: Any symptoms of stress‐related outcome (follow‐up up to 3 months after the end of the intervention)

Comparison 4: ‘Combination of interventions’ vs No intervention/wait list/no stress‐reduction intervention (SMD), Outcome 2: Any symptoms of stress‐related outcome (follow‐up > 3 to 12 months after the end of the intervention)

Comparison 4: ‘Combination of interventions’ vs No intervention/wait list/no stress‐reduction intervention (SMD), Outcome 3: Any symptoms of stress‐related outcome (follow‐up > 12 months)

Comparison 4: ‘Combination of interventions’ vs No intervention/wait list/no stress‐reduction intervention (SMD), Outcome 4: Psychological symptoms: anxiety and depression (follow‐up up to 3 months after the end of the intervention)

Comparison 4: ‘Combination of interventions’ vs No intervention/wait list/no stress‐reduction intervention (SMD), Outcome 5: Psychological symptoms: anxiety and depression (follow‐up > 3 to 12 months after the end of the intervention)

Comparison 4: ‘Combination of interventions’ vs No intervention/wait list/no stress‐reduction intervention (SMD), Outcome 6: Psychological symptoms: anxiety and depression (follow‐up > 12 months after the end of the intervention)

Comparison 5: Focus one’s attention on the experience of stress vs focus one’s attention away from the experience of stress, Outcome 1: Any symptoms of stress‐related outcome (follow‐up up to 3 months)

Comparison 5: Focus one’s attention on the experience of stress vs focus one’s attention away from the experience of stress, Outcome 2: Any symptoms of stress‐related outcome (follow‐up > 3 to 12 months after the end of the intervention)

Comparison 5: Focus one’s attention on the experience of stress vs focus one’s attention away from the experience of stress, Outcome 3: Psychological symptoms: anxiety and depression (follow‐up up to 3 months)

Comparison 5: Focus one’s attention on the experience of stress vs focus one’s attention away from the experience of stress, Outcome 4: Psychological symptoms: anxiety and depression (follow‐up > 3 to 12 months after the end of the intervention)

Comparison 6: ‘Combination of interventions’ vs focus one's attention on the experience of stress (SMD), Outcome 1: Any symptoms of stress‐related outcome (follow‐up up to 3 months)

Comparison 6: ‘Combination of interventions’ vs focus one's attention on the experience of stress (SMD), Outcome 2: Any symptoms of stress‐related outcome (follow‐up > 3 to 12 months after the end of the intervention)
| An intervention in which one's attention is on the experience of stress compared to no intervention/wait list/placebo/no stress‐reduction intervention for stress reduction in healthcare workers | ||||
| Patient or population: healthcare workers | ||||
| Outcomes | Anticipated absolute effects* (95% CI) | № of participants | Certainty of the evidence | What happens |
|---|---|---|---|---|
| Effect with an intervention in which one's attention is on the experience of stress | ||||
| Stress symptoms (follow‐up up to and including 3 months after end of intervention) | SMD 0.37 lower | 3645 | ⊕⊕⊝⊝ | On the short term, an intervention in which one's attention is on the experience of stress may result in a reduction in stress symptoms. The standardized mean difference translates back to 4.6 fewer (6.4 fewer to 2.8 fewer) points on the MBI‐emotional exhaustion scale2. |
| Stress symptoms (follow‐up > 3 to 12 months after end of intervention) | SMD 0.43 lower | 1851 | ⊕⊕⊝⊝ | On the medium term, focus one's attention on the experience of stress may result in a reduction in stress symptoms. The standardized mean difference translates back to 5.3 fewer (8.7 fewer to 1.7 fewer) points on the MBI‐emotional exhaustion scale3. |
| Stress symptoms (follow‐up >12 months after end of intervention) | no effect estimate | 68 | ⊕⊝⊝⊝ | The evidence is very uncertain about the long‐term effect on stress symptoms of focusing one's attention on the experience of stress. |
| *The risk in the intervention group (and its 95% confidence interval) is based on the assumed risk in the comparison group and the relative effect of the intervention (and its 95% CI). | ||||
| GRADE Working Group grades of evidence | ||||
| 1 The certainty of the evidence was downgraded by two levels for very serious risk of bias (bias arising from the randomisation process and lack of blinding; i.e. performance bias) in combination with some inconsistency and suspicion of publication bias. 2 The certainty of the evidence was downgraded by three levels for very serious risk of bias (bias arising from the randomisation process and lack of blinding; i.e. performance bias) and very serious imprecision (small sample size, the confidence interval includes both a benefit and a harm). 3 The MBI‐Emotional exhaustion scale has a total score of 54 and we used the mean score (23.6) and standard deviation (12.2) of the control healthcare workers population in Fiol DeRoque 2021 as reference for interpreting the effect sizes. A score below 18 points is regarded as a low score on emotional exhaustion and a score above 36 as a high score on emotional exhaustion (Maslach 1996). | ||||
| An intervention in which one's attention is away from the experience of stress compared to no intervention/wait list/placebo/no stress‐reduction intervention for stress reduction in healthcare workers | ||||
| Patient or population: healthcare workers | ||||
| Outcomes | Anticipated absolute effects* (95% CI) | № of participants | Certainty of the evidence | What happens |
|---|---|---|---|---|
| Risk with an intervention in which one's attention is away from the experience of stress | ||||
| Stress symptoms (follow‐up up to and including 3 months after end of intervention) | SMD 0.55 lower | 2366 | ⊕⊕⊝⊝ | On the short term, an intervention in which one's attention is away from the experience of stress may result in a reduction in stress symptoms. The standardized mean difference translates back to 6.8 fewer (8.6 fewer to 4.9 fewer) points on the MBI‐emotional exhaustion scale2. |
| Stress symptoms (follow‐up > 3 to 12 months after end of intervention) | SMD 0.41 lower | 427 | ⊕⊕⊝⊝ | On the medium term, an intervention in which one's attention is away from the experience of stress may result in a reduction in stress symptoms. The standardized mean difference translates back to 5.0 fewer (9.7 fewer to 0.4 fewer) points on the MBI‐emotional exhaustion scale2. |
| Stress symptoms (follow‐up >12 months after end of intervention) | ‐ | (0 RCTs) | ‐ | No studies reported the long‐term effect on stress symptoms of focusing one's attention away from the experience of stress. |
| *The risk in the intervention group (and its 95% confidence interval) is based on the assumed risk in the comparison group and the relative effect of the intervention (and its 95% CI). | ||||
| GRADE Working Group grades of evidence | ||||
| 1 The certainty of the evidence was downgraded by two levels for very serious risk of bias (bias arising from the randomisation process and lack of blinding; i.e. performance bias) in combination with some inconsistency and suspicion of publication bias. 3 The MBI‐emotional exhaustion scale has a total score of 54 and we used the mean score (23.6) and standard deviation (12.2) of the control healthcare workers population in Fiol DeRoque 2021 as reference for interpreting the effect sizes. A score below 18 points is regarded as a low score on emotional exhaustion and a score above 36 as a high score on emotional exhaustion (Maslach 1996). | ||||
| An intervention in which the focus is on work‐related risk factors on an individual level compared to no intervention/no stress‐reduction intervention for stress reduction in healthcare workers | ||||
| Patient or population: healthcare workers | ||||
| Outcomes | Anticipated absolute effects* (95% CI) | № of participants | Certainty of the evidence | What happens |
|---|---|---|---|---|
| Effect with an intervention in which the focus is on work‐related risk factors on an individual level | ||||
| Stress symptoms (follow‐up up to and including 3 months after end of intervention) | no effect estimate | 87 | ⊕⊝⊝⊝ | The evidence is very uncertain about the short‐term effect of an intervention in which the focus is on work‐related risk factors on stress symptoms. |
| Stress symptoms (follow‐up > 3 to 12 months after end of intervention) | no effect estimate | 152 | ⊕⊝⊝⊝ | The evidence is very uncertain about the medium‐term effect of an intervention in which the focus is on work‐related risk factors on stress symptoms. |
| Stress symptoms (follow‐up >12 months after end of intervention) | no effect estimate | 161 | ⊕⊝⊝⊝ | The evidence is very uncertain about the long‐term effect of an intervention in which the focus is on work‐related risk factors on stress symptoms. |
| *The risk in the intervention group (and its 95% confidence interval) is based on the assumed risk in the comparison group and the relative effect of the intervention (and its 95% CI). | ||||
| GRADE Working Group grades of evidence | ||||
| 1 The certainty of the evidence was downgraded by three levels for very serious risk of bias (bias arising from the randomisation process and lack of blinding; i.e. performance bias), inconsistency and very serious imprecision (small sample size, the confidence interval includes both a benefit and a harm). 2 The certainty of the evidence was downgraded by three levels for very serious risk of bias (bias arising from the randomisation process and lack of blinding; i.e. performance bias) and very serious imprecision (small sample size, the confidence interval includes both a benefit and no effect). | ||||
| A combination of individual‐level interventions compared to no intervention/wait list/no stress‐reduction intervention for stress reduction in healthcare workers | ||||
| Patient or population: healthcare workers | ||||
| Outcomes | Anticipated absolute effects* (95% CI) | № of participants | Certainty of the evidence | What happens |
|---|---|---|---|---|
| Effect with a combination of individual‐level interventions | ||||
| Stress symptoms (follow‐up up to and including 3 months after end of intervention) | SMD 0.67 lower | 1003 | ⊕⊕⊝⊝ | On the short term, a combination of individual‐level interventions may result in a reduction in stress symptoms. The standardized mean difference translates back to 8.2 fewer (11.7 fewer to 4.8 fewer) points on the MBI‐Emotional exhaustion scale4. |
| Stress symptoms (follow‐up > 3 to 12 months after end of intervention) | SMD 0.48 lower | 574 | ⊕⊕⊝⊝ | On the medium term, a combination of individual‐level interventions may result in a reduction in stress symptoms, but the evidence does not exclude no effect. The standardized mean difference translates back to 5.9 fewer points (11.7 fewer to no difference) on the MBI‐Emotional exhaustion scale4. |
| Stress symptoms (follow‐up >12 months after end of intervention) | no effect estimate | 88 | ⊕⊝⊝⊝ | The evidence is very uncertain about the long‐term effect of a combination of individual‐level interventions on stress symptoms. |
| CI: confidence interval; SMD: standardized mean difference | ||||
| GRADE Working Group grades of evidence | ||||
| 1 The certainty of the evidence was downgraded by two levels for very serious risk of bias (bias arising from the randomisation process and lack of blinding; i.e. performance bias) in combination with some inconsistency and suspicion of publication bias. 2 The certainty of the evidence was downgraded by two levels for very serious risk of bias (lack of blinding; i.e. performance bias) and inconsistency. We did not downgrade for imprecision, as the wide confidence interval is due to the inconsistency between study results. 3 The certainty of the evidence was downgraded by three levels for very serious risk of bias (bias arising from the randomisation process and lack of blinding; i.e. performance bias) and very serious imprecision (small sample size, the confidence interval includes both a benefit and a harm). 4 The MBI‐emotional exhaustion scale has a total score of 54 and we used the mean score (23.6) and standard deviation (12.2) of the control HCW population in Fiol DeRoque 2021 as reference for interpreting the effect sizes. A score below 18 points is regarded as a low score on emotional exhaustion and a score above 36 as a high score on emotional exhaustion (Maslach 1996). | ||||
| Outcome or subgroup title | No. of studies | No. of participants | Statistical method | Effect size |
| 1.1 Any symptoms of stress‐related outcome (follow‐up up to 3 months after the end of the intervention) Show forest plot | 41 | 3645 | Std. Mean Difference (IV, Random, 95% CI) | ‐0.37 [‐0.52, ‐0.23] |
| 1.1.1 No intervention | 29 | 2434 | Std. Mean Difference (IV, Random, 95% CI) | ‐0.35 [‐0.53, ‐0.16] |
| 1.1.2 Wait list | 9 | 619 | Std. Mean Difference (IV, Random, 95% CI) | ‐0.52 [‐0.80, ‐0.25] |
| 1.1.3 Placebo | 1 | 436 | Std. Mean Difference (IV, Random, 95% CI) | ‐0.02 [‐0.21, 0.16] |
| 1.1.4 No stress‐reduction intervention | 2 | 156 | Std. Mean Difference (IV, Random, 95% CI) | ‐0.33 [‐1.19, 0.53] |
| 1.2 Any symptoms of stress‐related outcome (follow‐up > 3 to 12 months after the end of the intervention) Show forest plot | 19 | 1851 | Std. Mean Difference (IV, Random, 95% CI) | ‐0.43 [‐0.71, ‐0.14] |
| 1.2.1 No intervention | 11 | 1271 | Std. Mean Difference (IV, Random, 95% CI) | ‐0.46 [‐0.90, ‐0.02] |
| 1.2.2 Wait list | 6 | 480 | Std. Mean Difference (IV, Random, 95% CI) | ‐0.53 [‐0.83, ‐0.24] |
| 1.2.3 No stress reduction intervention | 2 | 100 | Std. Mean Difference (IV, Random, 95% CI) | 0.16 [‐0.23, 0.56] |
| 1.3 Any symptoms of stress‐related outcome (follow‐up >12 months) Show forest plot | 1 | Mean Difference (IV, Random, 95% CI) | Totals not selected | |
| 1.4 Psychological symptoms: anxiety and depression (follow‐up up to 3 months after the end of the intervention) Show forest plot | 8 | 742 | Std. Mean Difference (IV, Random, 95% CI) | ‐0.27 [‐0.58, 0.03] |
| 1.4.1 No intervention | 7 | 482 | Std. Mean Difference (IV, Random, 95% CI) | ‐0.28 [‐0.68, 0.11] |
| 1.4.2 Wait list | 1 | 260 | Std. Mean Difference (IV, Random, 95% CI) | ‐0.28 [‐0.53, ‐0.04] |
| 1.5 Psychological symptoms: anxiety and depression (follow‐up > 3 to 12 months after the end of the intervention) Show forest plot | 3 | Std. Mean Difference (IV, Random, 95% CI) | Totals not selected | |
| 1.5.1 No intervention | 3 | Std. Mean Difference (IV, Random, 95% CI) | Totals not selected | |
| 1.6 Explanatory analysis ‐ subgroup (short vs long duration of intervention): any symptoms of stress‐related outcome (follow‐up up to 3 months after the end of the intervention) Show forest plot | 41 | 3645 | Std. Mean Difference (IV, Random, 95% CI) | ‐0.37 [‐0.52, ‐0.23] |
| 1.6.1 Short (< 12weeks) | 29 | 2647 | Std. Mean Difference (IV, Random, 95% CI) | ‐0.32 [‐0.49, ‐0.15] |
| 1.6.2 Long (≥ 12 weeks) | 12 | 998 | Std. Mean Difference (IV, Random, 95% CI) | ‐0.50 [‐0.78, ‐0.22] |
| Outcome or subgroup title | No. of studies | No. of participants | Statistical method | Effect size |
| 2.1 Any symptoms of stress‐related outcome (follow‐up up to 3 months after the end of the intervention) Show forest plot | 35 | 2366 | Std. Mean Difference (IV, Random, 95% CI) | ‐0.55 [‐0.70, ‐0.40] |
| 2.1.1 No intervention | 22 | 1565 | Std. Mean Difference (IV, Random, 95% CI) | ‐0.48 [‐0.61, ‐0.35] |
| 2.1.2 Wait list | 8 | 429 | Std. Mean Difference (IV, Random, 95% CI) | ‐0.88 [‐1.53, ‐0.24] |
| 2.1.3 Placebo | 3 | 168 | Std. Mean Difference (IV, Random, 95% CI) | ‐0.43 [‐0.74, ‐0.12] |
| 2.1.4 No stress‐reduction intervention | 2 | 204 | Std. Mean Difference (IV, Random, 95% CI) | ‐0.27 [‐0.55, 0.00] |
| 2.2 Any symptoms of stress‐related outcome (follow‐up > 3 to 12 months after the end of the intervention) Show forest plot | 6 | 427 | Std. Mean Difference (IV, Random, 95% CI) | ‐0.41 [‐0.79, ‐0.03] |
| 2.2.1 No intervention | 4 | 312 | Std. Mean Difference (IV, Random, 95% CI) | ‐0.43 [‐0.98, 0.12] |
| 2.2.2 Wait list | 2 | 115 | Std. Mean Difference (IV, Random, 95% CI) | ‐0.40 [‐0.77, ‐0.03] |
| 2.3 Psychological symptoms: anxiety and depression (follow‐up up to 3 months after the end of the intervention) Show forest plot | 7 | 378 | Std. Mean Difference (IV, Random, 95% CI) | ‐1.07 [‐1.95, ‐0.19] |
| 2.3.1 No intervention | 2 | 127 | Std. Mean Difference (IV, Random, 95% CI) | ‐0.67 [‐1.60, 0.25] |
| 2.3.2 Wait list | 3 | 173 | Std. Mean Difference (IV, Random, 95% CI) | ‐1.89 [‐4.24, 0.46] |
| 2.3.3 Placebo | 2 | 78 | Std. Mean Difference (IV, Random, 95% CI) | ‐0.34 [‐0.79, 0.11] |
| 2.4 Explanatory analysis ‐ subgroup (short vs long duration of intervention): any symptoms of stress‐related outcome (follow‐up up to 3 months after the end of the intervention) Show forest plot | 35 | 2366 | Std. Mean Difference (IV, Random, 95% CI) | ‐0.55 [‐0.70, ‐0.40] |
| 2.4.1 Short (<12 weeks) | 33 | 2255 | Std. Mean Difference (IV, Random, 95% CI) | ‐0.52 [‐0.68, ‐0.37] |
| 2.4.2 Long (≥ 12 weeks) | 2 | 111 | Std. Mean Difference (IV, Random, 95% CI) | ‐0.96 [‐1.48, ‐0.43] |
| Outcome or subgroup title | No. of studies | No. of participants | Statistical method | Effect size |
| 3.1 Any symptoms of stress‐related outcome (follow‐up up to 3 months after the end of the intervention) Show forest plot | 3 | Std. Mean Difference (IV, Random, 95% CI) | Totals not selected | |
| 3.1.1 No intervention | 2 | Std. Mean Difference (IV, Random, 95% CI) | Totals not selected | |
| 3.1.2 No stress‐reduction intervention | 1 | Std. Mean Difference (IV, Random, 95% CI) | Totals not selected | |
| 3.2 Any symptoms of stress‐related outcome (follow‐up > 3 to 12 months after the end of the intervention) Show forest plot | 2 | Std. Mean Difference (IV, Random, 95% CI) | Totals not selected | |
| 3.3 Any symptoms of stress‐related outcome (follow‐up >12 months) Show forest plot | 1 | Mean Difference (IV, Random, 95% CI) | Totals not selected | |
| 3.4 Psychological symptoms: anxiety and depression (follow‐up > 3 to 12 months after the end of the intervention) Show forest plot | 1 | Mean Difference (IV, Random, 95% CI) | Totals not selected | |
| Outcome or subgroup title | No. of studies | No. of participants | Statistical method | Effect size |
| 4.1 Any symptoms of stress‐related outcome (follow‐up up to 3 months after the end of the intervention) Show forest plot | 15 | 1003 | Std. Mean Difference (IV, Random, 95% CI) | ‐0.67 [‐0.95, ‐0.39] |
| 4.1.1 No intervention | 10 | 666 | Std. Mean Difference (IV, Random, 95% CI) | ‐0.71 [‐1.08, ‐0.34] |
| 4.1.2 Wait list | 4 | 270 | Std. Mean Difference (IV, Random, 95% CI) | ‐0.79 [‐1.21, ‐0.38] |
| 4.1.3 No stress‐reduction intervention | 1 | 67 | Std. Mean Difference (IV, Random, 95% CI) | 0.13 [‐0.35, 0.61] |
| 4.2 Any symptoms of stress‐related outcome (follow‐up > 3 to 12 months after the end of the intervention) Show forest plot | 6 | 574 | Std. Mean Difference (IV, Random, 95% CI) | ‐0.48 [‐0.95, ‐0.00] |
| 4.2.1 No intervention | 3 | 330 | Std. Mean Difference (IV, Random, 95% CI) | ‐0.70 [‐1.52, 0.12] |
| 4.2.2 Wait list | 2 | 177 | Std. Mean Difference (IV, Random, 95% CI) | ‐0.36 [‐0.65, ‐0.06] |
| 4.2.3 No stress‐reduction intervention | 1 | 67 | Std. Mean Difference (IV, Random, 95% CI) | 0.00 [‐0.48, 0.48] |
| 4.3 Any symptoms of stress‐related outcome (follow‐up > 12 months) Show forest plot | 1 | Mean Difference (IV, Random, 95% CI) | Totals not selected | |
| 4.4 Psychological symptoms: anxiety and depression (follow‐up up to 3 months after the end of the intervention) Show forest plot | 4 | Std. Mean Difference (IV, Random, 95% CI) | Totals not selected | |
| 4.4.1 No intervention | 3 | Std. Mean Difference (IV, Random, 95% CI) | Totals not selected | |
| 4.4.2 Wait list | 1 | Std. Mean Difference (IV, Random, 95% CI) | Totals not selected | |
| 4.5 Psychological symptoms: anxiety and depression (follow‐up > 3 to 12 months after the end of the intervention) Show forest plot | 1 | Mean Difference (IV, Random, 95% CI) | Totals not selected | |
| 4.6 Psychological symptoms: anxiety and depression (follow‐up > 12 months after the end of the intervention) Show forest plot | 1 | Mean Difference (IV, Random, 95% CI) | Totals not selected | |
| Outcome or subgroup title | No. of studies | No. of participants | Statistical method | Effect size |
| 5.1 Any symptoms of stress‐related outcome (follow‐up up to 3 months) Show forest plot | 3 | Std. Mean Difference (IV, Random, 95% CI) | Totals not selected | |
| 5.2 Any symptoms of stress‐related outcome (follow‐up > 3 to 12 months after the end of the intervention) Show forest plot | 2 | Std. Mean Difference (IV, Random, 95% CI) | Totals not selected | |
| 5.3 Psychological symptoms: anxiety and depression (follow‐up up to 3 months) Show forest plot | 1 | Std. Mean Difference (IV, Random, 95% CI) | Totals not selected | |
| 5.4 Psychological symptoms: anxiety and depression (follow‐up > 3 to 12 months after the end of the intervention) Show forest plot | 1 | 38 | Std. Mean Difference (IV, Random, 95% CI) | 0.24 [‐0.39, 0.88] |
| Outcome or subgroup title | No. of studies | No. of participants | Statistical method | Effect size |
| 6.1 Any symptoms of stress‐related outcome (follow‐up up to 3 months) Show forest plot | 1 | Mean Difference (IV, Random, 95% CI) | Totals not selected | |
| 6.2 Any symptoms of stress‐related outcome (follow‐up > 3 to 12 months after the end of the intervention) Show forest plot | 1 | Mean Difference (IV, Random, 95% CI) | Totals not selected | |