Scolaris Content Display Scolaris Content Display

original image

Figuras y tablas -
Figure 1

Risk of bias summary: review authors' judgements about each risk of bias item for each included study.

Figuras y tablas -
Figure 2

Risk of bias summary: review authors' judgements about each risk of bias item for each included study.

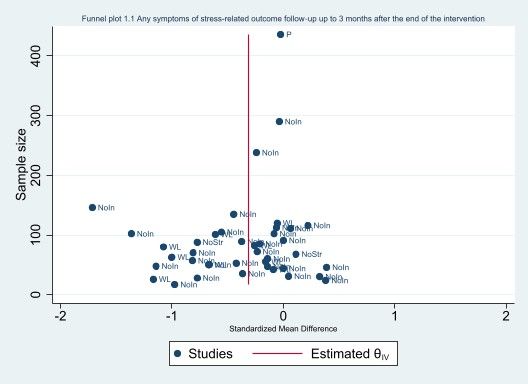
Funnel plot (1.1 Any symptoms of stress‐related outcome (follow‐up up to 3 months after the end of the intervention)
Figuras y tablas -
Figure 3

Funnel plot (1.1 Any symptoms of stress‐related outcome (follow‐up up to 3 months after the end of the intervention)

Funnel plot (1.2 Any symptoms of stress‐related outcome (follow‐up > 3 to 12 months after the end of the intervention))
Figuras y tablas -
Figure 4

Funnel plot (1.2 Any symptoms of stress‐related outcome (follow‐up > 3 to 12 months after the end of the intervention))

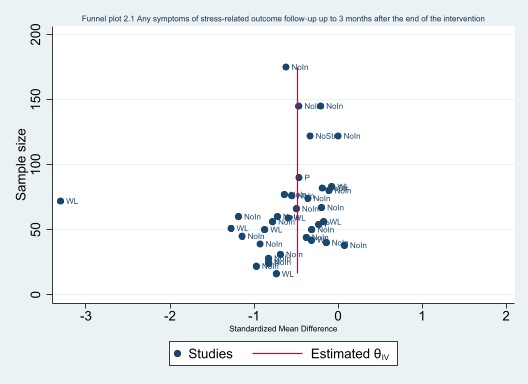
Funnel plot (2.1 Any symptoms of stress‐related outcome (follow‐up up to 3 months after the end of the intervention))
Figuras y tablas -
Figure 5

Funnel plot (2.1 Any symptoms of stress‐related outcome (follow‐up up to 3 months after the end of the intervention))

Funnel plot (4.1 Any symptoms of stress‐related outcome (follow‐up up to 3 months after the end of the intervention))
Figuras y tablas -
Figure 6

Funnel plot (4.1 Any symptoms of stress‐related outcome (follow‐up up to 3 months after the end of the intervention))

Comparison 1: ‘Focus one’s attention on the experience of stress (thoughts, feelings, behaviour)’ vs No intervention/wait list/placebo/no stress‐reduction intervention (SMD), Outcome 1: Any symptoms of stress‐related outcome (follow‐up up to 3 months after the end of the intervention)

Figuras y tablas -
Analysis 1.1

Comparison 1: ‘Focus one’s attention on the experience of stress (thoughts, feelings, behaviour)’ vs No intervention/wait list/placebo/no stress‐reduction intervention (SMD), Outcome 1: Any symptoms of stress‐related outcome (follow‐up up to 3 months after the end of the intervention)

Comparison 1: ‘Focus one’s attention on the experience of stress (thoughts, feelings, behaviour)’ vs No intervention/wait list/placebo/no stress‐reduction intervention (SMD), Outcome 2:  Any symptoms of stress‐related outcome (follow‐up > 3 to 12 months after the end of the intervention)

Figuras y tablas -
Analysis 1.2

Comparison 1: ‘Focus one’s attention on the experience of stress (thoughts, feelings, behaviour)’ vs No intervention/wait list/placebo/no stress‐reduction intervention (SMD), Outcome 2:  Any symptoms of stress‐related outcome (follow‐up > 3 to 12 months after the end of the intervention)

Comparison 1: ‘Focus one’s attention on the experience of stress (thoughts, feelings, behaviour)’ vs No intervention/wait list/placebo/no stress‐reduction intervention (SMD), Outcome 3: Any symptoms of stress‐related outcome (follow‐up >12 months)

Figuras y tablas -
Analysis 1.3

Comparison 1: ‘Focus one’s attention on the experience of stress (thoughts, feelings, behaviour)’ vs No intervention/wait list/placebo/no stress‐reduction intervention (SMD), Outcome 3: Any symptoms of stress‐related outcome (follow‐up >12 months)

Comparison 1: ‘Focus one’s attention on the experience of stress (thoughts, feelings, behaviour)’ vs No intervention/wait list/placebo/no stress‐reduction intervention (SMD), Outcome 4: Psychological symptoms: anxiety and depression (follow‐up up to 3 months after the end of the intervention)

Figuras y tablas -
Analysis 1.4

Comparison 1: ‘Focus one’s attention on the experience of stress (thoughts, feelings, behaviour)’ vs No intervention/wait list/placebo/no stress‐reduction intervention (SMD), Outcome 4: Psychological symptoms: anxiety and depression (follow‐up up to 3 months after the end of the intervention)

Comparison 1: ‘Focus one’s attention on the experience of stress (thoughts, feelings, behaviour)’ vs No intervention/wait list/placebo/no stress‐reduction intervention (SMD), Outcome 5: Psychological symptoms: anxiety and depression (follow‐up > 3 to 12 months after the end of the intervention)

Figuras y tablas -
Analysis 1.5

Comparison 1: ‘Focus one’s attention on the experience of stress (thoughts, feelings, behaviour)’ vs No intervention/wait list/placebo/no stress‐reduction intervention (SMD), Outcome 5: Psychological symptoms: anxiety and depression (follow‐up > 3 to 12 months after the end of the intervention)

Comparison 1: ‘Focus one’s attention on the experience of stress (thoughts, feelings, behaviour)’ vs No intervention/wait list/placebo/no stress‐reduction intervention (SMD), Outcome 6: Explanatory analysis ‐ subgroup  (short vs long duration of intervention): any symptoms of stress‐related outcome (follow‐up up to 3 months after the end of the intervention)

Figuras y tablas -
Analysis 1.6

Comparison 1: ‘Focus one’s attention on the experience of stress (thoughts, feelings, behaviour)’ vs No intervention/wait list/placebo/no stress‐reduction intervention (SMD), Outcome 6: Explanatory analysis ‐ subgroup  (short vs long duration of intervention): any symptoms of stress‐related outcome (follow‐up up to 3 months after the end of the intervention)

Comparison 2:  ‘Focus one’s attention away from the experience of stress by means of relaxation, exercise or something else’ vs No intervention/wait list/placebo/no stress‐reduction intervention (SMD), Outcome 1: Any symptoms of stress‐related outcome (follow‐up up to 3 months after the end of the intervention)

Figuras y tablas -
Analysis 2.1

Comparison 2:  ‘Focus one’s attention away from the experience of stress by means of relaxation, exercise or something else’ vs No intervention/wait list/placebo/no stress‐reduction intervention (SMD), Outcome 1: Any symptoms of stress‐related outcome (follow‐up up to 3 months after the end of the intervention)

Comparison 2:  ‘Focus one’s attention away from the experience of stress by means of relaxation, exercise or something else’ vs No intervention/wait list/placebo/no stress‐reduction intervention (SMD), Outcome 2: Any symptoms of stress‐related outcome (follow‐up > 3 to 12 months after the end of the intervention)

Figuras y tablas -
Analysis 2.2

Comparison 2:  ‘Focus one’s attention away from the experience of stress by means of relaxation, exercise or something else’ vs No intervention/wait list/placebo/no stress‐reduction intervention (SMD), Outcome 2: Any symptoms of stress‐related outcome (follow‐up > 3 to 12 months after the end of the intervention)

Comparison 2:  ‘Focus one’s attention away from the experience of stress by means of relaxation, exercise or something else’ vs No intervention/wait list/placebo/no stress‐reduction intervention (SMD), Outcome 3: Psychological symptoms: anxiety and depression (follow‐up up to 3 months after the end of the intervention)

Figuras y tablas -
Analysis 2.3

Comparison 2:  ‘Focus one’s attention away from the experience of stress by means of relaxation, exercise or something else’ vs No intervention/wait list/placebo/no stress‐reduction intervention (SMD), Outcome 3: Psychological symptoms: anxiety and depression (follow‐up up to 3 months after the end of the intervention)

Comparison 2:  ‘Focus one’s attention away from the experience of stress by means of relaxation, exercise or something else’ vs No intervention/wait list/placebo/no stress‐reduction intervention (SMD), Outcome 4: Explanatory analysis ‐ subgroup (short vs long duration of intervention): any symptoms of stress‐related outcome (follow‐up up to 3 months after the end of the intervention)

Figuras y tablas -
Analysis 2.4

Comparison 2:  ‘Focus one’s attention away from the experience of stress by means of relaxation, exercise or something else’ vs No intervention/wait list/placebo/no stress‐reduction intervention (SMD), Outcome 4: Explanatory analysis ‐ subgroup (short vs long duration of intervention): any symptoms of stress‐related outcome (follow‐up up to 3 months after the end of the intervention)

Comparison 3:  ‘Focus on work‐related risk factors on an individual level such as work demands’ vs No intervention/no stress‐reduction intervention (SMD), Outcome 1: Any symptoms of stress‐related outcome (follow‐up up to 3 months after the end of the intervention)

Figuras y tablas -
Analysis 3.1

Comparison 3:  ‘Focus on work‐related risk factors on an individual level such as work demands’ vs No intervention/no stress‐reduction intervention (SMD), Outcome 1: Any symptoms of stress‐related outcome (follow‐up up to 3 months after the end of the intervention)

Comparison 3:  ‘Focus on work‐related risk factors on an individual level such as work demands’ vs No intervention/no stress‐reduction intervention (SMD), Outcome 2: Any symptoms of stress‐related outcome (follow‐up > 3 to 12 months after the end of the intervention)

Figuras y tablas -
Analysis 3.2

Comparison 3:  ‘Focus on work‐related risk factors on an individual level such as work demands’ vs No intervention/no stress‐reduction intervention (SMD), Outcome 2: Any symptoms of stress‐related outcome (follow‐up > 3 to 12 months after the end of the intervention)

Comparison 3:  ‘Focus on work‐related risk factors on an individual level such as work demands’ vs No intervention/no stress‐reduction intervention (SMD), Outcome 3: Any symptoms of stress‐related outcome (follow‐up >12 months)

Figuras y tablas -
Analysis 3.3

Comparison 3:  ‘Focus on work‐related risk factors on an individual level such as work demands’ vs No intervention/no stress‐reduction intervention (SMD), Outcome 3: Any symptoms of stress‐related outcome (follow‐up >12 months)

Comparison 3:  ‘Focus on work‐related risk factors on an individual level such as work demands’ vs No intervention/no stress‐reduction intervention (SMD), Outcome 4: Psychological symptoms: anxiety and depression (follow‐up > 3 to 12 months after the end of the intervention)

Figuras y tablas -
Analysis 3.4

Comparison 3:  ‘Focus on work‐related risk factors on an individual level such as work demands’ vs No intervention/no stress‐reduction intervention (SMD), Outcome 4: Psychological symptoms: anxiety and depression (follow‐up > 3 to 12 months after the end of the intervention)

Comparison 4: ‘Combination of interventions’ vs No intervention/wait list/no stress‐reduction intervention (SMD), Outcome 1: Any symptoms of stress‐related outcome (follow‐up up to 3 months after the end of the intervention)

Figuras y tablas -
Analysis 4.1

Comparison 4: ‘Combination of interventions’ vs No intervention/wait list/no stress‐reduction intervention (SMD), Outcome 1: Any symptoms of stress‐related outcome (follow‐up up to 3 months after the end of the intervention)

Comparison 4: ‘Combination of interventions’ vs No intervention/wait list/no stress‐reduction intervention (SMD), Outcome 2: Any symptoms of stress‐related outcome (follow‐up > 3 to 12 months after the end of the intervention)

Figuras y tablas -
Analysis 4.2

Comparison 4: ‘Combination of interventions’ vs No intervention/wait list/no stress‐reduction intervention (SMD), Outcome 2: Any symptoms of stress‐related outcome (follow‐up > 3 to 12 months after the end of the intervention)

Comparison 4: ‘Combination of interventions’ vs No intervention/wait list/no stress‐reduction intervention (SMD), Outcome 3: Any symptoms of stress‐related outcome (follow‐up > 12 months)

Figuras y tablas -
Analysis 4.3

Comparison 4: ‘Combination of interventions’ vs No intervention/wait list/no stress‐reduction intervention (SMD), Outcome 3: Any symptoms of stress‐related outcome (follow‐up > 12 months)

Comparison 4: ‘Combination of interventions’ vs No intervention/wait list/no stress‐reduction intervention (SMD), Outcome 4: Psychological symptoms: anxiety and depression (follow‐up up to 3 months after the end of the intervention)

Figuras y tablas -
Analysis 4.4

Comparison 4: ‘Combination of interventions’ vs No intervention/wait list/no stress‐reduction intervention (SMD), Outcome 4: Psychological symptoms: anxiety and depression (follow‐up up to 3 months after the end of the intervention)

Comparison 4: ‘Combination of interventions’ vs No intervention/wait list/no stress‐reduction intervention (SMD), Outcome 5: Psychological symptoms: anxiety and depression (follow‐up > 3 to 12 months after the end of the intervention)

Figuras y tablas -
Analysis 4.5

Comparison 4: ‘Combination of interventions’ vs No intervention/wait list/no stress‐reduction intervention (SMD), Outcome 5: Psychological symptoms: anxiety and depression (follow‐up > 3 to 12 months after the end of the intervention)

Comparison 4: ‘Combination of interventions’ vs No intervention/wait list/no stress‐reduction intervention (SMD), Outcome 6: Psychological symptoms: anxiety and depression (follow‐up > 12 months after the end of the intervention)

Figuras y tablas -
Analysis 4.6

Comparison 4: ‘Combination of interventions’ vs No intervention/wait list/no stress‐reduction intervention (SMD), Outcome 6: Psychological symptoms: anxiety and depression (follow‐up > 12 months after the end of the intervention)

Comparison 5: Focus one’s attention on the experience of stress vs focus one’s attention away from the experience of stress, Outcome 1:  Any symptoms of stress‐related outcome (follow‐up up to 3 months)

Figuras y tablas -
Analysis 5.1

Comparison 5: Focus one’s attention on the experience of stress vs focus one’s attention away from the experience of stress, Outcome 1:  Any symptoms of stress‐related outcome (follow‐up up to 3 months)

Comparison 5: Focus one’s attention on the experience of stress vs focus one’s attention away from the experience of stress, Outcome 2: Any symptoms of stress‐related outcome (follow‐up > 3 to 12 months after the end of the intervention)

Figuras y tablas -
Analysis 5.2

Comparison 5: Focus one’s attention on the experience of stress vs focus one’s attention away from the experience of stress, Outcome 2: Any symptoms of stress‐related outcome (follow‐up > 3 to 12 months after the end of the intervention)

Comparison 5: Focus one’s attention on the experience of stress vs focus one’s attention away from the experience of stress, Outcome 3: Psychological symptoms: anxiety and depression (follow‐up up to 3 months)

Figuras y tablas -
Analysis 5.3

Comparison 5: Focus one’s attention on the experience of stress vs focus one’s attention away from the experience of stress, Outcome 3: Psychological symptoms: anxiety and depression (follow‐up up to 3 months)

Comparison 5: Focus one’s attention on the experience of stress vs focus one’s attention away from the experience of stress, Outcome 4: Psychological symptoms: anxiety and depression (follow‐up > 3 to 12 months after the end of the intervention)

Figuras y tablas -
Analysis 5.4

Comparison 5: Focus one’s attention on the experience of stress vs focus one’s attention away from the experience of stress, Outcome 4: Psychological symptoms: anxiety and depression (follow‐up > 3 to 12 months after the end of the intervention)

Comparison 6:  ‘Combination of interventions’ vs focus one's attention on the experience of stress (SMD), Outcome 1: Any symptoms of stress‐related outcome (follow‐up up to 3 months)

Figuras y tablas -
Analysis 6.1

Comparison 6:  ‘Combination of interventions’ vs focus one's attention on the experience of stress (SMD), Outcome 1: Any symptoms of stress‐related outcome (follow‐up up to 3 months)

Comparison 6:  ‘Combination of interventions’ vs focus one's attention on the experience of stress (SMD), Outcome 2: Any symptoms of stress‐related outcome (follow‐up > 3 to 12 months after the end of the intervention)

Figuras y tablas -
Analysis 6.2

Comparison 6:  ‘Combination of interventions’ vs focus one's attention on the experience of stress (SMD), Outcome 2: Any symptoms of stress‐related outcome (follow‐up > 3 to 12 months after the end of the intervention)

Summary of findings 1. An intervention in which one's attention is on the experience of stress (feelings, thoughts, behavior) compared to no intervention/wait list/placebo/no stress‐reduction intervention for stress reduction in healthcare workers

An intervention in which one's attention is on the experience of stress compared to no intervention/wait list/placebo/no stress‐reduction intervention for stress reduction in healthcare workers

Patient or population: healthcare workers 
Setting: various healthcare settings
Intervention: an intervention in which one's attention is on the experience of stress 
Comparison: no intervention/wait list/placebo/no stress‐reduction intervention

Outcomes

Anticipated absolute effects* (95% CI)

№ of participants
(studies)

Certainty of the evidence
(GRADE)

What happens

Effect with an intervention in which one's attention is on the experience of stress

Stress symptoms (follow‐up up to and including 3 months after end of intervention)

SMD 0.37  lower
(0.52 lower to 0.23 lower)

3645
(41 RCTs)

⊕⊕⊝⊝
Low1

On the short term, an intervention in which one's attention is on the experience of stress may result in a reduction in stress symptoms. The standardized mean difference translates back to 4.6 fewer (6.4 fewer to 2.8 fewer) points on the MBI‐emotional exhaustion scale2.

Stress symptoms (follow‐up > 3 to 12 months after end of intervention)

SMD 0.43  lower
(0.71 lower to 0.14 lower)

1851
(19 RCTs)

⊕⊕⊝⊝
Low1

On the medium term, focus one's attention on the experience of stress may result in a reduction in stress symptoms. The standardized mean difference translates back to 5.3 fewer (8.7 fewer to 1.7 fewer) points on the MBI‐emotional exhaustion scale3.

Stress symptoms (follow‐up >12 months after end of intervention)

no effect estimate

68
(1 RCT)

⊕⊝⊝⊝
Very low 2

The evidence is very uncertain about the long‐term effect on stress symptoms of focusing one's attention on the experience of stress.

*The risk in the intervention group (and its 95% confidence interval) is based on the assumed risk in the comparison group and the relative effect of the intervention (and its 95% CI). 

CI: confidence interval; SMD: standardized mean difference

GRADE Working Group grades of evidence
High certainty: we are very confident that the true effect lies close to that of the estimate of the effect.
Moderate certainty: we are moderately confident in the effect estimate: the true effect is likely to be close to the estimate of the effect, but there is a possibility that it is substantially different.
Low certainty: our confidence in the effect estimate is limited: the true effect may be substantially different from the estimate of the effect.
Very low certainty: we have very little confidence in the effect estimate: the true effect is likely to be substantially different from the estimate of effect.

1 The certainty of the evidence was downgraded by two levels for very serious risk of bias (bias arising from the randomisation process and lack of blinding; i.e. performance bias) in combination with some inconsistency and suspicion of publication bias.

2 The certainty of the evidence was downgraded by three levels for very serious risk of bias (bias arising from the randomisation process and lack of blinding; i.e. performance bias) and very serious imprecision (small sample size, the confidence interval includes both a benefit and a harm).

3 The MBI‐Emotional exhaustion scale has a total score of 54 and we used the mean score (23.6) and standard deviation (12.2) of the control healthcare workers population in Fiol DeRoque 2021 as reference for interpreting the effect sizes. A score below 18 points is regarded as a low score on emotional exhaustion and a score above 36 as a high score on emotional exhaustion (Maslach 1996).

Figuras y tablas -
Summary of findings 1. An intervention in which one's attention is on the experience of stress (feelings, thoughts, behavior) compared to no intervention/wait list/placebo/no stress‐reduction intervention for stress reduction in healthcare workers
Summary of findings 2. An intervention in which one's attention is away from the experience of stress compared to no intervention/wait list/placebo/no stress‐reduction intervention for stress reduction in healthcare workers

An intervention in which one's attention is away from the experience of stress compared to no intervention/wait list/placebo/no stress‐reduction intervention for stress reduction in healthcare workers

Patient or population: healthcare workers 
Setting: various healthcare settings
Intervention: an intervention in which one's attention is away from the experience of stress 
Comparison: no intervention/wait list/placebo/no stress‐reduction intervention 

Outcomes

Anticipated absolute effects* (95% CI)

№ of participants
(studies)

Certainty of the evidence
(GRADE)

What happens

Risk with an intervention in which one's attention is away from the experience of stress

Stress symptoms (follow‐up up to and including 3 months after end of intervention)

SMD 0.55 lower
(0.70 lower to 0.40 lower)

2366
(35 RCTs)

⊕⊕⊝⊝
Low 1

On the short term, an intervention in which one's attention is away from the experience of stress may result in a reduction in stress symptoms. The standardized mean difference translates back to 6.8 fewer (8.6 fewer to 4.9 fewer) points on the MBI‐emotional exhaustion scale2.

Stress symptoms (follow‐up > 3 to 12 months after end of intervention)

SMD 0.41 lower
(0.79 lower to 0.03 lower)

427
(6 RCTs)

⊕⊕⊝⊝
Low 1

On the medium term, an intervention in which one's attention is away from the experience of stress may result in a reduction in stress symptoms. The standardized mean difference translates back to 5.0 fewer (9.7 fewer to 0.4 fewer) points on the MBI‐emotional exhaustion scale2.

Stress symptoms (follow‐up >12 months after end of intervention)

(0 RCTs)

No studies reported the long‐term effect on stress symptoms of focusing one's attention away from the experience of stress.

*The risk in the intervention group (and its 95% confidence interval) is based on the assumed risk in the comparison group and the relative effect of the intervention (and its 95% CI). 

CI: confidence interval; SMD: standardized mean difference

GRADE Working Group grades of evidence
High certainty: we are very confident that the true effect lies close to that of the estimate of the effect.
Moderate certainty: we are moderately confident in the effect estimate: the true effect is likely to be close to the estimate of the effect, but there is a possibility that it is substantially different.
Low certainty: our confidence in the effect estimate is limited: the true effect may be substantially different from the estimate of the effect.
Very low certainty: we have very little confidence in the effect estimate: the true effect is likely to be substantially different from the estimate of effect.

1 The certainty of the evidence was downgraded by two levels for very serious risk of bias (bias arising from the randomisation process and lack of blinding; i.e. performance bias) in combination with some inconsistency and suspicion of publication bias.

3 The MBI‐emotional exhaustion scale has a total score of 54 and we used the mean score (23.6) and standard deviation (12.2) of the control healthcare workers population in Fiol DeRoque 2021 as reference for interpreting the effect sizes. A score below 18 points is regarded as a low score on emotional exhaustion and a score above 36 as a high score on emotional exhaustion (Maslach 1996).

Figuras y tablas -
Summary of findings 2. An intervention in which one's attention is away from the experience of stress compared to no intervention/wait list/placebo/no stress‐reduction intervention for stress reduction in healthcare workers
Summary of findings 3. An intervention in which the focus is on work‐related risk factors on an individual level compared to no intervention/no stress‐reduction interventionfor stress reduction in healthcare workers

An intervention in which the focus is on work‐related risk factors on an individual level compared to no intervention/no stress‐reduction intervention for stress reduction in healthcare workers

Patient or population: healthcare workers 
Setting: various healthcare settings
Intervention: an intervention in which the focus is on work‐related risk factors on an individual level 
Comparison: No intervention/no stress‐reduction intervention

Outcomes

Anticipated absolute effects* (95% CI)

№ of participants
(studies)

Certainty of the evidence
(GRADE)

What happens

Effect with an intervention in which the focus is on work‐related risk factors on an individual level

Stress symptoms (follow‐up up to and including 3 months after end of intervention)

no effect estimate

87
(3 RCTs)

⊕⊝⊝⊝
Very low 1

The evidence is very uncertain about the short‐term effect of an intervention in which the focus is on work‐related risk factors on stress symptoms.

Stress symptoms (follow‐up > 3 to 12 months after end of intervention)

no effect estimate

152
(2 RCTs)

⊕⊝⊝⊝
Very low 2

The evidence is very uncertain about the medium‐term effect of an intervention in which the focus is on work‐related risk factors on stress symptoms.

Stress symptoms (follow‐up >12 months after end of intervention)

no effect estimate

161
(1 RCT)

⊕⊝⊝⊝
Very low 2

The evidence is very uncertain about the long‐term effect of an intervention in which the focus is on work‐related risk factors on stress symptoms.

*The risk in the intervention group (and its 95% confidence interval) is based on the assumed risk in the comparison group and the relative effect of the intervention (and its 95% CI). 

CI: confidence interval; SMD: standardized mean difference; MD: mean difference

GRADE Working Group grades of evidence
High certainty: we are very confident that the true effect lies close to that of the estimate of the effect.
Moderate certainty: we are moderately confident in the effect estimate: the true effect is likely to be close to the estimate of the effect, but there is a possibility that it is substantially different.
Low certainty: our confidence in the effect estimate is limited: the true effect may be substantially different from the estimate of the effect.
Very low certainty: we have very little confidence in the effect estimate: the true effect is likely to be substantially different from the estimate of effect.

1 The certainty of the evidence was downgraded by three levels for very serious risk of bias (bias arising from the randomisation process and lack of blinding; i.e. performance bias), inconsistency and very serious imprecision (small sample size, the confidence interval includes both a benefit and a harm).

2 The certainty of the evidence was downgraded by three levels for very serious risk of bias (bias arising from the randomisation process and lack of blinding; i.e. performance bias) and very serious imprecision (small sample size, the confidence interval includes both a benefit and no effect).

Figuras y tablas -
Summary of findings 3. An intervention in which the focus is on work‐related risk factors on an individual level compared to no intervention/no stress‐reduction interventionfor stress reduction in healthcare workers
Summary of findings 4. A combination of individual‐level interventions compared to no intervention/wait list/no stress‐reduction intervention for stress reduction in healthcare workers

A combination of individual‐level interventions compared to no intervention/wait list/no stress‐reduction intervention for stress reduction in healthcare workers

Patient or population: healthcare workers
Setting: various healthcare settings
Intervention: a combination of individual‐level interventions
Comparison: no intervention/wait list/no stress‐reduction intervention

Outcomes

Anticipated absolute effects* (95% CI)

№ of participants
(studies)

Certainty of the evidence
(GRADE)

What happens

Effect with a combination of individual‐level interventions

Stress symptoms (follow‐up up to and including 3 months after end of intervention)

SMD 0.67 lower
(0.95 lower to 0.39 lower)

1003
(15 RCTs)

⊕⊕⊝⊝
Low 1

On the short term, a combination of individual‐level interventions may result in a reduction in stress symptoms. The standardized mean difference translates back to 8.2 fewer (11.7 fewer to 4.8 fewer) points on the MBI‐Emotional exhaustion scale4.

Stress symptoms (follow‐up > 3 to 12 months after end of intervention)

SMD 0.48 lower
(0.95 lower to 0.00)

574
(6 RCTs)

⊕⊕⊝⊝
Low 2

On the medium term, a combination of individual‐level interventions may result in a reduction in stress symptoms, but the evidence does not exclude no effect. The standardized mean difference translates back to 5.9 fewer points (11.7 fewer to no difference) on the MBI‐Emotional exhaustion scale4.

Stress symptoms (follow‐up >12 months after end of intervention)

no effect estimate

88
(1 RCT)

⊕⊝⊝⊝
Very low 3

The evidence is very uncertain about the long‐term effect of a combination of individual‐level interventions on stress symptoms.

CI: confidence interval; SMD: standardized mean difference

GRADE Working Group grades of evidence
High certainty: we are very confident that the true effect lies close to that of the estimate of the effect.
Moderate certainty: we are moderately confident in the effect estimate: the true effect is likely to be close to the estimate of the effect, but there is a possibility that it is substantially different.
Low certainty: our confidence in the effect estimate is limited: the true effect may be substantially different from the estimate of the effect.
Very low certainty: we have very little confidence in the effect estimate: the true effect is likely to be substantially different from the estimate of effect.

1 The certainty of the evidence was downgraded by two levels for very serious risk of bias (bias arising from the randomisation process and lack of blinding; i.e. performance bias) in combination with some inconsistency and suspicion of publication bias.

2 The certainty of the evidence was downgraded by two levels for very serious risk of bias (lack of blinding; i.e. performance bias) and inconsistency. We did not downgrade for imprecision, as the wide confidence interval is due to the inconsistency between study results.

3 The certainty of the evidence was downgraded by three levels for very serious risk of bias (bias arising from the randomisation process and lack of blinding; i.e. performance bias) and very serious imprecision (small sample size, the confidence interval includes both a benefit and a harm).

4 The MBI‐emotional exhaustion scale has a total score of 54 and we used the mean score (23.6) and standard deviation (12.2) of the control HCW population in Fiol DeRoque 2021 as reference for interpreting the effect sizes. A score below 18 points is regarded as a low score on emotional exhaustion and a score above 36 as a high score on emotional exhaustion (Maslach 1996).

Figuras y tablas -
Summary of findings 4. A combination of individual‐level interventions compared to no intervention/wait list/no stress‐reduction intervention for stress reduction in healthcare workers
Comparison 1. ‘Focus one’s attention on the experience of stress (thoughts, feelings, behaviour)’ vs No intervention/wait list/placebo/no stress‐reduction intervention (SMD)

Outcome or subgroup title

No. of studies

No. of participants

Statistical method

Effect size

1.1 Any symptoms of stress‐related outcome (follow‐up up to 3 months after the end of the intervention) Show forest plot

41

3645

Std. Mean Difference (IV, Random, 95% CI)

‐0.37 [‐0.52, ‐0.23]

1.1.1 No intervention

29

2434

Std. Mean Difference (IV, Random, 95% CI)

‐0.35 [‐0.53, ‐0.16]

1.1.2 Wait list 

9

619

Std. Mean Difference (IV, Random, 95% CI)

‐0.52 [‐0.80, ‐0.25]

1.1.3 Placebo 

1

436

Std. Mean Difference (IV, Random, 95% CI)

‐0.02 [‐0.21, 0.16]

1.1.4 No stress‐reduction intervention

2

156

Std. Mean Difference (IV, Random, 95% CI)

‐0.33 [‐1.19, 0.53]

1.2  Any symptoms of stress‐related outcome (follow‐up > 3 to 12 months after the end of the intervention) Show forest plot

19

1851

Std. Mean Difference (IV, Random, 95% CI)

‐0.43 [‐0.71, ‐0.14]

1.2.1 No intervention

11

1271

Std. Mean Difference (IV, Random, 95% CI)

‐0.46 [‐0.90, ‐0.02]

1.2.2 Wait list

6

480

Std. Mean Difference (IV, Random, 95% CI)

‐0.53 [‐0.83, ‐0.24]

1.2.3 No stress reduction intervention

2

100

Std. Mean Difference (IV, Random, 95% CI)

0.16 [‐0.23, 0.56]

1.3 Any symptoms of stress‐related outcome (follow‐up >12 months) Show forest plot

1

Mean Difference (IV, Random, 95% CI)

Totals not selected

1.4 Psychological symptoms: anxiety and depression (follow‐up up to 3 months after the end of the intervention) Show forest plot

8

742

Std. Mean Difference (IV, Random, 95% CI)

‐0.27 [‐0.58, 0.03]

1.4.1 No intervention

7

482

Std. Mean Difference (IV, Random, 95% CI)

‐0.28 [‐0.68, 0.11]

1.4.2 Wait list

1

260

Std. Mean Difference (IV, Random, 95% CI)

‐0.28 [‐0.53, ‐0.04]

1.5 Psychological symptoms: anxiety and depression (follow‐up > 3 to 12 months after the end of the intervention) Show forest plot

3

Std. Mean Difference (IV, Random, 95% CI)

Totals not selected

1.5.1 No intervention

3

Std. Mean Difference (IV, Random, 95% CI)

Totals not selected

1.6 Explanatory analysis ‐ subgroup  (short vs long duration of intervention): any symptoms of stress‐related outcome (follow‐up up to 3 months after the end of the intervention) Show forest plot

41

3645

Std. Mean Difference (IV, Random, 95% CI)

‐0.37 [‐0.52, ‐0.23]

1.6.1 Short (< 12weeks)

29

2647

Std. Mean Difference (IV, Random, 95% CI)

‐0.32 [‐0.49, ‐0.15]

1.6.2 Long (≥ 12 weeks)

12

998

Std. Mean Difference (IV, Random, 95% CI)

‐0.50 [‐0.78, ‐0.22]

Figuras y tablas -
Comparison 1. ‘Focus one’s attention on the experience of stress (thoughts, feelings, behaviour)’ vs No intervention/wait list/placebo/no stress‐reduction intervention (SMD)
Comparison 2.  ‘Focus one’s attention away from the experience of stress by means of relaxation, exercise or something else’ vs No intervention/wait list/placebo/no stress‐reduction intervention (SMD)

Outcome or subgroup title

No. of studies

No. of participants

Statistical method

Effect size

2.1 Any symptoms of stress‐related outcome (follow‐up up to 3 months after the end of the intervention) Show forest plot

35

2366

Std. Mean Difference (IV, Random, 95% CI)

‐0.55 [‐0.70, ‐0.40]

2.1.1 No intervention

22

1565

Std. Mean Difference (IV, Random, 95% CI)

‐0.48 [‐0.61, ‐0.35]

2.1.2 Wait list

8

429

Std. Mean Difference (IV, Random, 95% CI)

‐0.88 [‐1.53, ‐0.24]

2.1.3 Placebo

3

168

Std. Mean Difference (IV, Random, 95% CI)

‐0.43 [‐0.74, ‐0.12]

2.1.4 No stress‐reduction intervention

2

204

Std. Mean Difference (IV, Random, 95% CI)

‐0.27 [‐0.55, 0.00]

2.2 Any symptoms of stress‐related outcome (follow‐up > 3 to 12 months after the end of the intervention) Show forest plot

6

427

Std. Mean Difference (IV, Random, 95% CI)

‐0.41 [‐0.79, ‐0.03]

2.2.1 No intervention

4

312

Std. Mean Difference (IV, Random, 95% CI)

‐0.43 [‐0.98, 0.12]

2.2.2 Wait list

2

115

Std. Mean Difference (IV, Random, 95% CI)

‐0.40 [‐0.77, ‐0.03]

2.3 Psychological symptoms: anxiety and depression (follow‐up up to 3 months after the end of the intervention) Show forest plot

7

378

Std. Mean Difference (IV, Random, 95% CI)

‐1.07 [‐1.95, ‐0.19]

2.3.1 No intervention

2

127

Std. Mean Difference (IV, Random, 95% CI)

‐0.67 [‐1.60, 0.25]

2.3.2 Wait list

3

173

Std. Mean Difference (IV, Random, 95% CI)

‐1.89 [‐4.24, 0.46]

2.3.3 Placebo

2

78

Std. Mean Difference (IV, Random, 95% CI)

‐0.34 [‐0.79, 0.11]

2.4 Explanatory analysis ‐ subgroup (short vs long duration of intervention): any symptoms of stress‐related outcome (follow‐up up to 3 months after the end of the intervention) Show forest plot

35

2366

Std. Mean Difference (IV, Random, 95% CI)

‐0.55 [‐0.70, ‐0.40]

2.4.1 Short (<12 weeks)

33

2255

Std. Mean Difference (IV, Random, 95% CI)

‐0.52 [‐0.68, ‐0.37]

2.4.2 Long (≥ 12 weeks)

2

111

Std. Mean Difference (IV, Random, 95% CI)

‐0.96 [‐1.48, ‐0.43]

Figuras y tablas -
Comparison 2.  ‘Focus one’s attention away from the experience of stress by means of relaxation, exercise or something else’ vs No intervention/wait list/placebo/no stress‐reduction intervention (SMD)
Comparison 3.  ‘Focus on work‐related risk factors on an individual level such as work demands’ vs No intervention/no stress‐reduction intervention (SMD)

Outcome or subgroup title

No. of studies

No. of participants

Statistical method

Effect size

3.1 Any symptoms of stress‐related outcome (follow‐up up to 3 months after the end of the intervention) Show forest plot

3

Std. Mean Difference (IV, Random, 95% CI)

Totals not selected

3.1.1 No intervention

2

Std. Mean Difference (IV, Random, 95% CI)

Totals not selected

3.1.2 No stress‐reduction intervention

1

Std. Mean Difference (IV, Random, 95% CI)

Totals not selected

3.2 Any symptoms of stress‐related outcome (follow‐up > 3 to 12 months after the end of the intervention) Show forest plot

2

Std. Mean Difference (IV, Random, 95% CI)

Totals not selected

3.3 Any symptoms of stress‐related outcome (follow‐up >12 months) Show forest plot

1

Mean Difference (IV, Random, 95% CI)

Totals not selected

3.4 Psychological symptoms: anxiety and depression (follow‐up > 3 to 12 months after the end of the intervention) Show forest plot

1

Mean Difference (IV, Random, 95% CI)

Totals not selected

Figuras y tablas -
Comparison 3.  ‘Focus on work‐related risk factors on an individual level such as work demands’ vs No intervention/no stress‐reduction intervention (SMD)
Comparison 4. ‘Combination of interventions’ vs No intervention/wait list/no stress‐reduction intervention (SMD)

Outcome or subgroup title

No. of studies

No. of participants

Statistical method

Effect size

4.1 Any symptoms of stress‐related outcome (follow‐up up to 3 months after the end of the intervention) Show forest plot

15

1003

Std. Mean Difference (IV, Random, 95% CI)

‐0.67 [‐0.95, ‐0.39]

4.1.1 No intervention

10

666

Std. Mean Difference (IV, Random, 95% CI)

‐0.71 [‐1.08, ‐0.34]

4.1.2 Wait list

4

270

Std. Mean Difference (IV, Random, 95% CI)

‐0.79 [‐1.21, ‐0.38]

4.1.3 No stress‐reduction intervention

1

67

Std. Mean Difference (IV, Random, 95% CI)

0.13 [‐0.35, 0.61]

4.2 Any symptoms of stress‐related outcome (follow‐up > 3 to 12 months after the end of the intervention) Show forest plot

6

574

Std. Mean Difference (IV, Random, 95% CI)

‐0.48 [‐0.95, ‐0.00]

4.2.1 No intervention

3

330

Std. Mean Difference (IV, Random, 95% CI)

‐0.70 [‐1.52, 0.12]

4.2.2 Wait list

2

177

Std. Mean Difference (IV, Random, 95% CI)

‐0.36 [‐0.65, ‐0.06]

4.2.3 No stress‐reduction intervention

1

67

Std. Mean Difference (IV, Random, 95% CI)

0.00 [‐0.48, 0.48]

4.3 Any symptoms of stress‐related outcome (follow‐up > 12 months) Show forest plot

1

Mean Difference (IV, Random, 95% CI)

Totals not selected

4.4 Psychological symptoms: anxiety and depression (follow‐up up to 3 months after the end of the intervention) Show forest plot

4

Std. Mean Difference (IV, Random, 95% CI)

Totals not selected

4.4.1 No intervention

3

Std. Mean Difference (IV, Random, 95% CI)

Totals not selected

4.4.2 Wait list

1

Std. Mean Difference (IV, Random, 95% CI)

Totals not selected

4.5 Psychological symptoms: anxiety and depression (follow‐up > 3 to 12 months after the end of the intervention) Show forest plot

1

Mean Difference (IV, Random, 95% CI)

Totals not selected

4.6 Psychological symptoms: anxiety and depression (follow‐up > 12 months after the end of the intervention) Show forest plot

1

Mean Difference (IV, Random, 95% CI)

Totals not selected

Figuras y tablas -
Comparison 4. ‘Combination of interventions’ vs No intervention/wait list/no stress‐reduction intervention (SMD)
Comparison 5. Focus one’s attention on the experience of stress vs focus one’s attention away from the experience of stress

Outcome or subgroup title

No. of studies

No. of participants

Statistical method

Effect size

5.1  Any symptoms of stress‐related outcome (follow‐up up to 3 months) Show forest plot

3

Std. Mean Difference (IV, Random, 95% CI)

Totals not selected

5.2 Any symptoms of stress‐related outcome (follow‐up > 3 to 12 months after the end of the intervention) Show forest plot

2

Std. Mean Difference (IV, Random, 95% CI)

Totals not selected

5.3 Psychological symptoms: anxiety and depression (follow‐up up to 3 months) Show forest plot

1

Std. Mean Difference (IV, Random, 95% CI)

Totals not selected

5.4 Psychological symptoms: anxiety and depression (follow‐up > 3 to 12 months after the end of the intervention) Show forest plot

1

38

Std. Mean Difference (IV, Random, 95% CI)

0.24 [‐0.39, 0.88]

Figuras y tablas -
Comparison 5. Focus one’s attention on the experience of stress vs focus one’s attention away from the experience of stress
Comparison 6.  ‘Combination of interventions’ vs focus one's attention on the experience of stress (SMD)

Outcome or subgroup title

No. of studies

No. of participants

Statistical method

Effect size

6.1 Any symptoms of stress‐related outcome (follow‐up up to 3 months) Show forest plot

1

Mean Difference (IV, Random, 95% CI)

Totals not selected

6.2 Any symptoms of stress‐related outcome (follow‐up > 3 to 12 months after the end of the intervention) Show forest plot

1

Mean Difference (IV, Random, 95% CI)

Totals not selected

Figuras y tablas -
Comparison 6.  ‘Combination of interventions’ vs focus one's attention on the experience of stress (SMD)