Scolaris Content Display Scolaris Content Display

Comparison 1 Person‐directed intervention vs no intervention (Short Term), Outcome 1 Beck & Srivastava Stress Scale and Perceived Stress Scale.
Figuras y tablas -
Analysis 1.1

Comparison 1 Person‐directed intervention vs no intervention (Short Term), Outcome 1 Beck & Srivastava Stress Scale and Perceived Stress Scale.

Comparison 1 Person‐directed intervention vs no intervention (Short Term), Outcome 2 Maslach Burnout Inventory.
Figuras y tablas -
Analysis 1.2

Comparison 1 Person‐directed intervention vs no intervention (Short Term), Outcome 2 Maslach Burnout Inventory.

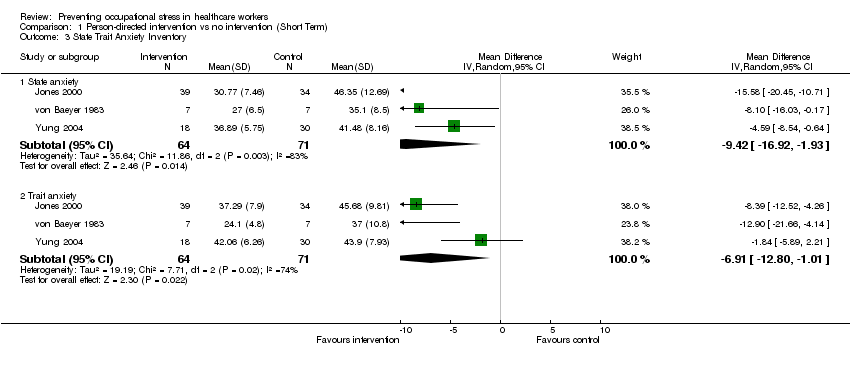
Comparison 1 Person‐directed intervention vs no intervention (Short Term), Outcome 3 State Trait Anxiety Inventory.
Figuras y tablas -
Analysis 1.3

Comparison 1 Person‐directed intervention vs no intervention (Short Term), Outcome 3 State Trait Anxiety Inventory.

Comparison 1 Person‐directed intervention vs no intervention (Short Term), Outcome 4 General Health Questionnaire.
Figuras y tablas -
Analysis 1.4

Comparison 1 Person‐directed intervention vs no intervention (Short Term), Outcome 4 General Health Questionnaire.

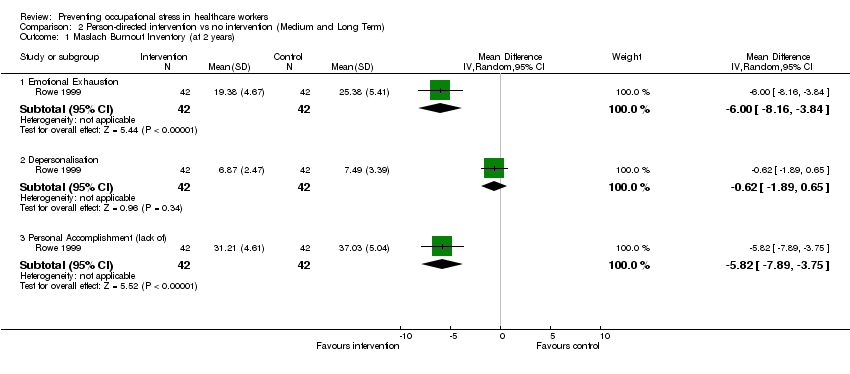
Comparison 2 Person‐directed intervention vs no intervention (Medium and Long Term), Outcome 1 Maslach Burnout Inventory (at 2 years).
Figuras y tablas -
Analysis 2.1

Comparison 2 Person‐directed intervention vs no intervention (Medium and Long Term), Outcome 1 Maslach Burnout Inventory (at 2 years).

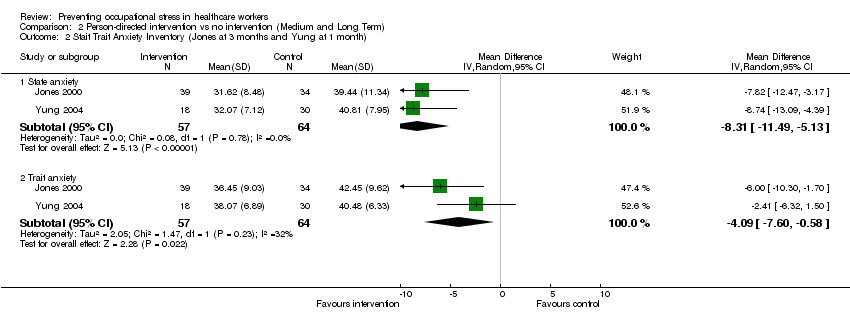
Comparison 2 Person‐directed intervention vs no intervention (Medium and Long Term), Outcome 2 Stait Trait Anxiety Inventory (Jones at 3 months and Yung at 1 month).
Figuras y tablas -
Analysis 2.2

Comparison 2 Person‐directed intervention vs no intervention (Medium and Long Term), Outcome 2 Stait Trait Anxiety Inventory (Jones at 3 months and Yung at 1 month).

Comparison 2 Person‐directed intervention vs no intervention (Medium and Long Term), Outcome 3 Perceived Stress Scale (at 1 month).
Figuras y tablas -
Analysis 2.3

Comparison 2 Person‐directed intervention vs no intervention (Medium and Long Term), Outcome 3 Perceived Stress Scale (at 1 month).

Comparison 2 Person‐directed intervention vs no intervention (Medium and Long Term), Outcome 4 General Health Questionnaire (at 1 month).
Figuras y tablas -
Analysis 2.4

Comparison 2 Person‐directed intervention vs no intervention (Medium and Long Term), Outcome 4 General Health Questionnaire (at 1 month).

Comparison 3 Work‐directed intervention vs no intervention (Short Term), Outcome 1 Maslach Burnout Inventory.
Figuras y tablas -
Analysis 3.1

Comparison 3 Work‐directed intervention vs no intervention (Short Term), Outcome 1 Maslach Burnout Inventory.

Comparison 3 Work‐directed intervention vs no intervention (Short Term), Outcome 2 Nursing Stress Scale.
Figuras y tablas -
Analysis 3.2

Comparison 3 Work‐directed intervention vs no intervention (Short Term), Outcome 2 Nursing Stress Scale.

Comparison 3 Work‐directed intervention vs no intervention (Short Term), Outcome 3 General symptoms.
Figuras y tablas -
Analysis 3.3

Comparison 3 Work‐directed intervention vs no intervention (Short Term), Outcome 3 General symptoms.

Comparison 4 Work‐directed intervention vs no intervention (Medium Term), Outcome 1 Nursing Stress Scale (at 6 months).
Figuras y tablas -
Analysis 4.1

Comparison 4 Work‐directed intervention vs no intervention (Medium Term), Outcome 1 Nursing Stress Scale (at 6 months).

Table 1. Search strategy (MEDLINE)

Search strategy

1 exp Burnout, professional
2 burnout.tw.
3 exp job satisfaction
4 job satisfaction.tw.
5 (mental adj25 health adj25 professional$) .ab,ti.
6 (stress adj25 professional$) .ab,ti.
7 (stress adj25 occupational) .ab,ti.
8 randomised controlled trial.pt.
9 controlled clinical trial.pt.
10 randomised controlled trials
11 random allocation
12 double blind method
13 single blind method
14 or/8‐13
15 clinical trial.pt.
16 exp Clinical trial
17 (clin$ adj25 trial$) .ti,ab.
18 ((singl$ or doubl$ or trebl$ or tripl$) adj25 (blind $ or 12010 mask$)) .ti,ab.
19 19 placebos
20 placebos.ti,ab.
21 random.ti,ab.
22 research design
23 or/15‐22
24 comparative study
25 exp "Evaluation and Follow Up"
26 follow up studies
27 prospective studies
28 (control$ or prospectiv$ or volunteer$) .ti,ab.
29 or/24‐28
30 14 or 23 or 29
31 animal
32 human
33 31 and 32
34 31 not 33
35 or/1‐7
36 exp anxiety/ or exp anxiety disorders
37 anxiety.ti.
38 exp Depression
39 depression.ti.
40 or/35‐39
41 exp Health personnel
42 health.mp. and personnel.ti,ab. [mp=title, abstract, registry]
43 Nursing
44 nurse.mp. or nursing.ti,ab. [mp=title, abstract, registry]
45 limit 44 to human
46 or/41‐45
47 40 and 46
48 34
49 limit 48 to human
50 30
51 limit 50 to human
52 47 and 51
53 52 and 8
54 41 or 42
55 54 and 51 and 40
56 health.mp. and personnel.tw. [mp=title, abstract, registry]
57 54 and 56
58 54 or 56
59 58 and 51 and 40
60 (health and related and occupation$) .ab,tw,ti.
61 cleaners.mp. [mp=title, abstract, registry]
62 exp Occupational diseases
63 58 and 62
64 58 or 62
65 from 64 keep 8

Figuras y tablas -
Table 1. Search strategy (MEDLINE)
Table 2. Levels of evidence: legend

HQ+

LQ+

HQ‐

LQ‐

HQinc

LQinc

High quality positive effect (strong evidence)

Low quality, positive effect (limited evidence)

High quality, negative effect (strong evidence)

Low quality, negative effect (limited evidence)

High quality, inconsistent effect

Low quality, inconsistent effect

Figuras y tablas -
Table 2. Levels of evidence: legend
Table 3. Study quality and intervention type

Study ID

Intervention type

Intervention content

Reporting

External validity

Internal validity

Power

Bittman

Person‐directed

8

2

8

4

Cohen‐Katz

Person‐directed

3

0

8

1

Delvaux

Organisational

communication skills

8

1

10

4

Ewers

Person‐directed

8

1

9

0

Heaney

Organisational

participatory problem solving

5

0

6

5

Jones

Person‐directed

7

0

8

3

Lee

Person‐directed

8

0

8

3

Lökk

Person‐directed

7

1

8

1

McElligott

Person‐directed

5

0

6

0

Melchior

Organisational

primary nursing

7

1

7

4

Norvell

Person‐directed

3

0

6

0

Proctor

Organisational

coping with difficult residents

6

0

7

3

Razavi

Organisational

communication skills

7

0

8

3

Rowe

Person‐directed

8

0

9

3

Schrijnemaekers

Organisational

emotion‐oriented care

7

1

10

5

Tsai

Person‐directed

5

1

6

4

von‐Baeyer

Person‐directed

8

1

9

0

West

Person‐directed

6

0

8

1

Yung

Person‐directed

10

0

9

2

Figuras y tablas -
Table 3. Study quality and intervention type
Table 4. Levels of evidence: Person‐directed interventions: Stress

Stress scale

HQ+

LQ+

HQ‐

LQ‐

HQinc

LQinc

Beck and Srivastava Stress Inventory

Jones

Perceived Stress Scale

Lee

Stress Assessment Inventory

Rowe 1999

Nursing Stress Checklist

Tsai

Job‐Related Tension Index

West

Figuras y tablas -
Table 4. Levels of evidence: Person‐directed interventions: Stress
Table 5. Levels of evidence: Person‐directed interventions: Maslach Burnout Inventory

MBI subscales

HQ+

LQ+

HQ‐

LQ‐

HQinc

LQinc

Emotional Exhaustion

Cohen‐Katz
Ewers
Norvell
Rowe
West

Bittman

Depersonalisation

Ewers
Rowe

Bittman
Cohen‐Katz
Norvell
West

Personal Accomplishment

Cohen‐Katz
Ewers
Rowe
West

Bittman
Norvell

Figuras y tablas -
Table 5. Levels of evidence: Person‐directed interventions: Maslach Burnout Inventory
Table 6. Levels of evidence: Person‐directed interventions: State Trait Anxiety Inventory

STAI facets

HQ+

LQ+

HQ‐

LQ‐

HQinc

LQinc

State

Jones
von Baeyer
West
Yung

Trait

Jones
von Baeyer
West

Yung

Figuras y tablas -
Table 6. Levels of evidence: Person‐directed interventions: State Trait Anxiety Inventory
Table 7. Levels of evidence: Person‐directed interventions: general symptoms

Scale

HQ+

LQ+

HQ‐

LQ‐

HQinc

LQinc

Brief Symptom Inventory

Cohen‐Katz

GHQ General Health Questionnaire

Jones

C‐H Inventory of Physical Symptoms

Norvell

Chinese GHQ

Tsai

Chinese GHQ

Yung

Figuras y tablas -
Table 7. Levels of evidence: Person‐directed interventions: general symptoms
Table 8. Levels of evidence: Work‐directed interventions: Stress

Stress scale

HQ+

LQ+

HQ‐

LQ‐

HQinc

LQinc

Nursing Stress Scale

Delvaux

Occupational Stress Indicator

Proctor

Figuras y tablas -
Table 8. Levels of evidence: Work‐directed interventions: Stress
Table 9. Levels of evidence: Work‐directed interventions: Maslach Burnout Inventory

MBI subscales

HQ+

LQ+

HQ‐

LQ‐

HQinc

LQinc

Emotional Exhaustion

Schrijnemaekers

Melchior

Depersonalisation

Schrijnemaekers

Melchior

Personal Accomplishment

Schrijnemaekers

Melchior

Figuras y tablas -
Table 9. Levels of evidence: Work‐directed interventions: Maslach Burnout Inventory
Table 10. Levels of evidence: Work‐directed interventions: general symptoms

Scale

HQ+

LQ+

HQ‐

LQ‐

HQinc

LQinc

Symptom Checklist‐90‐Revised

Heaney

GHQ General Health Questionnaire (somatic symptoms)

Proctor

Figuras y tablas -
Table 10. Levels of evidence: Work‐directed interventions: general symptoms
Comparison 1. Person‐directed intervention vs no intervention (Short Term)

Outcome or subgroup title

No. of studies

No. of participants

Statistical method

Effect size

1 Beck & Srivastava Stress Scale and Perceived Stress Scale Show forest plot

2

130

Std. Mean Difference (IV, Fixed, 95% CI)

‐0.85 [‐1.21, ‐0.49]

2 Maslach Burnout Inventory Show forest plot

3

Mean Difference (IV, Random, 95% CI)

Subtotals only

2.1 Emotional Exhaustion

3

129

Mean Difference (IV, Random, 95% CI)

‐5.82 [‐11.02, ‐0.63]

2.2 Depersonalization

3

129

Mean Difference (IV, Random, 95% CI)

‐2.44 [‐5.06, 0.17]

2.3 Personal Accomplishment (lack of)

3

129

Mean Difference (IV, Random, 95% CI)

‐4.89 [‐8.71, ‐1.07]

3 State Trait Anxiety Inventory Show forest plot

3

Mean Difference (IV, Random, 95% CI)

Subtotals only

3.1 State anxiety

3

135

Mean Difference (IV, Random, 95% CI)

‐9.42 [‐16.92, ‐1.93]

3.2 Trait anxiety

3

135

Mean Difference (IV, Random, 95% CI)

‐6.91 [‐12.80, ‐1.01]

4 General Health Questionnaire Show forest plot

2

127

Mean Difference (IV, Random, 95% CI)

‐11.87 [‐27.24, 3.49]

Figuras y tablas -
Comparison 1. Person‐directed intervention vs no intervention (Short Term)
Comparison 2. Person‐directed intervention vs no intervention (Medium and Long Term)

Outcome or subgroup title

No. of studies

No. of participants

Statistical method

Effect size

1 Maslach Burnout Inventory (at 2 years) Show forest plot

1

Mean Difference (IV, Random, 95% CI)

Subtotals only

1.1 Emotional Exhaustion

1

84

Mean Difference (IV, Random, 95% CI)

‐6.0 [‐8.16, ‐3.84]

1.2 Depersonalisation

1

84

Mean Difference (IV, Random, 95% CI)

‐0.62 [‐1.89, 0.65]

1.3 Personal Accomplishment (lack of)

1

84

Mean Difference (IV, Random, 95% CI)

‐5.82 [‐7.89, ‐3.75]

2 Stait Trait Anxiety Inventory (Jones at 3 months and Yung at 1 month) Show forest plot

2

Mean Difference (IV, Random, 95% CI)

Subtotals only

2.1 State anxiety

2

121

Mean Difference (IV, Random, 95% CI)

‐8.31 [‐11.49, ‐5.13]

2.2 Trait anxiety

2

121

Mean Difference (IV, Random, 95% CI)

‐4.09 [‐7.60, ‐0.58]

3 Perceived Stress Scale (at 1 month) Show forest plot

1

57

Mean Difference (IV, Fixed, 95% CI)

‐6.10 [‐8.44, ‐3.76]

4 General Health Questionnaire (at 1 month) Show forest plot

1

48

Mean Difference (IV, Fixed, 95% CI)

‐7.10 [‐10.58, ‐3.62]

Figuras y tablas -
Comparison 2. Person‐directed intervention vs no intervention (Medium and Long Term)
Comparison 3. Work‐directed intervention vs no intervention (Short Term)

Outcome or subgroup title

No. of studies

No. of participants

Statistical method

Effect size

1 Maslach Burnout Inventory Show forest plot

1

Mean Difference (IV, Random, 95% CI)

Subtotals only

1.1 Emotional Exhaustion

1

161

Mean Difference (IV, Random, 95% CI)

‐1.52 [‐3.61, 0.57]

1.2 Depersonalisation

1

161

Mean Difference (IV, Random, 95% CI)

‐1.14 [‐2.18, ‐0.10]

1.3 Personal Accomplishment (lack of)

1

161

Mean Difference (IV, Random, 95% CI)

0.07 [‐1.12, 1.26]

2 Nursing Stress Scale Show forest plot

1

115

Mean Difference (IV, Fixed, 95% CI)

‐0.34 [‐0.62, ‐0.06]

3 General symptoms Show forest plot

1

57

Mean Difference (IV, Fixed, 95% CI)

‐2.90 [‐5.16, ‐0.64]

Figuras y tablas -
Comparison 3. Work‐directed intervention vs no intervention (Short Term)
Comparison 4. Work‐directed intervention vs no intervention (Medium Term)

Outcome or subgroup title

No. of studies

No. of participants

Statistical method

Effect size

1 Nursing Stress Scale (at 6 months) Show forest plot

1

111

Mean Difference (IV, Fixed, 95% CI)

‐0.19 [‐0.49, 0.11]

Figuras y tablas -
Comparison 4. Work‐directed intervention vs no intervention (Medium Term)