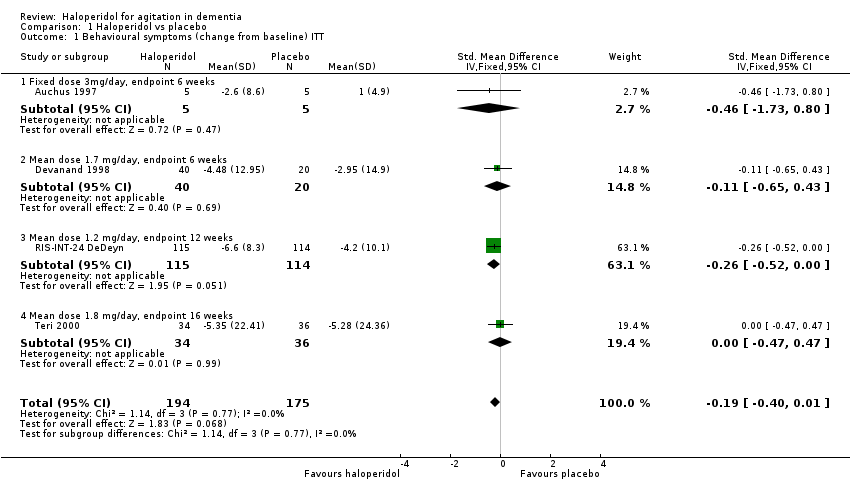
| 1 Behavioural symptoms (change from baseline) ITT Show forest plot | 4 | 369 | Std. Mean Difference (IV, Fixed, 95% CI) | ‐0.19 [‐0.40, 0.01] |
|
| 1.1 Fixed dose 3mg/day, endpoint 6 weeks | 1 | 10 | Std. Mean Difference (IV, Fixed, 95% CI) | ‐0.46 [‐1.73, 0.80] |
| 1.2 Mean dose 1.7 mg/day, endpoint 6 weeks | 1 | 60 | Std. Mean Difference (IV, Fixed, 95% CI) | ‐0.11 [‐0.65, 0.43] |
| 1.3 Mean dose 1.2 mg/day, endpoint 12 weeks | 1 | 229 | Std. Mean Difference (IV, Fixed, 95% CI) | ‐0.26 [‐0.52, 0.00] |
| 1.4 Mean dose 1.8 mg/day, endpoint 16 weeks | 1 | 70 | Std. Mean Difference (IV, Fixed, 95% CI) | ‐0.00 [‐0.47, 0.47] |
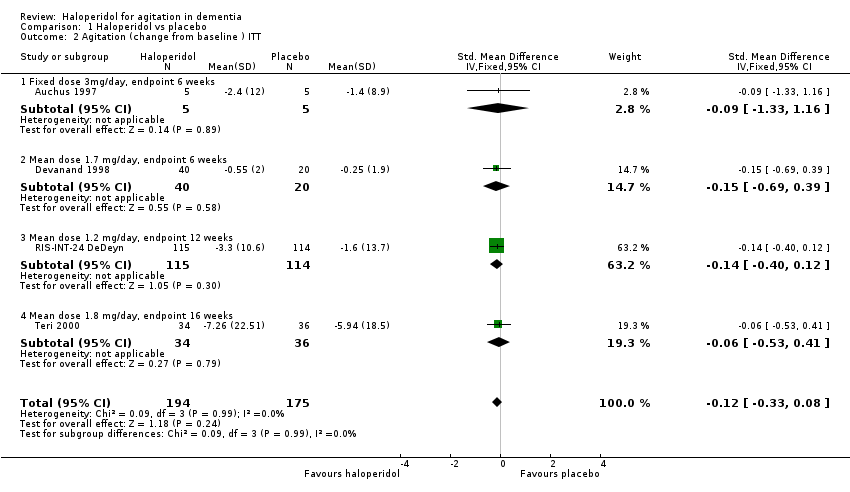
| 2 Agitation (change from baseline ) ITT Show forest plot | 4 | 369 | Std. Mean Difference (IV, Fixed, 95% CI) | ‐0.12 [‐0.33, 0.08] |
|
| 2.1 Fixed dose 3mg/day, endpoint 6 weeks | 1 | 10 | Std. Mean Difference (IV, Fixed, 95% CI) | ‐0.09 [‐1.33, 1.16] |
| 2.2 Mean dose 1.7 mg/day, endpoint 6 weeks | 1 | 60 | Std. Mean Difference (IV, Fixed, 95% CI) | ‐0.15 [‐0.69, 0.39] |
| 2.3 Mean dose 1.2 mg/day, endpoint 12 weeks | 1 | 229 | Std. Mean Difference (IV, Fixed, 95% CI) | ‐0.14 [‐0.40, 0.12] |
| 2.4 Mean dose 1.8 mg/day, endpoint 16 weeks | 1 | 70 | Std. Mean Difference (IV, Fixed, 95% CI) | ‐0.06 [‐0.53, 0.41] |
| 3 Aggression (change from baseline ) ITT Show forest plot | 3 | 489 | Std. Mean Difference (IV, Fixed, 95% CI) | ‐0.31 [‐0.49, ‐0.13] |
|
| 3.1 Mean dose 3.53 mg/day, endpoint 3 weeks | 1 | 200 | Std. Mean Difference (IV, Fixed, 95% CI) | ‐0.39 [‐0.67, ‐0.11] |
| 3.2 Mean dose 1.7 mg/day, endpoint 6 weeks | 1 | 60 | Std. Mean Difference (IV, Fixed, 95% CI) | ‐0.14 [‐0.68, 0.40] |
| 3.3 Mean dose 1.2 mg/day, endpoint 12 weeks | 1 | 229 | Std. Mean Difference (IV, Fixed, 95% CI) | ‐0.29 [‐0.55, ‐0.03] |
| 4 CGIC (improvement ) ITT Show forest plot | 2 | 274 | Peto Odds Ratio (Peto, Fixed, 95% CI) | 1.50 [0.88, 2.55] |
|
| 4.1 Mean dose 3.53 mg/day, endpoint 3 weeks | 1 | 204 | Peto Odds Ratio (Peto, Fixed, 95% CI) | 1.70 [0.91, 3.18] |
| 4.2 Mean dose 1.8 mg/day, endpoint 16 weeks | 1 | 70 | Peto Odds Ratio (Peto, Fixed, 95% CI) | 1.09 [0.40, 2.96] |
| 5 Caregiver burden (change from baseline ) ITT Show forest plot | 1 | 70 | Mean Difference (IV, Fixed, 95% CI) | 0.81 [‐0.89, 2.51] |
|
| 5.1 Mean dose 1.8 mg/day, endpoint 16 weeks | 1 | 70 | Mean Difference (IV, Fixed, 95% CI) | 0.81 [‐0.89, 2.51] |
| 6 Activities of daily living (change from baseline ) ITT Show forest plot | 1 | | Mean Difference (IV, Fixed, 95% CI) | Subtotals only |
|
| 6.1 Physical activities of daily living, mean dose 1.8 mg/day, endpoint 16 weeks | 1 | 70 | Mean Difference (IV, Fixed, 95% CI) | 1.19 [‐0.38, 2.76] |
| 6.2 Instrumental activities of daily living, mean dose 1.8 mg/day, endpoint 16 weeks | 1 | 70 | Mean Difference (IV, Fixed, 95% CI) | 0.91 [‐0.59, 2.41] |
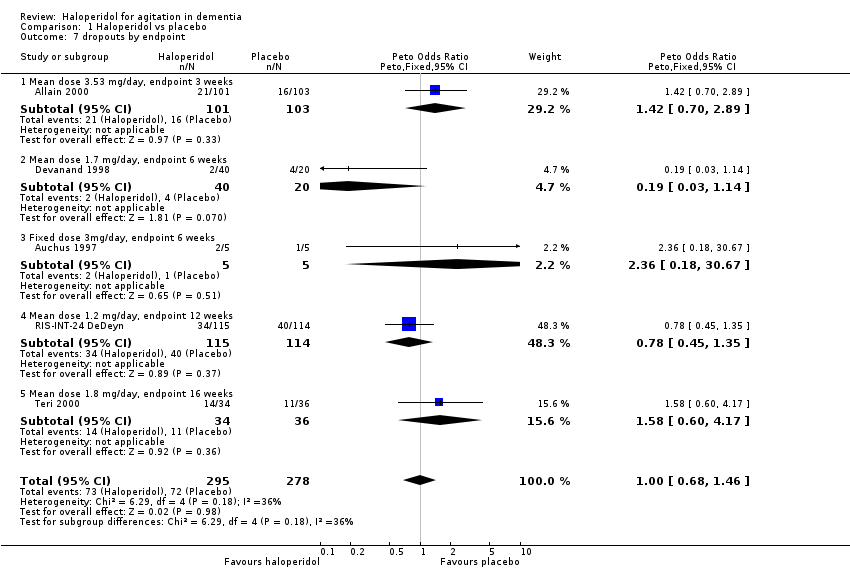
| 7 dropouts by endpoint Show forest plot | 5 | 573 | Peto Odds Ratio (Peto, Fixed, 95% CI) | 1.00 [0.68, 1.46] |
|
| 7.1 Mean dose 3.53 mg/day, endpoint 3 weeks | 1 | 204 | Peto Odds Ratio (Peto, Fixed, 95% CI) | 1.42 [0.70, 2.89] |
| 7.2 Mean dose 1.7 mg/day, endpoint 6 weeks | 1 | 60 | Peto Odds Ratio (Peto, Fixed, 95% CI) | 0.19 [0.03, 1.14] |
| 7.3 Fixed dose 3mg/day, endpoint 6 weeks | 1 | 10 | Peto Odds Ratio (Peto, Fixed, 95% CI) | 2.36 [0.18, 30.67] |
| 7.4 Mean dose 1.2 mg/day, endpoint 12 weeks | 1 | 229 | Peto Odds Ratio (Peto, Fixed, 95% CI) | 0.78 [0.45, 1.35] |
| 7.5 Mean dose 1.8 mg/day, endpoint 16 weeks | 1 | 70 | Peto Odds Ratio (Peto, Fixed, 95% CI) | 1.58 [0.60, 4.17] |
| 8 dropouts due to adverse events Show forest plot | 2 | 274 | Peto Odds Ratio (Peto, Fixed, 95% CI) | 2.52 [1.22, 5.21] |
|
| 8.1 Mean dose 3.53 mg/day, endpoint 3 weeks | 1 | 204 | Peto Odds Ratio (Peto, Fixed, 95% CI) | 2.99 [1.26, 7.10] |
| 8.2 Mean dose 1.8 mg/day, endpoint 16 weeks | 1 | 70 | Peto Odds Ratio (Peto, Fixed, 95% CI) | 1.69 [0.45, 6.40] |
| 9 Number suffering at least one adverse event by endpoint Show forest plot | 2 | 433 | Peto Odds Ratio (Peto, Fixed, 95% CI) | 1.53 [1.00, 2.35] |
|
| 9.1 Mean dose 3.53 mg/day, endpoint 3 weeks | 1 | 204 | Peto Odds Ratio (Peto, Fixed, 95% CI) | 1.57 [0.86, 2.88] |
| 9.2 Mean dose 1.2 mg/day, endpoint 12 weeks | 1 | 229 | Peto Odds Ratio (Peto, Fixed, 95% CI) | 1.49 [0.81, 2.74] |
| 10 Number suffering an adverse event (broken down by type) by endpoint Show forest plot | 3 | | Peto Odds Ratio (Peto, Fixed, 95% CI) | Subtotals only |
|
| 10.1 Extrapyramidal symptom (mean dose 3.5mg/day, endpoint 3 weeks) | 1 | 204 | Peto Odds Ratio (Peto, Fixed, 95% CI) | 2.34 [1.25, 4.38] |
| 10.2 Endocrine symptom (mean dose 3.5mg/day, endpoint 3 weeks) | 1 | 204 | Peto Odds Ratio (Peto, Fixed, 95% CI) | 0.75 [0.25, 2.22] |
| 10.3 Somnolence (Mean dose 1.2mg/day, endpoint 12 weeks) | 1 | 229 | Peto Odds Ratio (Peto, Fixed, 95% CI) | 4.20 [1.78, 9.91] |
| 10.4 Drooling (mean dose 1.8 mg/day, endpoint 16 weeks) | 1 | 70 | Peto Odds Ratio (Peto, Fixed, 95% CI) | 8.08 [0.49, 131.94] |
| 10.5 Parkinsonian gait (mean dose 1.8 mg/day, endpoint 16 weeks) | 1 | 70 | Peto Odds Ratio (Peto, Fixed, 95% CI) | 2.68 [0.71, 10.14] |
| 10.6 Dry mouth (mean dose 1.8 mg/day, endpoint 16 weeks) | 1 | 70 | Peto Odds Ratio (Peto, Fixed, 95% CI) | 2.17 [0.68, 6.95] |
| 10.7 Dizziness (mean dose 1.8 mg/day, endpoint 16 weeks) | 1 | 70 | Peto Odds Ratio (Peto, Fixed, 95% CI) | 0.69 [0.11, 4.23] |
| 10.8 Akathesia (mean dose 1.8 mg/day, endpoint 16 weeks) | 1 | 70 | Peto Odds Ratio (Peto, Fixed, 95% CI) | 1.07 [0.25, 4.60] |
| 10.9 Rigidity (mean dose 1.8 mg/day, endpoint 16 weeks) | 1 | 70 | Peto Odds Ratio (Peto, Fixed, 95% CI) | 2.81 [0.93, 8.50] |
| 10.10 Dyskinesia (mean dose 1.8 mg/day, endpoint 16 weeks) | 1 | 70 | Peto Odds Ratio (Peto, Fixed, 95% CI) | 0.42 [0.09, 1.96] |
| 10.11 Drowsiness (mean dose 1.8 mg/day, endpoint 16 weeks) | 1 | 70 | Peto Odds Ratio (Peto, Fixed, 95% CI) | 2.48 [0.80, 7.71] |
| 10.12 Bradykinesia (mean dose 1.8 mg/day, endpoint 16 weeks) | 1 | 70 | Peto Odds Ratio (Peto, Fixed, 95% CI) | 1.95 [0.67, 5.65] |
| 10.13 Tremor (mean dose 1.8 mg/day, endpoint 16 weeks) | 1 | 70 | Peto Odds Ratio (Peto, Fixed, 95% CI) | 2.17 [0.68, 6.95] |
| 10.14 Fatigue (mean dose 1.8 mg/day, endpoint 16 weeks) | 1 | 70 | Peto Odds Ratio (Peto, Fixed, 95% CI) | 5.39 [2.04, 14.22] |