Asesoramiento telefónico para el abandono del hábito de fumar
Información
- DOI:
- https://doi.org/10.1002/14651858.CD002850.pub3Copiar DOI

- Base de datos:
-
- Cochrane Database of Systematic Reviews
- Versión publicada:
-
- 12 agosto 2013see what's new
- Tipo:
-
- Intervention
- Etapa:
-
- Review
- Grupo Editorial Cochrane:
-
Grupo Cochrane de Tabaquismo
- Copyright:
-
- Copyright © 2013 The Cochrane Collaboration. Published by John Wiley & Sons, Ltd.
Cifras del artículo
Altmetric:
Citado por:
Autores
Contributions of authors
LS and TL contributed to developing the protocol, extracting data and writing the review. RP became an author from issue 1 2003 and extracted data, assisted with the meta‐regression. and contributed to updating the text. JH‐B became an author from 2013 and contributed to extracting data and updating the text.
Sources of support
Internal sources
-
National Institute for Health Research (NIHR) School for Primary Care Research, UK.
-
Department of Primary Care Health Sciences, University of Oxford, UK.
External sources
-
NHS Research & Development Programme, UK.
Declarations of interest
None known
Acknowledgements
Elaine Harkness assisted with data extraction in the first version of this review. Hitomi Kobayashi translated a paper from Japanese. We would like to acknowledge the helpful suggestions of Ed Lichtenstein and Corinne Husten on both the original version of the review and the update in 2006. Additional data were provided by Vance Rabius and Jennifer McClure, and other authors confirmed or clarified data. Data from Flöter 2009 were extracted by Carole Clair.
Version history
| Published | Title | Stage | Authors | Version |
| 2019 May 02 | Telephone counselling for smoking cessation | Review | William Matkin, José M. Ordóñez‐Mena, Jamie Hartmann‐Boyce | |
| 2013 Aug 12 | Telephone counselling for smoking cessation | Review | Lindsay F Stead, Jamie Hartmann‐Boyce, Rafael Perera, Tim Lancaster | |
| 2006 Jul 19 | Telephone counselling for smoking cessation | Review | Lindsay F Stead, Rafael Perera, Tim Lancaster | |
| 2003 Jan 20 | Telephone counselling for smoking cessation | Review | Lindsay F Stead, Tim Lancaster, Rafael Perera | |
Keywords
MeSH
Medical Subject Headings (MeSH) Keywords
Medical Subject Headings Check Words
Adult; Female; Humans; Male; Middle Aged; Pregnancy;
PICO

Methodological quality summary: review authors' judgements about each methodological quality item for each included study.
Comparison 3. Interventions for callers to quitlines. Cessation at longest follow‐up
Comparison 4. Interventions for smokers not calling quitlines ‐ subgroups by baseline support. Cessation at longest follow‐up

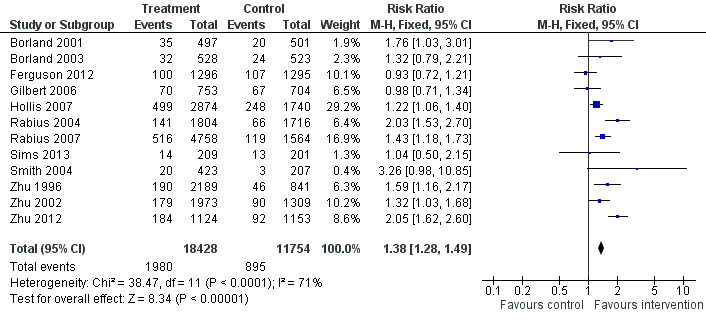
Comparison 1 Interventions for callers to quitlines ‐ effect of additional proactive calls, Outcome 1 Cessation at longest follow‐up.
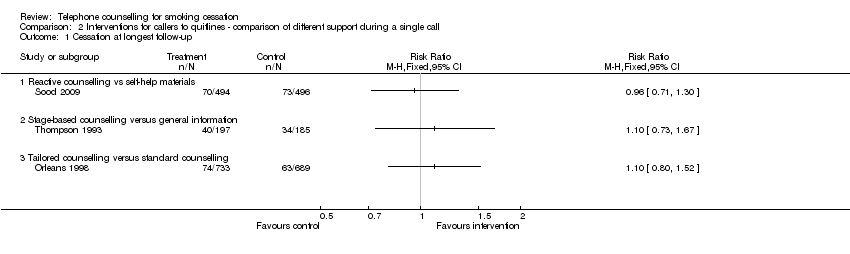
Comparison 2 Interventions for callers to quitlines ‐ comparison of different support during a single call, Outcome 1 Cessation at longest follow‐up.
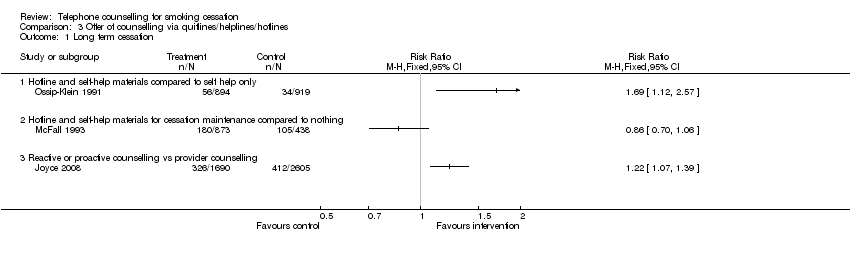
Comparison 3 Offer of counselling via quitlines/helplines/hotlines, Outcome 1 Long term cessation.
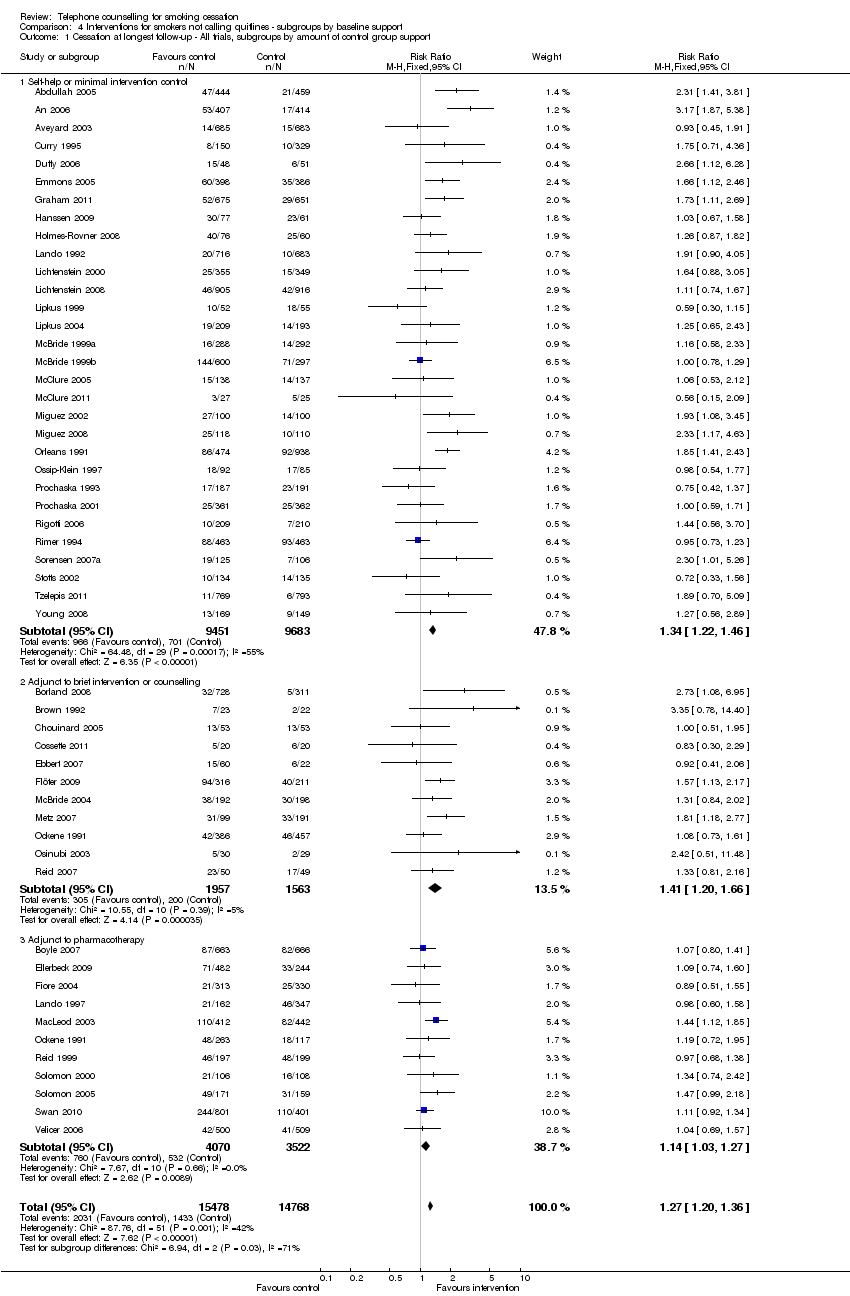
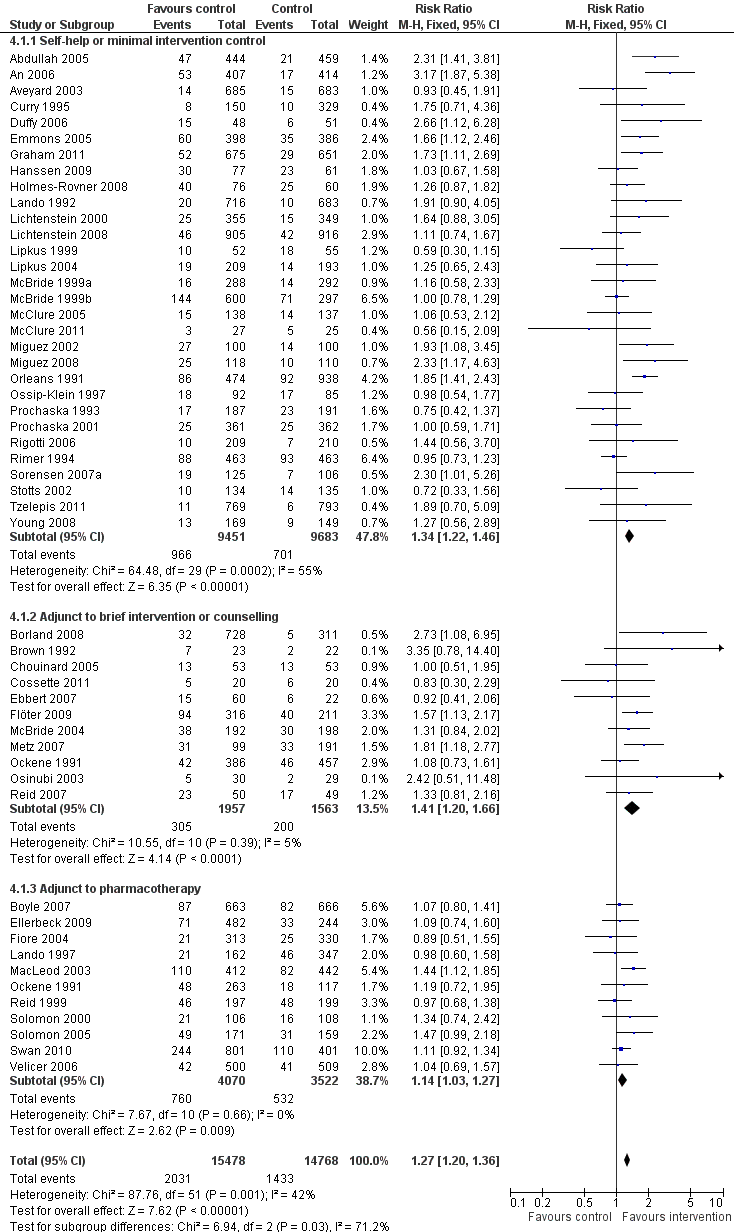
Comparison 4 Interventions for smokers not calling quitlines ‐ subgroups by baseline support, Outcome 1 Cessation at longest follow‐up ‐ All trials, subgroups by amount of control group support.
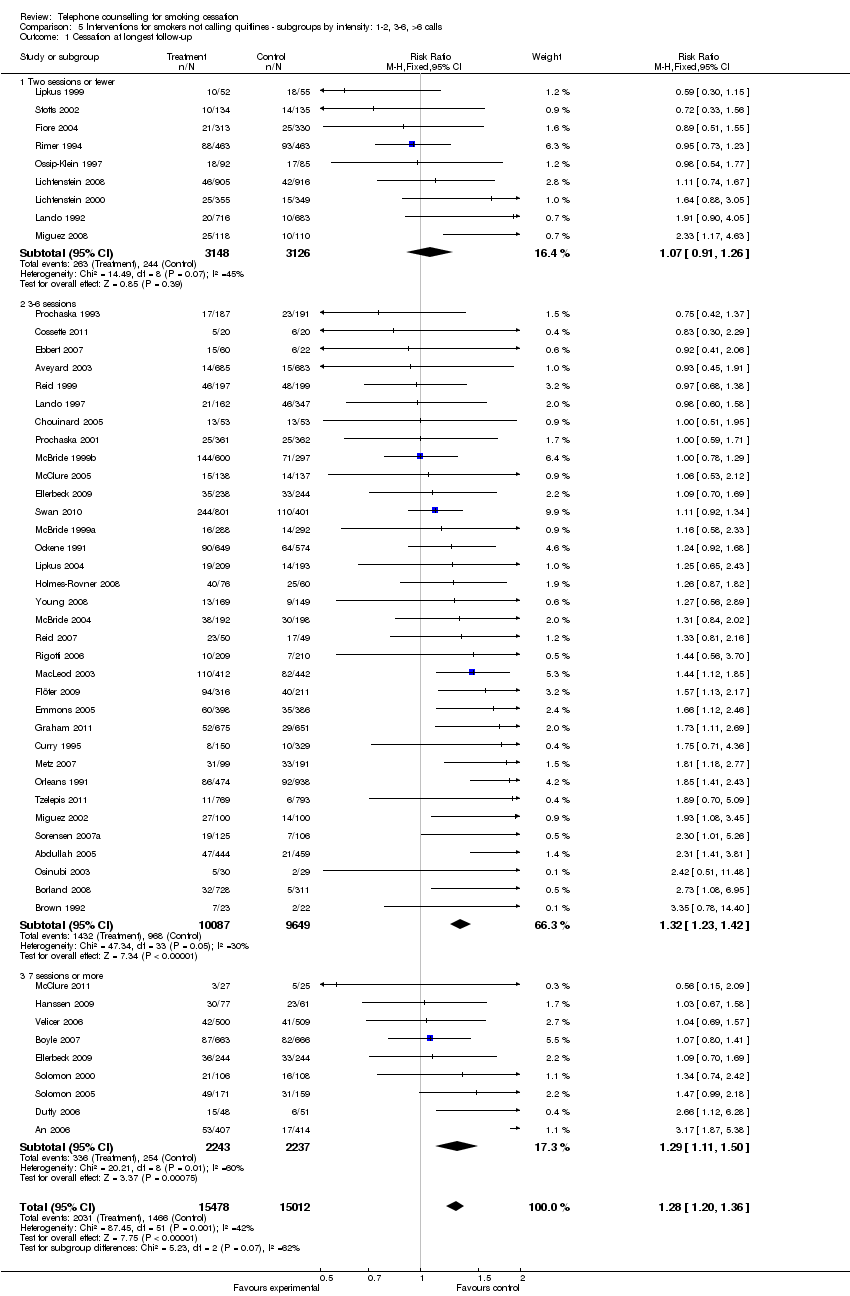
Comparison 5 Interventions for smokers not calling quitlines ‐ subgroups by intensity: 1‐2, 3‐6, >6 calls, Outcome 1 Cessation at longest follow‐up.
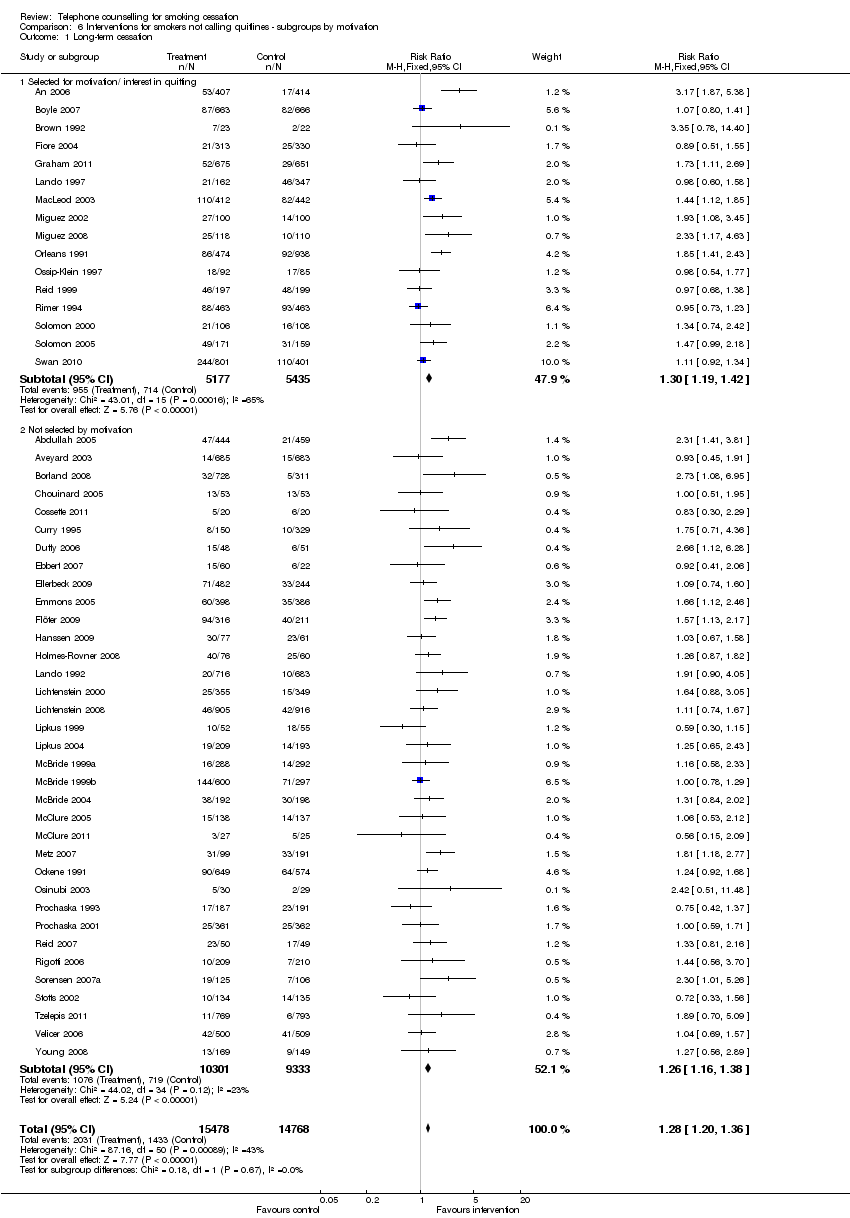
Comparison 6 Interventions for smokers not calling quitlines ‐ subgroups by motivation, Outcome 1 Long‐term cessation.
| Interventions for callers to quitlines ‐ effect of additional proactive calls for smoking cessation | ||||||
| Patient or population: callers to quitlines | ||||||
| Outcomes | Illustrative comparative risks* (95% CI) | Relative effect | No of Participants | Quality of the evidence | Comments | |
| Assumed risk | Corresponding risk | |||||
| Control | Additional proactive calls | |||||
| Smoking cessation | Study population | RR 1.38 | 30182 | ⊕⊕⊕⊝ | ||
| 76 per 10001 | 105 per 1000 | |||||
| Low | ||||||
| 50 per 10001 | 69 per 1000 | |||||
| High | ||||||
| 150 per 10001 | 207 per 1000 | |||||
| *The basis for the assumed risk (e.g. the median control group risk across studies) is provided in footnotes. The corresponding risk (and its 95% confidence interval) is based on the assumed risk in the comparison group and the relative effect of the intervention (and its 95% CI). | ||||||
| GRADE Working Group grades of evidence | ||||||
| 1 Low control rate reflects lower end of range evident in trials; 4/12 had control rates < 5%. High control rate likely to be applicable for people also using pharmacotherapy | ||||||
| Proactive telephone counselling for smokers not calling quitlines | ||||||
| Patient or population: smokers not calling quitlines | ||||||
| Outcomes | Illustrative comparative risks* (95% CI) | Relative effect | No of Participants | Quality of the evidence | Comments | |
| Assumed risk | Corresponding risk | |||||
| Control | Proactive telephone counselling | |||||
| Cessation at longest follow‐up ‐ All trials, subgroups by amount of control group support | 97 per 10001 | 123 per 1000 | RR 1.27 | 30246 | ⊕⊕⊕⊝ | |
| *The basis for the assumed risk (e.g. the median control group risk across studies) is provided in footnotes. The corresponding risk (and its 95% confidence interval) is based on the assumed risk in the comparison group and the relative effect of the intervention (and its 95% CI). | ||||||
| GRADE Working Group grades of evidence | ||||||
| 1 Based on crude average of events/total, with participants lost to follow‐up assumed to be smoking. Interquartile range in trials 6‐20%. Higher baseline cessation rates typical amongst motivated populations receiving pharmacotherapy and some support Relative addtional benefit of telephone intervention may be smaller in this setting. | ||||||
| Outcome or subgroup title | No. of studies | No. of participants | Statistical method | Effect size |
| 1 Cessation at longest follow‐up Show forest plot | 12 | 30182 | Risk Ratio (M‐H, Fixed, 95% CI) | 1.38 [1.28, 1.49] |
| Outcome or subgroup title | No. of studies | No. of participants | Statistical method | Effect size |
| 1 Cessation at longest follow‐up Show forest plot | 3 | Risk Ratio (M‐H, Fixed, 95% CI) | Totals not selected | |
| 1.1 Reactive counselling vs self‐help materials | 1 | Risk Ratio (M‐H, Fixed, 95% CI) | 0.0 [0.0, 0.0] | |
| 1.2 Stage‐based counselling versus general information | 1 | Risk Ratio (M‐H, Fixed, 95% CI) | 0.0 [0.0, 0.0] | |
| 1.3 Tailored counselling versus standard counselling | 1 | Risk Ratio (M‐H, Fixed, 95% CI) | 0.0 [0.0, 0.0] | |
| Outcome or subgroup title | No. of studies | No. of participants | Statistical method | Effect size |
| 1 Long term cessation Show forest plot | 3 | Risk Ratio (M‐H, Fixed, 95% CI) | Totals not selected | |
| 1.1 Hotline and self‐help materials compared to self help only | 1 | Risk Ratio (M‐H, Fixed, 95% CI) | 0.0 [0.0, 0.0] | |
| 1.2 Hotline and self‐help materials for cessation maintenance compared to nothing | 1 | Risk Ratio (M‐H, Fixed, 95% CI) | 0.0 [0.0, 0.0] | |
| 1.3 Reactive or proactive counselling vs provider counselling | 1 | Risk Ratio (M‐H, Fixed, 95% CI) | 0.0 [0.0, 0.0] | |
| Outcome or subgroup title | No. of studies | No. of participants | Statistical method | Effect size |
| 1 Cessation at longest follow‐up ‐ All trials, subgroups by amount of control group support Show forest plot | 51 | 30246 | Risk Ratio (M‐H, Fixed, 95% CI) | 1.27 [1.20, 1.36] |
| 1.1 Self‐help or minimal intervention control | 30 | 19134 | Risk Ratio (M‐H, Fixed, 95% CI) | 1.34 [1.22, 1.46] |
| 1.2 Adjunct to brief intervention or counselling | 11 | 3520 | Risk Ratio (M‐H, Fixed, 95% CI) | 1.41 [1.20, 1.66] |
| 1.3 Adjunct to pharmacotherapy | 11 | 7592 | Risk Ratio (M‐H, Fixed, 95% CI) | 1.14 [1.03, 1.27] |
| Outcome or subgroup title | No. of studies | No. of participants | Statistical method | Effect size |
| 1 Cessation at longest follow‐up Show forest plot | 51 | 30490 | Risk Ratio (M‐H, Fixed, 95% CI) | 1.28 [1.20, 1.36] |
| 1.1 Two sessions or fewer | 9 | 6274 | Risk Ratio (M‐H, Fixed, 95% CI) | 1.07 [0.91, 1.26] |
| 1.2 3‐6 sessions | 34 | 19736 | Risk Ratio (M‐H, Fixed, 95% CI) | 1.32 [1.23, 1.42] |
| 1.3 7 sessions or more | 9 | 4480 | Risk Ratio (M‐H, Fixed, 95% CI) | 1.29 [1.11, 1.50] |
| Outcome or subgroup title | No. of studies | No. of participants | Statistical method | Effect size |
| 1 Long‐term cessation Show forest plot | 51 | 30246 | Risk Ratio (M‐H, Fixed, 95% CI) | 1.28 [1.20, 1.36] |
| 1.1 Selected for motivation/ interest in quitting | 16 | 10612 | Risk Ratio (M‐H, Fixed, 95% CI) | 1.30 [1.19, 1.42] |
| 1.2 Not selected by motivation | 35 | 19634 | Risk Ratio (M‐H, Fixed, 95% CI) | 1.26 [1.16, 1.38] |