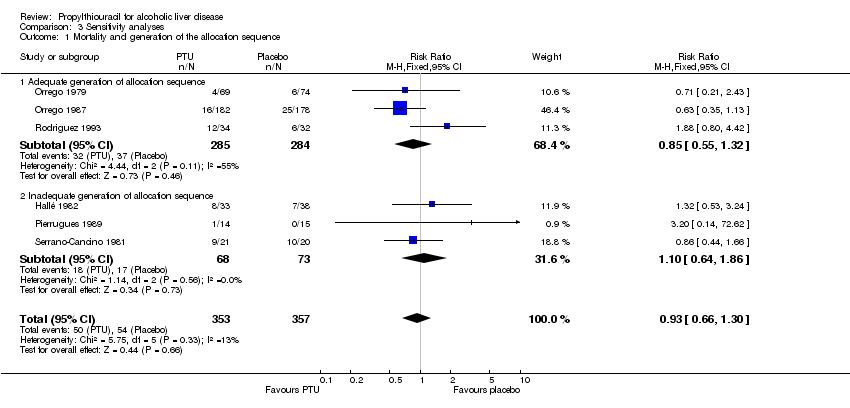
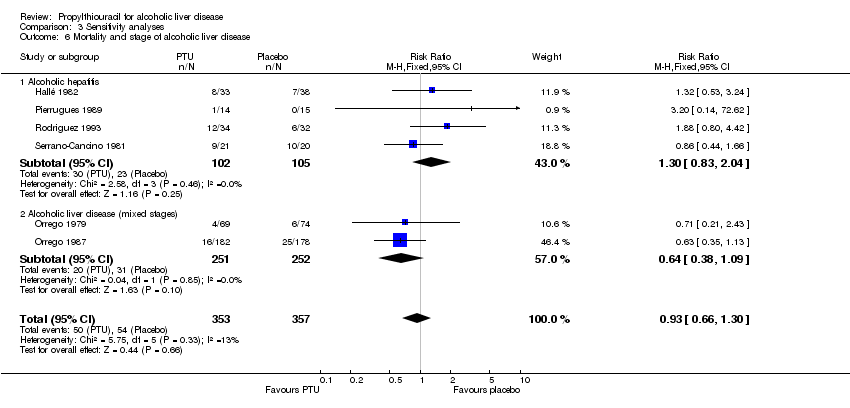
Scolaris Content Display Scolaris Content Display

Comparison 1 PTU versus placebo, Outcome 1 Mortality.
Figuras y tablas -
Analysis 1.1

Comparison 1 PTU versus placebo, Outcome 1 Mortality.

Comparison 1 PTU versus placebo, Outcome 2 Liver‐related mortality.
Figuras y tablas -
Analysis 1.2

Comparison 1 PTU versus placebo, Outcome 2 Liver‐related mortality.

Comparison 1 PTU versus placebo, Outcome 3 Variceal bleeding.
Figuras y tablas -
Analysis 1.3

Comparison 1 PTU versus placebo, Outcome 3 Variceal bleeding.

Comparison 1 PTU versus placebo, Outcome 4 Hepatic encephalopathy.
Figuras y tablas -
Analysis 1.4

Comparison 1 PTU versus placebo, Outcome 4 Hepatic encephalopathy.

Comparison 1 PTU versus placebo, Outcome 5 Total number of complications.
Figuras y tablas -
Analysis 1.5

Comparison 1 PTU versus placebo, Outcome 5 Total number of complications.

Comparison 1 PTU versus placebo, Outcome 6 Improvement of composite clinical and laboratory index.
Figuras y tablas -
Analysis 1.6

Comparison 1 PTU versus placebo, Outcome 6 Improvement of composite clinical and laboratory index.

Comparison 1 PTU versus placebo, Outcome 7 Composite clinical and laboratory index.
Figuras y tablas -
Analysis 1.7

Comparison 1 PTU versus placebo, Outcome 7 Composite clinical and laboratory index.

Comparison 1 PTU versus placebo, Outcome 8 Composite clinical and laboratory index.
Figuras y tablas -
Analysis 1.8

Comparison 1 PTU versus placebo, Outcome 8 Composite clinical and laboratory index.

Comparison 1 PTU versus placebo, Outcome 9 S‐bilirubin (mg/dl).
Figuras y tablas -
Analysis 1.9

Comparison 1 PTU versus placebo, Outcome 9 S‐bilirubin (mg/dl).

Comparison 1 PTU versus placebo, Outcome 10 S‐aspartate aminotransferase (U/I).
Figuras y tablas -
Analysis 1.10

Comparison 1 PTU versus placebo, Outcome 10 S‐aspartate aminotransferase (U/I).

Comparison 1 PTU versus placebo, Outcome 11 S‐alanine aminotransferase (U/I).
Figuras y tablas -
Analysis 1.11

Comparison 1 PTU versus placebo, Outcome 11 S‐alanine aminotransferase (U/I).

Comparison 1 PTU versus placebo, Outcome 12 Prothrombin time (%).
Figuras y tablas -
Analysis 1.12

Comparison 1 PTU versus placebo, Outcome 12 Prothrombin time (%).

Comparison 1 PTU versus placebo, Outcome 13 S‐albumin (g/dl).
Figuras y tablas -
Analysis 1.13

Comparison 1 PTU versus placebo, Outcome 13 S‐albumin (g/dl).

Comparison 1 PTU versus placebo, Outcome 14 Liver histology (disappearance of Mallory bodies).
Figuras y tablas -
Analysis 1.14

Comparison 1 PTU versus placebo, Outcome 14 Liver histology (disappearance of Mallory bodies).

Comparison 1 PTU versus placebo, Outcome 15 Liver histology (steatosis).
Figuras y tablas -
Analysis 1.15

Comparison 1 PTU versus placebo, Outcome 15 Liver histology (steatosis).

Comparison 1 PTU versus placebo, Outcome 16 Liver histology (cholestasis).
Figuras y tablas -
Analysis 1.16

Comparison 1 PTU versus placebo, Outcome 16 Liver histology (cholestasis).

Comparison 1 PTU versus placebo, Outcome 17 Liver histology (hepatitis).
Figuras y tablas -
Analysis 1.17

Comparison 1 PTU versus placebo, Outcome 17 Liver histology (hepatitis).

Comparison 1 PTU versus placebo, Outcome 18 Liver histology (hyaline necrosis).
Figuras y tablas -
Analysis 1.18

Comparison 1 PTU versus placebo, Outcome 18 Liver histology (hyaline necrosis).

Comparison 2 Adverse events, Outcome 1 Adverse events.
Figuras y tablas -
Analysis 2.1

Comparison 2 Adverse events, Outcome 1 Adverse events.

Comparison 2 Adverse events, Outcome 2 Serious adverse events.
Figuras y tablas -
Analysis 2.2

Comparison 2 Adverse events, Outcome 2 Serious adverse events.

Comparison 2 Adverse events, Outcome 3 Non‐serious adverse events.
Figuras y tablas -
Analysis 2.3

Comparison 2 Adverse events, Outcome 3 Non‐serious adverse events.

Comparison 3 Sensitivity analyses, Outcome 1 Mortality and generation of the allocation sequence.
Figuras y tablas -
Analysis 3.1

Comparison 3 Sensitivity analyses, Outcome 1 Mortality and generation of the allocation sequence.

Comparison 3 Sensitivity analyses, Outcome 2 Mortality and allocation concealment.
Figuras y tablas -
Analysis 3.2

Comparison 3 Sensitivity analyses, Outcome 2 Mortality and allocation concealment.

Comparison 3 Sensitivity analyses, Outcome 3 Mortality and blinding.
Figuras y tablas -
Analysis 3.3

Comparison 3 Sensitivity analyses, Outcome 3 Mortality and blinding.

Comparison 3 Sensitivity analyses, Outcome 4 Mortality and follow‐up.
Figuras y tablas -
Analysis 3.4

Comparison 3 Sensitivity analyses, Outcome 4 Mortality and follow‐up.

Comparison 3 Sensitivity analyses, Outcome 5 Mortality and duration of treatment.
Figuras y tablas -
Analysis 3.5

Comparison 3 Sensitivity analyses, Outcome 5 Mortality and duration of treatment.

Comparison 3 Sensitivity analyses, Outcome 6 Mortality and stage of alcoholic liver disease.
Figuras y tablas -
Analysis 3.6

Comparison 3 Sensitivity analyses, Outcome 6 Mortality and stage of alcoholic liver disease.

Comparison 3 Sensitivity analyses, Outcome 7 Mortality and worst case scenario.
Figuras y tablas -
Analysis 3.7

Comparison 3 Sensitivity analyses, Outcome 7 Mortality and worst case scenario.

Comparison 3 Sensitivity analyses, Outcome 8 Mortality and per protocol analysis.
Figuras y tablas -
Analysis 3.8

Comparison 3 Sensitivity analyses, Outcome 8 Mortality and per protocol analysis.

Comparison 1. PTU versus placebo

Outcome or subgroup title

No. of studies

No. of participants

Statistical method

Effect size

1 Mortality Show forest plot

6

710

Risk Ratio (M‐H, Fixed, 95% CI)

0.93 [0.66, 1.30]

2 Liver‐related mortality Show forest plot

4

640

Risk Ratio (M‐H, Fixed, 95% CI)

0.80 [0.50, 1.29]

3 Variceal bleeding Show forest plot

4

640

Risk Ratio (M‐H, Fixed, 95% CI)

1.48 [0.63, 3.46]

4 Hepatic encephalopathy Show forest plot

3

574

Risk Ratio (M‐H, Fixed, 95% CI)

0.84 [0.38, 1.83]

5 Total number of complications Show forest plot

4

640

Risk Ratio (M‐H, Fixed, 95% CI)

1.06 [0.78, 1.44]

6 Improvement of composite clinical and laboratory index Show forest plot

1

29

Mean Difference (IV, Fixed, 95% CI)

1.0 [‐2.65, 4.65]

7 Composite clinical and laboratory index Show forest plot

1

133

Mean Difference (IV, Fixed, 95% CI)

1.82 [1.23, 2.42]

7.1 Change in score of patients with initial index 0‐13

1

81

Mean Difference (IV, Fixed, 95% CI)

0.90 [‐0.21, 2.01]

7.2 Change in score of patients with initial index 14‐26

1

52

Mean Difference (IV, Fixed, 95% CI)

2.2 [1.49, 2.91]

8 Composite clinical and laboratory index Show forest plot

1

359

Mean Difference (IV, Fixed, 95% CI)

0.73 [0.04, 1.42]

8.1 Patients who completed the trial (change)

1

116

Mean Difference (IV, Fixed, 95% CI)

1.90 [0.37, 3.43]

8.2 Patients who dropped out the trial (change)

1

194

Mean Difference (IV, Fixed, 95% CI)

0.5 [‐0.33, 1.33]

8.3 Patients who were not compliant to the trial (change)

1

49

Mean Difference (IV, Fixed, 95% CI)

0.0 [‐2.08, 2.08]

9 S‐bilirubin (mg/dl) Show forest plot

1

71

Mean Difference (IV, Fixed, 95% CI)

0.5 [‐0.57, 1.57]

10 S‐aspartate aminotransferase (U/I) Show forest plot

1

71

Mean Difference (IV, Fixed, 95% CI)

5.0 [‐1.94, 11.94]

11 S‐alanine aminotransferase (U/I) Show forest plot

1

71

Mean Difference (IV, Fixed, 95% CI)

0.0 [‐13.85, 13.85]

12 Prothrombin time (%) Show forest plot

1

71

Mean Difference (IV, Fixed, 95% CI)

‐4.0 [‐23.40, 15.40]

13 S‐albumin (g/dl) Show forest plot

1

71

Mean Difference (IV, Fixed, 95% CI)

0.11 [‐1.28, 1.50]

14 Liver histology (disappearance of Mallory bodies) Show forest plot

1

29

Risk Ratio (M‐H, Fixed, 95% CI)

1.07 [0.26, 4.45]

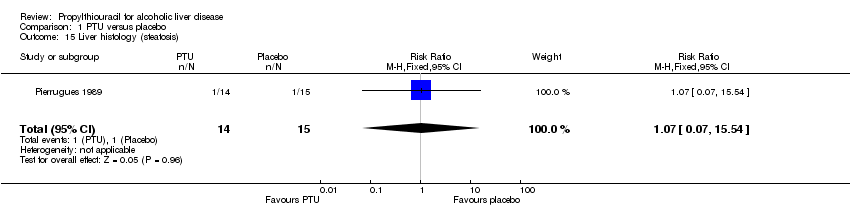
15 Liver histology (steatosis) Show forest plot

1

29

Risk Ratio (M‐H, Fixed, 95% CI)

1.07 [0.07, 15.54]

16 Liver histology (cholestasis) Show forest plot

1

42

Risk Ratio (M‐H, Fixed, 95% CI)

1.89 [0.87, 4.09]

17 Liver histology (hepatitis) Show forest plot

1

42

Risk Ratio (M‐H, Fixed, 95% CI)

1.24 [0.96, 1.59]

18 Liver histology (hyaline necrosis) Show forest plot

1

42

Risk Ratio (M‐H, Fixed, 95% CI)

1.08 [0.79, 1.48]

Figuras y tablas -
Comparison 1. PTU versus placebo
Comparison 2. Adverse events

Outcome or subgroup title

No. of studies

No. of participants

Statistical method

Effect size

1 Adverse events Show forest plot

5

681

Risk Ratio (M‐H, Fixed, 95% CI)

1.61 [0.84, 3.08]

2 Serious adverse events Show forest plot

5

681

Risk Ratio (M‐H, Fixed, 95% CI)

5.36 [0.26, 109.65]

3 Non‐serious adverse events Show forest plot

5

681

Risk Ratio (M‐H, Fixed, 95% CI)

1.46 [0.75, 2.83]

Figuras y tablas -
Comparison 2. Adverse events
Comparison 3. Sensitivity analyses

Outcome or subgroup title

No. of studies

No. of participants

Statistical method

Effect size

1 Mortality and generation of the allocation sequence Show forest plot

6

710

Risk Ratio (M‐H, Fixed, 95% CI)

0.93 [0.66, 1.30]

1.1 Adequate generation of allocation sequence

3

569

Risk Ratio (M‐H, Fixed, 95% CI)

0.85 [0.55, 1.32]

1.2 Inadequate generation of allocation sequence

3

141

Risk Ratio (M‐H, Fixed, 95% CI)

1.10 [0.64, 1.86]

2 Mortality and allocation concealment Show forest plot

6

710

Risk Ratio (M‐H, Fixed, 95% CI)

0.93 [0.66, 1.30]

2.1 Adequate allocation concealment

0

0

Risk Ratio (M‐H, Fixed, 95% CI)

0.0 [0.0, 0.0]

2.2 Inadequate allocation concealment

6

710

Risk Ratio (M‐H, Fixed, 95% CI)

0.93 [0.66, 1.30]

3 Mortality and blinding Show forest plot

6

710

Risk Ratio (M‐H, Fixed, 95% CI)

0.93 [0.66, 1.30]

3.1 Adequately blinded

4

640

Risk Ratio (M‐H, Fixed, 95% CI)

0.92 [0.62, 1.36]

3.2 Inadequately blinded

2

70

Risk Ratio (M‐H, Fixed, 95% CI)

0.96 [0.50, 1.84]

4 Mortality and follow‐up Show forest plot

6

710

Risk Ratio (M‐H, Fixed, 95% CI)

0.93 [0.66, 1.30]

4.1 Adequate folllow‐up

4

640

Risk Ratio (M‐H, Fixed, 95% CI)

0.92 [0.62, 1.36]

4.2 Inadequate follow‐up

2

70

Risk Ratio (M‐H, Fixed, 95% CI)

0.96 [0.50, 1.84]

5 Mortality and duration of treatment Show forest plot

6

710

Risk Ratio (M‐H, Fixed, 95% CI)

0.93 [0.66, 1.30]

5.1 Short‐term treatment (less than 46 days)

5

350

Risk Ratio (M‐H, Fixed, 95% CI)

1.19 [0.78, 1.81]

5.2 Long‐term treatment (more than 46 days (24 months))

1

360

Risk Ratio (M‐H, Fixed, 95% CI)

0.63 [0.35, 1.13]

6 Mortality and stage of alcoholic liver disease Show forest plot

6

710

Risk Ratio (M‐H, Fixed, 95% CI)

0.93 [0.66, 1.30]

6.1 Alcoholic hepatitis

4

207

Risk Ratio (M‐H, Fixed, 95% CI)

1.30 [0.83, 2.04]

6.2 Alcoholic liver disease (mixed stages)

2

503

Risk Ratio (M‐H, Fixed, 95% CI)

0.64 [0.38, 1.09]

7 Mortality and worst case scenario Show forest plot

6

710

Risk Ratio (M‐H, Fixed, 95% CI)

0.97 [0.70, 1.35]

8 Mortality and per protocol analysis Show forest plot

6

646

Risk Ratio (M‐H, Fixed, 95% CI)

0.91 [0.63, 1.30]

Figuras y tablas -
Comparison 3. Sensitivity analyses