Flumazenil versus placebo o ninguna intervención para pacientes con cirrosis y encefalopatía hepática
Información
- DOI:
- https://doi.org/10.1002/14651858.CD002798.pub4Copiar DOI

- Base de datos:
-
- Cochrane Database of Systematic Reviews
- Versión publicada:
-
- 10 agosto 2017see what's new
- Tipo:
-
- Intervention
- Etapa:
-
- Review
- Grupo Editorial Cochrane:
-
Grupo Cochrane de Hepatobiliar
- Copyright:
-
- Copyright © 2017 The Cochrane Collaboration. Published by John Wiley & Sons, Ltd.
Cifras del artículo
Altmetric:
Citado por:
Autores
Contributions of authors
LLG: drafted review and completed the statistical analyses.
LLG and MYM: validated the extracted data and refined the drafting of the review.
All authors participated in the selection of randomised clinical trials and extraction of data; interpretation of the results and in the critical revision of the review; and approved of the final version before submission.
Peer Reviewers: Manuel Romero‐Gómez, Spain; R Todd Frederick, USA.
Contact Editor: Genaro D'Amico, Italy.
Sign‐off Editor: Christian Gluud, Denmark.
Sources of support
Internal sources
-
Copenhagen Trial Unit, Denmark.
External sources
-
No sources of support supplied
Declarations of interest
LLG: acted as investigator in studies funded by Norgine, Abbvie, Intercept, and Merck; received funding for travel expenses from Novo Nordisk; and received funding for lectures from Eli Lilly and Norgine.
MYM: no conflicts of interest.
ETG: no conflicts of interest.
MLA: no conflicts of interest.
Acknowledgements
We thank Dr Guiseppe Barbaro and Dr Ronan O'Carroll for providing us with more detailed information on the randomised clinical trials they conducted; Roche Pharma for supplying us with literature from their internal database on flumazenil; Dr Jianping Liu for translating a Chinese publication; and Sarah Klingenberg for performing the electronic literature searches. We also thank Dr Bodil Als‐Nielsen and Dr Christian Gluud who participated in the previous version of this review but were unable to participate in the update due to other commitments.
Cochrane Review Group funding acknowledgement: the Danish State is the largest single funder of The Cochrane Hepato‐Biliary Group through its investment in The Copenhagen Trial Unit, Centre for Clinical Intervention Research, Rigshospitalet, Copenhagen University Hospital, Denmark. Disclaimer: the views and opinions expressed in this review are those of the authors and do not necessarily reflect those of the Danish State or The Copenhagen Trial Unit.
Version history
| Published | Title | Stage | Authors | Version |
| 2017 Aug 10 | Flumazenil versus placebo or no intervention for people with cirrhosis and hepatic encephalopathy | Review | Ee Teng Goh, Mette L Andersen, Marsha Y Morgan, Lise Lotte Gluud | |
| 2017 Jul 26 | Flumazenil versus placebo or no intervention for people with cirrhosis and hepatic encephalopathy | Review | Ee Teng Goh, Mette L Andersen, Marsha Y Morgan, Lise Lotte Gluud | |
| 2004 Apr 19 | Benzodiazepine receptor antagonists for hepatic encephalopathy | Review | Bodil Als‐Nielsen, Lise Lotte Gluud, Christian Gluud | |
| 2001 Jul 10 | Benzodiazepine receptor antagonists for acute and chronic hepatic encephalopathy | Review | Bodil Als‐Nielsen, L L Kjaergard, Christian Gluud, Lise Lotte Gluud | |
Differences between protocol and review
The review has been extensively revised compared to the original protocol and the previously published version of this current review (Als‐Nielsen 2004). The changes mainly reflect the current recommendations (Gluud 2017).
In the previous review (Als‐Nielsen 2004), the primary outcomes included 'recovery' from hepatic encephalopathy defined as complete resolution of symptoms and 'improvement' of hepatic encephalopathy. We removed outcome 'recovery.' The term may be misleading as episodes may recur. Furthermore, people may show some degree of impairment between episodes (Bajaj 2010). Based on current guidelines (Gluud 2017), we assessed 'improvement' as number of participants 'without improvement of hepatic encephalopathy.' We now include all‐cause mortality as a primary outcome rather than 'survival.'
The previous version of the review included data from both periods of cross‐over trials. In this review, we only included data from the first treatment period because hepatic encephalopathy is fluctuating condition and because participants may die early in the randomised clinical trials.
We now report the results of meta‐analyses using risk ratios, instead of risk differences, and include observational studies to improve our assessment of serious adverse events, Trial Sequential Analyses, and regression analysis (Harbord test) to evaluate the risk of small‐study effects. The bias assessment is also updated.
Keywords
MeSH
Medical Subject Headings (MeSH) Keywords
- Cause of Death;
- Flumazenil [adverse effects, *therapeutic use];
- GABA Modulators [adverse effects, *therapeutic use];
- Hepatic Encephalopathy [*drug therapy, etiology, mortality];
- Liver Cirrhosis [*complications, mortality];
- Placebos [therapeutic use];
- Randomized Controlled Trials as Topic;
- Watchful Waiting;
Medical Subject Headings Check Words
Humans;
PICO

Trial Sequential Analysis of randomised clinical trials evaluating flumazenil versus placebo for people with hepatic encephalopathy. The outcome is all‐cause mortality. The original meta‐analysis included 11 randomised clinical trials with 842 participants. The Trial Sequential Analysis ignored three randomised clinical trials due to insufficient information size (Cadranel 1995; Gyr 1996; Zhu 1998). The analysis was made with alpha 3%, power 90%, relative risk reduction 20%, assumed control risk 10%, and diversity 10%. The blue line (Z‐curve) corresponds to the cumulative meta‐analysis, the black horizontal line is the conventional boundary (3% level of significance), and the inward sloping green line is the Trial Sequential Monitoring Boundary. Futility boundaries are ignored because the information is insufficient. The analysis found no evidence to support or refute a beneficial or harmful effect of flumazenil on mortality.

Study flow diagram for identification and selection of randomised clinical trials.
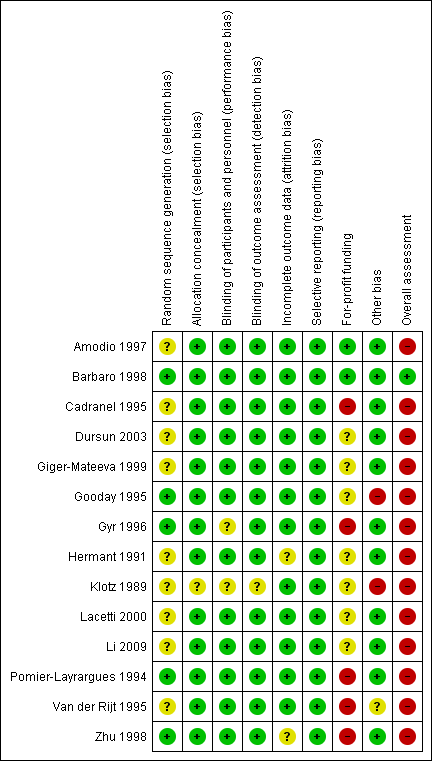
Risk of bias summary: review authors' judgements about each risk of bias item for each included study.

Trial Sequential Analysis of randomised clinical trials evaluating flumazenil versus placebo for people with cirrhosis and hepatic encephalopathy. The outcome is hepatic encephalopathy. The original meta‐analysis included 11 randomised clinical trials with 824 participants. The Trial Sequential Analysis is made with alpha 3%, power 90%, relative risk reduction 20%, assumed control risk 60%, and diversity 10%. The blue line (Z‐curve) corresponds to the cumulative meta‐analysis, the black horizontal line is the conventional boundary (3% level of significance), and the inward sloping green line is the Trial Sequential Monitoring Boundary. The analysis found that the Z‐curve crossed the monitoring boundary before reaching the diversity‐adjusted required information size of 914 participants.
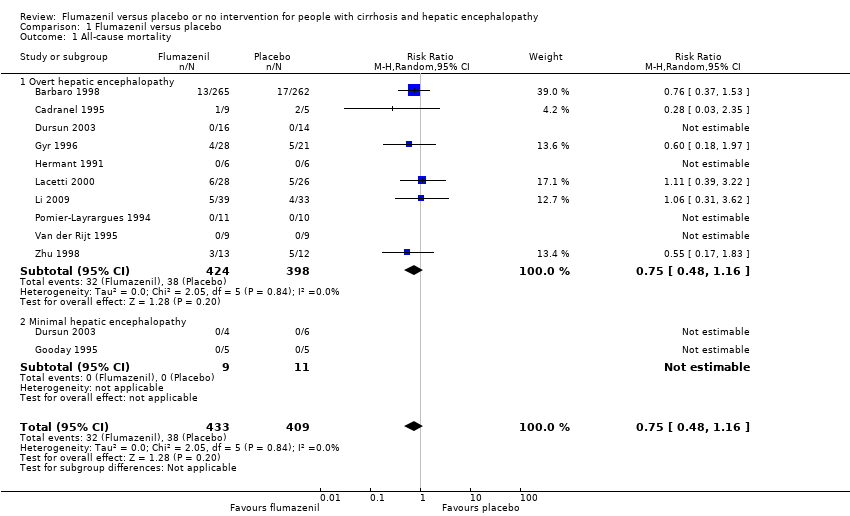
Comparison 1 Flumazenil versus placebo, Outcome 1 All‐cause mortality.

Comparison 1 Flumazenil versus placebo, Outcome 2 All‐cause mortality and bias control.

Comparison 1 Flumazenil versus placebo, Outcome 3 All‐cause mortality and trial design.
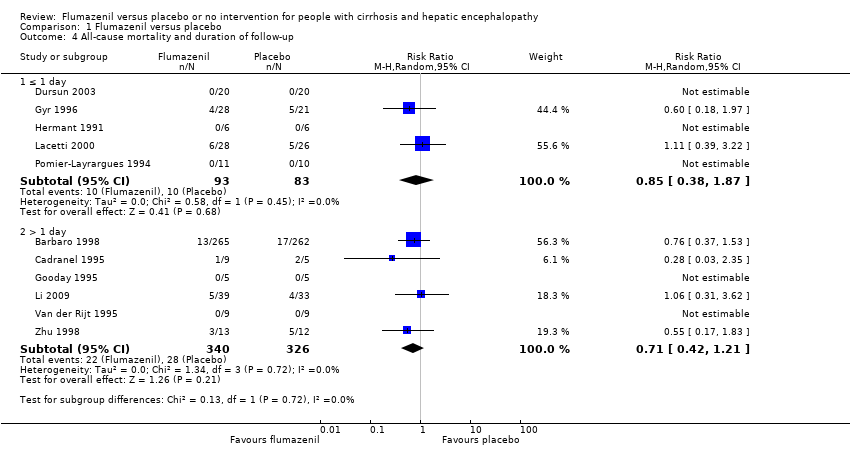
Comparison 1 Flumazenil versus placebo, Outcome 4 All‐cause mortality and duration of follow‐up.

Comparison 1 Flumazenil versus placebo, Outcome 5 Hepatic encephalopathy.

Comparison 1 Flumazenil versus placebo, Outcome 6 Hepatic encephalopathy and bias control.

Comparison 1 Flumazenil versus placebo, Outcome 7 Hepatic encephalopathy and trial design.
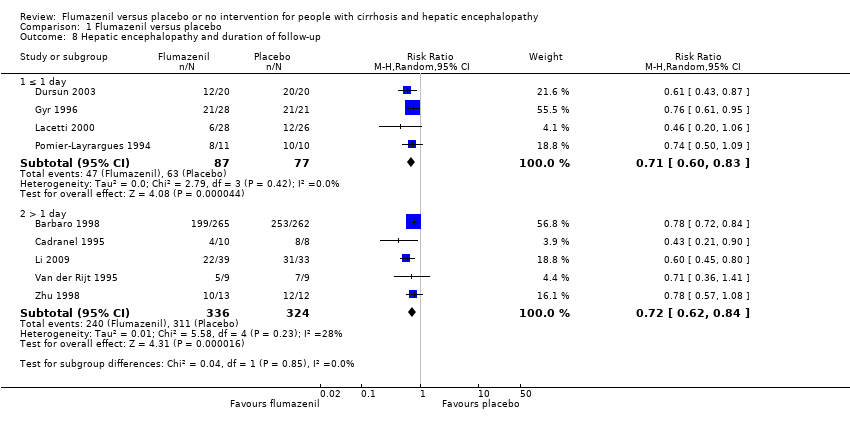
Comparison 1 Flumazenil versus placebo, Outcome 8 Hepatic encephalopathy and duration of follow‐up.

Comparison 1 Flumazenil versus placebo, Outcome 9 Hepatic encephalopathy and acute liver failure.
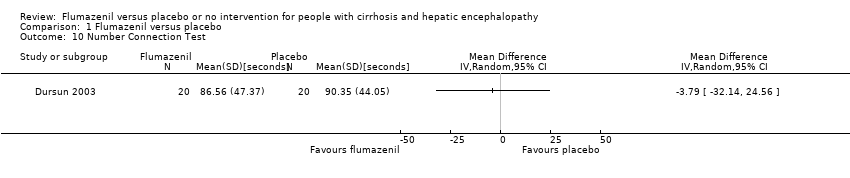
Comparison 1 Flumazenil versus placebo, Outcome 10 Number Connection Test.

Comparison 1 Flumazenil versus placebo, Outcome 11 All‐cause mortality and acute liver failure.
| Flumazenil versus placebo for people with cirrhosis and hepatic encephalopathy | ||||||
| Patient or population: people with hepatic encephalopathy Setting: hospital Intervention: flumazenil Comparison: placebo | ||||||
| Outcomes | Anticipated absolute effects* (95% CI) | Relative effect | No of participants | Quality of the evidence | Comments | |
| Risk with placebo | Risk with flumazenil | |||||
| All‐cause mortality | Study population | RR 0.75 | 842 | ⊕⊕⊝⊝ | The only RCT with low risk of bias found no effect of flumazenil on all‐cause mortality (RR 0.76, 95% CI 0.37 to 1.53). The Trial Sequential Analysis found insufficient evidence to support or refute an intervention benefit/harm. | |
| 93 per 1000 | 70 per 1000 | |||||
| Hepatic encephalopathy | Study population | RR 0.75 | 824 | ⊕⊕⊝⊝ | The only RCT with a low risk of bias reported a beneficial effect of flumazenil on hepatic encephalopathy (RR 0.78, 95% CI 0.72 to 0.84; Barbaro 1998). The Trial Sequential Analysis found that flumazenil was associated with a beneficial effect on hepatic encephalopathy (Figure 1). The methods used to assess this outcome varied considerably (Table 1) and the duration of follow‐up was very short in the majority of RCTs. | |
| 933 per 1000 | 700 per 1000 | |||||
| Serious adverse events | See comment | See comment | Not estimable | 842 | ⊕⊕⊝⊝ | All‐cause mortality was the only serious adverse event reported for both the intervention and control group (Table 6). The narrative text in 4 RCTs described that causes of death included liver failure, progressive liver disease, and infections. |
| *The risk in the intervention group (and its 95% confidence interval) is based on the assumed risk in the comparison group and the relative effect of the intervention (and its 95% CI). CI: confidence interval; RCT: randomised clinical trial; RR: risk ratio. | ||||||
| GRADE Working Group grades of evidence | ||||||
| 1 Downgraded due to risk of bias: only one RCT had a low risk of bias. 2 Downgraded due to imprecision: wide confidence intervals. | ||||||
| Trial | Type of hepatic encephalopathy | Neuropsychiatric assessment | Definition of overall improvement |
| Minimal | Number Connection Test and Brainstem Auditory Evoked Response. | Investigators did not define or assess the number of participants with an overall improvement. | |
| Overt | Mental status assessed using a clinical scale (Table 2), Modified Glasgow Coma Scale (Table 2), and electroencephalography (Table 3). | Improvement in clinical scores or electroencephalography. | |
| Overt | Mental status assessed using a clinical scale (Table 2), and electroencephalography (Table 3). | Improvement in clinical score or electroencephalography. | |
| Minimal or overt | Mental status assessed using a clinical scale (Table 2), Number Connection Test results, and electroencephalography (Table 3). | Improvement based on the clinical score and Number Connection Test results. | |
| Minimal | Number Connection Test and brainstem auditory evoked response. | Not defined. The investigators included a post‐hoc subjective assessment of alertness. | |
| Minimal | Simple and complex reaction time, verbal memory, psychomotor speed, short‐term and working memory. | Improvement in psychomotor speed evaluated using change in reaction time; Investigators did not define or assess the number of participants with overall improvement. . | |
| Overt | Mental status (Table 2), and electroencephalography (Table 3). | Clinically relevant improvement defined as a 2‐point improvement in clinical score at any time during treatment compared with baseline. The investigators also reported improvement defined using the clinical scale score (mean for all individual observations). | |
| Overt | Glasgow Coma Scale (Table 2), and electroencephalography. | A 2‐point improvement in the Glasgow Coma Score and electroencephalography. | |
| Overt | Clinical assessment (score not described). | Improvement in clinical status | |
| Overt | Mental status (scale not specified) and Glasgow Coma Scale (Table 2). | Investigators originally classified participants as Grade III to IV coma. Method of assessment not stipulated. The trial report defined 'clinically relevant improvement' as primary outcome defined as a 3‐point improvement in Glasgow Coma Score. | |
| Overt | Glasgow Coma Scale (Table 2), and electroencephalography | Improvement in the Glasgow Coma Score of ≥ 3 points. | |
| Overt | Modified Glasgow Coma Score (Table 2), and electroencephalography. | Improvement in ≥ 2 items on modified Glasgow Coma Score within 1 hour after the end of treatment. | |
| Overt | Clinical scale (Table 2). | A ≥ 1 point decrease in severity of hepatic encephalopathy. | |
| Overt | Clinical scale (Table 2). | Overall improvement in hepatic encephalopathy based on clinical grade. | |
| RCT: randomised clinical trial. | |||
| Scale (Grippon 1988) used in Cadranel 1995 ; Barbaro 1998 . | |
| I | Euphoria or depression, mild confusion, slowness, disorder in sleep rhythm. |
| II | Drowsiness, inappropriate behaviour, accentuation of stage I. |
| III | Stupor; participant sleeps most of the time but is rousable; incoherent speech; marked confusion. |
| IVa | Coma, co‐ordinated response to painful stimuli. |
| IVb | Coma, hyperextension, and pronosupination after painful stimuli. |
| IVc | Coma, no response to painful stimuli. |
| V | Clinical decerebration. |
| Scale (Fitz 1998) used in Dursun 2003 . | |
| Subclinical | Normal examination with subtle changes in psychometric or Number Connection Tests. |
| I | Impaired attention, irritability, depression, or personality changes. |
| II | Drowsiness, behavioural changes, sleep disorders, and poor memory. |
| III | Confusion, disorientation, somnolence, and amnesia. |
| Scale (Jones 1988) used in Gyr 1996 . | |
| ‐ | Clinical assessment criteria consisted of the anamnestic criterion: disorders of sleep pattern (insomnia, hypersomnia, inversion of sleep rhythm) in combination with assessment of the level of consciousness (1 to 4 as described below). Score items weighted so major disturbances of consciousness (portal systemic encephalopathy stage III and IV) were associated with scores of ≥ 11. Portal systemic encephalopathy stage II defined as scores of 5 to 10 and stage I of 3 to 4. |
| 1 | Light disturbance of consciousness if ≥ 1 of following symptoms were present: drowsiness (tendency to fall asleep but wake up spontaneously or in response to normal voice or light), intermittent or permanent disorientation, retardation of ability to perform mental tasks (serial subtractions of sevens), mood disorder, inappropriate behaviour. |
| 2 | Somnolence (arousable to physical stimuli such as mild prodding or shaking only). |
| 3 | Stupor (localised motor response to pain). |
| 4 | Coma (unarousability, no or unlocalised motor reactions to painful stimuli). |
| Scale (no reference provided in paper) used in Van der Rijt 1995 . | |
| 1 | Presence of ≥ 2 of following abnormalities: inverted sleep pattern, disturbed memory, impaired calculation (serial sevens), slowness of speech, or flapping tremor. |
| 2 | Presence of ≥ 2 of following: lethargy, time disorientation, or flapping tremor. |
| 3 | Presence of ≥ 2 of following: a state in which person had to be stimulated repetitively to open his/her eyes or execute commands, disorientation in terms of place and disorientation with respect to person. |
| 4 | Coma. |
| 1 | Trivial lack of awareness, euphoria or anxiety, shortened attention span, impaired performance of addition or subtraction. |
| 2 | Lethargy or apathy, minimal disorientation for time or place, subtle personality change, inappropriate behaviour. |
| 3 | Somnolence to semistupor, but responsive to verbal stimuli; confusion; gross disorientation. |
| 4 | Coma. |
| Glasgow Coma Scale (CGS) (Teasdale 1974) used in Hermant 1991 ; Lacetti 2000 ; Dursun 2003 ; Li 2009 . | |
| Scores | Eye opening (E):
Verbal response (V):
Motor response (M):
|
| Grading |
|
| Modified Glasgow Coma Scale (Pappas 1983) used in Pomier‐Layrargues 1994 ; Barbaro 1998 . | |
| Scores |
|
| Electroencephalography grading/Fischer classification (Nusinovici 1977 and Spehlman 1991) used in Hermant 1991 ; Pomier‐Layrargues 1994 ; Cadranel 1995 ; Barbaro 1998 . | |
| I | Irregular background activity (theta and alpha). |
| II | Continuous theta activity, bursts of delta waves. |
| III | Prevalent delta activity; polyphasic transients sharp and slow wave complexes. |
| IVa | Continuous delta activity; abundant sharp and slow wave complexes; electroencephalography reactivity present. |
| IVb | Slower activity (delta and some polyphasic transients); electroencephalography reactivity = 0. |
| IVc | Discontinuous activity with silent periods. |
| V | Flat. |
| Electroencephalography grading (Parsons‐Smith 1957) used in Dursun 2003 . | |
| A | Generalised suppression of alpha rhythm and its frequent replacement by faster potentials in all leads. The tracings in this grade are generally flat and featureless. |
| B | Alpha rhythm very unstable and disturbed by random waves at 5‐7 per second over both hemispheres. Rhythms most often seen over temporal lobes. In many cases with underlying fast activity. |
| C | Alpha rhythm still seen, but disturbed over both hemispheres by medium‐voltage 5‐6 per second waves. These occur in runs, are not paroxysmal, and do not usually block to eye opening although blocking may occur. Rhythms are particularly well seen over temporal and frontal lobes. |
| D | 5‐6 per second rhythms seen in grade C are now constant in all areas and replace all other cortical activity recorded on electroencephalogram. Appearance of this abnormality in a patient presenting with only slight neuropsychiatric symptoms is very striking. |
| E | 5 to 6 per second rhythms replaced by frontally preponderant bi‐lateral synchronous 2 per second rhythms, which spread backwards over hemispheres. At times, 6 per second rhythms might reappear, but special features of records are occurrence of these diencephalic discharges. |
| Electroencephalography grading (Kennedy 1973) used in Gyr 1996 . | |
| 0 | 8 to 12 per second basic rhythm, mean dominant frequency > 8 per second, % theta < 20. |
| 1 | Sudden shifts between normal alpha frequency (around 9 or 10 per second) and slow substitutes (6‐8 per second); mean dominant frequency > 7 per second, % theta > 35. |
| 2 | Diffuse slow activity posterior alpha rhythm seen occasionally, mean dominant frequency 5 to 7 per second, % theta > 60. |
| 3 | Dominant slow activity in all areas, mean dominant frequency 3 to 5 per second, % delta 70. |
| 4 | Bilaterally synchronous, 2‐3 per second waves, predominating over frontal lobes and spreading backwards to occipital lobes; occasional short‐lived appearance of faster rhythms (5 or 6 per second) or voltage depression, mean dominant frequency < 3 per second, % delta 70. |
| Electroencephalography grading (Markand 1984) used in Van der Rijt 1995 . | |
| 0 | Background activity consisting of alpha rhythm. |
| 1 | Alpha rhythm with some scattered theta waves. |
| 2 | Background activity of theta activity intermixed with some delta and alpha frequencies. |
| 3 | Background of delta polymorphic activity of high amplitude with spontaneous variability. |
| 4 | Delta activity of relatively small amplitude. |
| Trial | Participants (n) | Precipitating factors (n) |
| 527 | Gastrointestinal bleeding (352), surgery (95), sepsis (45), dehydration (6), unknown (29). | |
| 14 | Gastrointestinal bleeding (4), sepsis (7), alcoholic hepatitis (3), portal vein thrombosis (1), viral hepatitis (1), unknown (2). | |
| 54 | Gastrointestinal bleeding (31), sepsis (7), drugs (11), surgery (1). | |
| 21 | Gastrointestinal bleeding (7), sepsis (2), dehydration (1), surgery (2), none (9), portacaval shunting (4). | |
| 18 | Hepatitis (5), acute exacerbation in cirrhosis (2), partial hepatectomy (1). | |
| 25 | Gastrointestinal bleeding (13), protein overload (6), infection (2), wounds (1), unknown (3). | |
| n: number of participants. | ||
| Trial | Required period free of benzodiazepines before inclusion | Baseline screening for benzodiazepines | Screening method and detection level | Negative testing at baseline an inclusion criterion | Proportion testing positive for benzodiazepines at baseline |
| 2 weeks | Yes |
| No | 0% | |
| 4 days | Yes |
| No | 1.9% | |
| Not reported | Yes |
| No | 21.4% | |
| 3 days | No | Not reported | Not reported | Not reported | |
| 3 months | Yes |
| No | 0% | |
| 1 month | No | Not reported | Not reported | Not reported | |
| Yes, but length not specified | Yes |
Post‐hoc analysis
| No | 8.2% on screening tests Flumazenil 11%; placebo 5% 12/49 samples for more sensitive testing lost | |
| Not reported | Yes | Not reported | Yes | 0% | |
| Not reported | No | Not reported | Not reported | Not reported | |
| 2 weeks | Yes |
Post‐hoc analysis
| Yes | 0% | |
| Not reported | No | Not reported | N/A | N/A | |
| 3 days | Yes |
Post‐hoc analysis
| No | 19% | |
| Recent | Yes |
| Yes | 0% | |
| 7 days | No | Not reported | Not reported | Not reported |
| Trial | Number of participants | Included in analyses of serious adverse events | Data included in primary analysis | Serious adverse events |
| 13 | No | Cross‐over RCT. Data from the first treatment period not described. | Publication does not describe any deaths or other serious adverse events. | |
| 527 | Yes | Cross‐over RCT. Data from the first treatment period included. | Thirteen non‐responders in the flumazenil group and 17 non responders in the placebo group died 3 to 4 days (range 2‐6) after randomisation. The causes of dead were septic shock (20 participants); hypovolaemic shock (8 participants) and lactic acidosis (2 participants) but information was not provided on the number of deaths by cause in each group. | |
| 14 | Yes | Cross‐over RCT. Data from the first treatment period included. | One of 12 responders died from septic shock on day 4 and 2 of 6 non‐responders died from septic shock (day 2) and lactic acidosis (day 4) but information is not provided on the groups to which they a were allocated. | |
| 40 | Yes | Parallel‐arm RCT. We included all participants in the analyses. | Publication did not describe any deaths or other serious adverse events. | |
| 10 | No | Cross‐over RCT. Data from the first treatment period not described. | Publication did not describe any deaths or other serious adverse events. | |
| 10 | Yes | Cross‐over RCT. Data from the first treatment period included. | Publication did not describe any deaths or other serious adverse events. | |
| 49 | Yes | Parallel‐arm RCT. We included all participants in the analyses. | Four of 28 participants allocated to flumazenil and 5 of 21 allocated to placebo died within 4 weeks of the trial. One participant in the placebo group died with respiratory failure during the course of the study. The authors described participants as having severe liver disease suggesting that the cause of death in the remaining 8 participants may have been cirrhosis‐related although this is not specifically stated. The investigators classified the remaining adverse events viz flushing, nausea, vomiting, and irritability, which were experienced by 4 participants, as non‐serious. | |
| 12 | Yes | Parallel‐arm RCT. We included all participants in the analyses. | Publication did not describe any deaths or other serious adverse events. | |
| 2 | No | Cross‐over RCT. Data from the first treatment period were not described. | Publication does not describe any deaths or other serious adverse events. | |
| 54 | Yes | Parallel‐arm RCT. We include all participants in the analyses. | Six of 28 participants in the flumazenil group and 5 of 26 in the control group died. The causes of death were not provided. | |
| 72 | Yes | Parallel‐arm RCT. The included participants had hepatic encephalopathy associated with cirrhosis or acute liver failure. Data were not provide separately for the 2 groups. | Five of 39 participants in the flumazenil group and 4 of 33 participants in the control group died. The causes of death were not provided. | |
| 21 | Yes | Cross‐over RCT. Data from the first treatment period were included. | Publication did not describe any deaths or other serious adverse events. | |
| 18 | Yes | Cross‐over RCT. The included participants had hepatic encephalopathy associated with cirrhosis or acute liver failure. Data were not provide separately for the 2 groups. Data from the first treatment period were included. | Publication did not describe any deaths or other serious adverse events. Two participants with fulminant hepatic failure underwent orthotopic liver transplantation on day 1 of the study. | |
| 25 | Yes | Parallel‐arm RCT. We included all participants in the analyses. | Three of 13 participants in the flumazenil group and 5 of 12 participants in the control group died. The causes of death were not provided. | |
| RCT: randomised clinical trial. | ||||
| Outcome or subgroup title | No. of studies | No. of participants | Statistical method | Effect size |
| 1 All‐cause mortality Show forest plot | 11 | 842 | Risk Ratio (M‐H, Random, 95% CI) | 0.75 [0.48, 1.16] |
| 1.1 Overt hepatic encephalopathy | 10 | 822 | Risk Ratio (M‐H, Random, 95% CI) | 0.75 [0.48, 1.16] |
| 1.2 Minimal hepatic encephalopathy | 2 | 20 | Risk Ratio (M‐H, Random, 95% CI) | 0.0 [0.0, 0.0] |
| 2 All‐cause mortality and bias control Show forest plot | 12 | 844 | Risk Ratio (M‐H, Random, 95% CI) | 0.75 [0.48, 1.16] |
| 2.1 Low risk of bias | 1 | 527 | Risk Ratio (M‐H, Random, 95% CI) | 0.76 [0.37, 1.53] |
| 2.2 High risk of bias | 11 | 317 | Risk Ratio (M‐H, Random, 95% CI) | 0.75 [0.43, 1.31] |
| 3 All‐cause mortality and trial design Show forest plot | 12 | Risk Ratio (M‐H, Random, 95% CI) | Subtotals only | |
| 3.1 Cross‐over | 6 | 592 | Risk Ratio (M‐H, Random, 95% CI) | 0.69 [0.35, 1.34] |
| 3.2 Parallel‐arm | 6 | 252 | Risk Ratio (M‐H, Random, 95% CI) | 0.81 [0.45, 1.44] |
| 4 All‐cause mortality and duration of follow‐up Show forest plot | 11 | Risk Ratio (M‐H, Random, 95% CI) | Subtotals only | |
| 4.1 ≤ 1 day | 5 | 176 | Risk Ratio (M‐H, Random, 95% CI) | 0.85 [0.38, 1.87] |
| 4.2 > 1 day | 6 | 666 | Risk Ratio (M‐H, Random, 95% CI) | 0.71 [0.42, 1.21] |
| 5 Hepatic encephalopathy Show forest plot | 9 | 824 | Risk Ratio (M‐H, Random, 95% CI) | 0.75 [0.71, 0.80] |
| 5.1 Overt hepatic encephalopathy | 9 | 814 | Risk Ratio (M‐H, Random, 95% CI) | 0.73 [0.67, 0.80] |
| 5.2 Minimal hepatic encephalopathy | 1 | 10 | Risk Ratio (M‐H, Random, 95% CI) | 0.75 [0.41, 1.39] |
| 6 Hepatic encephalopathy and bias control Show forest plot | 9 | 824 | Risk Ratio (M‐H, Random, 95% CI) | 0.75 [0.71, 0.80] |
| 6.1 Low risk of bias | 1 | 527 | Risk Ratio (M‐H, Random, 95% CI) | 0.78 [0.72, 0.84] |
| 6.2 High risk of bias | 8 | 297 | Risk Ratio (M‐H, Random, 95% CI) | 0.69 [0.61, 0.78] |
| 7 Hepatic encephalopathy and trial design Show forest plot | 9 | Risk Ratio (M‐H, Random, 95% CI) | Subtotals only | |
| 7.1 Cross‐over | 4 | 584 | Risk Ratio (M‐H, Random, 95% CI) | 0.77 [0.72, 0.83] |
| 7.2 Parallel‐arm | 5 | 240 | Risk Ratio (M‐H, Random, 95% CI) | 0.69 [0.59, 0.79] |
| 8 Hepatic encephalopathy and duration of follow‐up Show forest plot | 9 | Risk Ratio (M‐H, Random, 95% CI) | Subtotals only | |
| 8.1 ≤ 1 day | 4 | 164 | Risk Ratio (M‐H, Random, 95% CI) | 0.71 [0.60, 0.83] |
| 8.2 > 1 day | 5 | 660 | Risk Ratio (M‐H, Random, 95% CI) | 0.72 [0.62, 0.84] |
| 9 Hepatic encephalopathy and acute liver failure Show forest plot | 9 | Risk Ratio (M‐H, Random, 95% CI) | Subtotals only | |
| 9.1 Cirrhosis | 7 | 734 | Risk Ratio (M‐H, Random, 95% CI) | 0.76 [0.71, 0.82] |
| 9.2 Acute liver failure or cirrhosis | 2 | 90 | Risk Ratio (M‐H, Random, 95% CI) | 0.62 [0.47, 0.80] |
| 10 Number Connection Test Show forest plot | 1 | Mean Difference (IV, Random, 95% CI) | Totals not selected | |
| 11 All‐cause mortality and acute liver failure Show forest plot | 11 | 842 | Risk Ratio (M‐H, Random, 95% CI) | 0.75 [0.48, 1.16] |
| 11.1 Participants with cirrhosis | 9 | 752 | Risk Ratio (M‐H, Random, 95% CI) | 0.71 [0.45, 1.14] |
| 11.2 Participants with cirrhosis or acute liver failure | 2 | 90 | Risk Ratio (M‐H, Random, 95% CI) | 1.06 [0.31, 3.62] |