氟马西尼与安慰剂或空白对照对于肝硬化伴肝性脑病患者的干预
摘要
研究背景
肝性脑病是肝硬化导致可怜的大脑运作的常见并发症。疾病谱的变化包含临床'明显'或公开的肝性脑病到临床'无形'或最小的肝性脑病肝性脑病。氟马西尼是合成苯二氮卓类拮抗剂与高亲和力为中央苯二氮卓类识别点。氟马西尼可能受益人通过间接消极变构调节作用于 γ‐氨基丁酸受体功能的肝性脑病。这项系统综述共包括 13 随机的临床试验,发现氟马西尼对全因死亡率,10 的随机临床试验,分析的基础,但发现对肝性脑病的有益影响,以前版本的基础八个随机临床试验的分析。
研究目的
肝硬化和肝性脑病患者评价氟马西尼与安慰剂或不干预的有益和有害的影响。
检索策略
我们检索了Cochrane 肝胆组对照试验注册库(The Cochrane Hepato‐Biliary Group Controlled Trials Register)、CENTRAL、MEDLINE、Embase、Science Citation Index Expanded、会议论文、LILACS以及2017 年 5 月的参考书目。
纳入排除标准
我们纳入了评价获益伤害随机对照临床试验,对发表状态、盲法、语言不做限制,同时纳入评价伤害的观察性研究。
资料收集与分析
两位综述作者独立提取资料。我们进行了meta分析,采用风险比率 (RR) 及 95%可信区间 (CI) 。同时应用 I 2 评价异质性。我们使用 Cochrane 肝胆病小组推荐的方法进行偏倚评估;应用GRADE进行证据的质量评估;应用回归分析评价小样本研究的风险;同时进行序贯性分析、亚组分析和敏感性分析。
主要结果
我们共纳入14项临床试验共计 867名受试者,其中大部分已经明显肝性脑病急性发作。此外,我们找到了一个正在进行的随机临床试验。我们无法从其中的两个随机的临床试验,计25 名受试者收集结果数据。因此,我们的分析包括12项比较氟马西尼与安慰剂比较的随机临床试验共计842名受试者。一项随机临床试验我们评价为低风险,其余研究评价为高偏倚风险。随访时间范围从几分钟到两个星期,但大部分的试验中随访时间少于一天。
共计 32/433 (7.4%) 的受试者接受了氟马西尼,38/409 (9.3%) 受试者接受安慰剂(RR 0.75,95%CI 0.48 到 1.16; 11 随机临床试验; 低质量的证据)。序贯分析和评估为低偏倚风险的(RR 0.76,95%CI 0.37 至 1.53) 一个随机临床试验发现氟马西尼对全因死亡率没有有益或有害的影响。用于评价肝性脑病的方法包括几个不同的临床量表、 电生理变量和心理测试。当分析所有随机临床试验 (RR 0.75,95%CI 0.71‐0.80,824名受试者,九个随机的临床试验; 低质量的证据) 或只分析低偏倚风险的研究时(RR 0.78,95%CI 为 0.72 ~ 0.84; 527 受试者),氟马西尼对肝性脑病具有有益影响。序贯分析提示对肝性脑病支持氟马西尼有益的效果。随机临床试验相关的死亡原因和非致命性严重不良事件信息极少。
作者结论
我们发现低质量证据表明患有肝硬化,肝性脑病的氟马西尼短期有益的影响,但没有证据表明对全因死亡率的影响。还需要大型、高质量的随机临床试验评估氟马西尼用于肝硬化和肝性脑病患者的潜在的利与弊。
PICO
简语概要
氟马西尼与安慰剂或空白对照对于肝硬化伴肝性脑病患者的干预
研究背景
什么是肝性脑病?
肝硬化是一种慢性肝病。肝硬化的患者可能出现肝性脑病,可导致脑功能下降。对于一些患者来说,大脑功能受损有显著的临床表现(明显的肝性脑病),这些表现可能是短暂的或持续较长时间。对于另一些患者来说,临床表现并不显著,但某些方面的脑功能,如在测试中发现注意力和执行复杂任务的能力下降(轻微肝性脑病)。引起肝性脑病的原因很复杂,但大脑的神经递质——使神经细胞互相沟通的化学信使——发生变化可能起重要作用。神经递质伽马氨基丁酸(gamma aminobutyric acid,GABA)在负责减缓或抑制大脑的活动方面被认为发挥特别重要的作用。
什么是氟马西尼?
氟马西尼是作用于GABA受体在大脑修改及其对这些特化的细胞的影响之一,所以可能受益人肝性脑病的药物。它,必须考虑到静脉 (静脉) 和它的影响不会持续超过几个小时。
研究问题
我们基于患者被随机分配到氟马西尼或安慰假人或没有具体的干预治疗的临床试验研究氟马西尼治疗肝性脑病肝硬化的患者使用。
文献检索日期
我们检索了医学数据库,并进行手动检索,时间截止于2017 年 5 月。
研究经费来源
五个包括随机临床试验得到来自制药公司的支持。
研究特征
我们纳入了14项随机临床试验共涉及867 人名受试者。所有的随机临床试验都比较静脉滴注氟马西尼与安慰剂(伪输液,例如盐溶液)。治疗范围从10分钟到72小时的时间。十项随机临床试验入组的受试者呈明显肝性脑病;三名受试者最小的肝性脑病;和一个随机的临床试验包括显性或最小的肝性脑病的受试者。
主要结果
分析表明无氟马西尼对影响全因死亡率 (任何原因死亡) 与安慰剂相比。接受氟马西尼干预的人更有可能从他们比服用安慰剂的人的肝性脑病中恢复过来。我们几乎未发现严重的副作用。
证据质量
总体而言,氟马西尼对肝性脑病的影响的证据质量较低;只有一个随机的临床试验包括了偏倚的风险很低。
Authors' conclusions
Summary of findings
| Flumazenil versus placebo for people with cirrhosis and hepatic encephalopathy | ||||||
| Patient or population: people with hepatic encephalopathy Setting: hospital Intervention: flumazenil Comparison: placebo | ||||||
| Outcomes | Anticipated absolute effects* (95% CI) | Relative effect | No of participants | Quality of the evidence | Comments | |
| Risk with placebo | Risk with flumazenil | |||||
| All‐cause mortality | Study population | RR 0.75 | 842 | ⊕⊕⊝⊝ | The only RCT with low risk of bias found no effect of flumazenil on all‐cause mortality (RR 0.76, 95% CI 0.37 to 1.53). The Trial Sequential Analysis found insufficient evidence to support or refute an intervention benefit/harm. | |
| 93 per 1000 | 70 per 1000 | |||||
| Hepatic encephalopathy | Study population | RR 0.75 | 824 | ⊕⊕⊝⊝ | The only RCT with a low risk of bias reported a beneficial effect of flumazenil on hepatic encephalopathy (RR 0.78, 95% CI 0.72 to 0.84; Barbaro 1998). The Trial Sequential Analysis found that flumazenil was associated with a beneficial effect on hepatic encephalopathy (Figure 1). The methods used to assess this outcome varied considerably (Table 1) and the duration of follow‐up was very short in the majority of RCTs. | |
| 933 per 1000 | 700 per 1000 | |||||
| Serious adverse events | See comment | See comment | Not estimable | 842 | ⊕⊕⊝⊝ | All‐cause mortality was the only serious adverse event reported for both the intervention and control group (Table 6). The narrative text in 4 RCTs described that causes of death included liver failure, progressive liver disease, and infections. |
| *The risk in the intervention group (and its 95% confidence interval) is based on the assumed risk in the comparison group and the relative effect of the intervention (and its 95% CI). CI: confidence interval; RCT: randomised clinical trial; RR: risk ratio. | ||||||
| GRADE Working Group grades of evidence | ||||||
| 1 Downgraded due to risk of bias: only one RCT had a low risk of bias. 2 Downgraded due to imprecision: wide confidence intervals. | ||||||

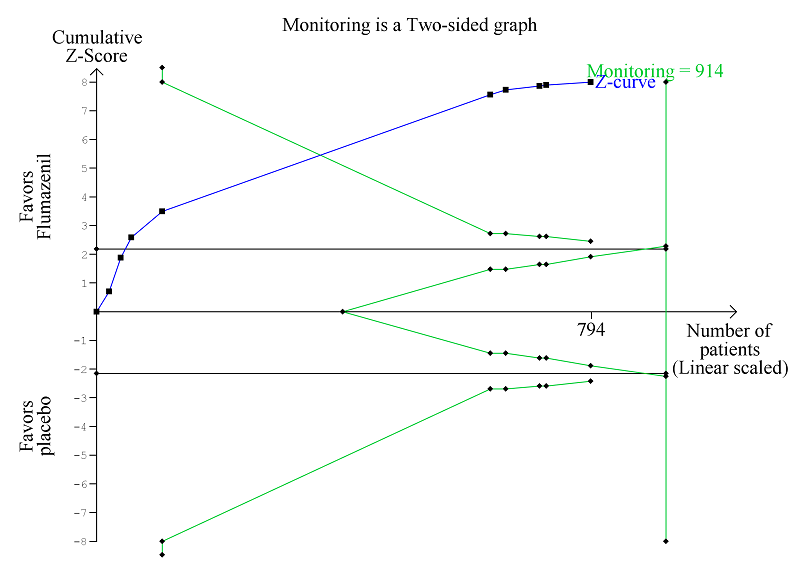
Trial Sequential Analysis of randomised clinical trials evaluating flumazenil versus placebo for people with hepatic encephalopathy. The outcome is all‐cause mortality. The original meta‐analysis included 11 randomised clinical trials with 842 participants. The Trial Sequential Analysis ignored three randomised clinical trials due to insufficient information size (Cadranel 1995; Gyr 1996; Zhu 1998). The analysis was made with alpha 3%, power 90%, relative risk reduction 20%, assumed control risk 10%, and diversity 10%. The blue line (Z‐curve) corresponds to the cumulative meta‐analysis, the black horizontal line is the conventional boundary (3% level of significance), and the inward sloping green line is the Trial Sequential Monitoring Boundary. Futility boundaries are ignored because the information is insufficient. The analysis found no evidence to support or refute a beneficial or harmful effect of flumazenil on mortality.
Background
Description of the condition
Hepatic encephalopathy is the term used to describe the spectrum of neuropsychiatric changes that can occur in people with cirrhosis. The joint guideline from the European Association for the Study of the Liver (EASL) and the American Association for the Study of Liver Diseases (AASLD) defines hepatic encephalopathy as brain dysfunction associated with liver insufficiency or portal systemic shunting (EASL/AASLD guideline 2014a; EASL/AASLD guideline 2014b).
Clinically apparent orovert hepatic encephalopathy manifests as a neuropsychiatric syndrome encompassing a wide spectrum of mental and motor disorders (Weissenborn 1998; Ferenci 2002). Events such as gastrointestinal bleeding, infection, and alcohol misuse can trigger this so‐called acute or episodic hepatic encephalopathy. Fifty per cent of instances occur with no obvious precipitating cause. Episodes may recur. Between episodes, people may return to their baseline neuropsychiatric status or retain a degree of impairment (Bajaj 2010). Less frequently, people present with persistent neuropsychiatric abnormalities, which are always present to some degree, but which may vary in seriousness. The clinical features of overt hepatic encephalopathy range from subtle alterations in personality, intellectual capacity and cognitive function to more profound alterations in motor function and consciousness leading to deep coma (Weissenborn 1998). Other abnormalities include impaired psychometric performance (Schomerus 1998; Randolph 2009), disturbed neurophysiological function (Parsons‐Smith 1957; Chu 1997), altered cerebral neurochemical/neurotransmitter homeostasis (Taylor‐Robinson 1994), reductions in global and regional cerebral blood flow and metabolism (O'Carroll 1991), and changes in cerebral fluid homeostasis (Haussinger 2000). In general, the degree of impairment in these parameters increases as the clinical condition worsens. Minimal hepatic encephalopathy (in the older literature 'subclinical' or 'latent') refers to people with cirrhosis who are 'clinically normal,' but who show abnormalities in neuropsychometric or neurophysiological performance (Ferenci 2002). Hepatic encephalopathy, whether minimal or overt, is associated with impairment in the performance of complex tasks, such as driving (Schomerus 1981; Bajaj 2009; Kircheis 2009), and a detrimental effect on health‐related quality of life (Groeneweg 1998), safety (Roman 2011), neurocognitive function post‐transplantation (Sotil 2009), and survival (Bustamante 1999; D'Amico 2006; Stewart 2007). About 42% of people with cirrhosis are alive one year after their first episode of hepatic encephalopathy but only 23% are alive after three years (Bustamante 1999). Thus, more than 50% die within one year and more than 75% die within three years. Hepatic encephalopathy also poses a substantial burden for the carers of affected people (Bajaj 2011) and on healthcare systems (Poordad 2007; Stepanova 2012).
Prevalence of hepatic encephalopathy
The prevalence of hepatic encephalopathy varies. About 10% to 14% of people with cirrhosis have overt hepatic encephalopathy at the time they are first diagnosed as having liver disease (Saunders 1981). In people with decompensated cirrhosis the prevalence of overt hepatic encephalopathy is around 20% (D'Amico 1986; de Jongh 1992; Zipprich 2012). The cumulated incidence of overt hepatic encephalopathy is as high as 40% (Randolph 2009; Bajaj 2011). The prevalence of minimal hepatic encephalopathy varies but may be as high as 50% (Lauridsen 2011).
Diagnosing hepatic encephalopathy
There is no gold standard for the diagnosis of hepatic encephalopathy. A detailed neuropsychiatric history and examination is important to identify suggestive abnormalities while eliminating other potential causes of similar cerebral changes (Montagnese 2004). The West Haven or Conn criteria are commonly used to assess and grade the mental state (Conn 1977), while the Glasgow Coma Scale is used to grade the level of consciousness (Teasdale 1974). People with hepatic encephalopathy show impairment on a range of psychometric tests. People with minimal hepatic encephalopathy show deficits in attention, visuo‐spatial abilities, fine motor skills, and memory while other cognitive functions are relatively well preserved. People with overt hepatic encephalopathy show additional disturbances in psychomotor speed, executive function, and concentration. The Psychometric Hepatic Encephalopathy Score, which employs five paper and pencil tests to assess attention, visual perception and visuo‐constructive abilities, is widely used in the assessment of psychometric change in people with cirrhosis (Schomerus 1998; Weissenborn 2001). People with hepatic encephalopathy may have a number of neurophysiological abnormalities (Guérit 2009). The electroencephalogram, which primarily reflects cortical neuronal activity, may show progressive slowing of background activity and abnormal wave morphology. The brain responses, or evoked potentials, to stimuli such as light and sounds may show abnormal slowing or abnormal wave forms. Other potential diagnostic techniques include the Critical Flicker Fusion Frequency (Kircheis 2002), and the Inhibitory Control Test (Bajaj 2008). Blood ammonia concentrations are not routinely measured to diagnose hepatic encephalopathy but they are sometimes monitored in clinical trials.
Description of the intervention
The pathogenesis of hepatic encephalopathy is complex and incompletely understood. It is associated with a general depression in cerebral function and a shift in balance between inhibitory and excitatory neurotransmission favouring inhibition. Gamma aminobutyric acid (GABA) is the major inhibitory neurotransmitter in the brain; it binds to a specific receptor; the GABA‐A‐complex, which also has neurosteroid and benzodiazepine modulatory sites (Butterworth 2016). People with hepatic encephalopathy have been shown to have increased 'GABAergic tone'. Use of a benzodiazepine receptor antagonist may counteract this increased tone and benefit people with hepatic encephalopathy (Ahboucha 2008).
Flumazenil competitively inhibits the activity at the benzodiazepine recognition site on the GABA‐A receptor complex, but lacks major intrinsic pharmacological or behavioural activity (Whitwam 1995). Flumazenil is used to treat benzodiazepine overdose and in the reversal of anaesthesia. Following intravenous administration, flumazenil distributes extensively in the extravascular space with an initial distribution half‐life of 4 to 11 minutes and a terminal half‐life of 40 to 80 minutes. Maximum plasma concentrations are reached at around 50 minutes. Flumazenil is completely metabolised primarily by hepatic metabolism and has a relatively high hepatic extraction ratio (Amrein 1990). In people with moderate liver dysfunction, the mean total clearance is decreased to 40% to 60%. In people with severe liver dysfunction, clearance is decreased to 25%. This results in a prolongation of the half‐life from 50 minutes in healthy volunteers to 1.3 hours in people with moderate hepatic impairment and 2.4 hours in people with severe hepatic dysfunction (Amrein 1990). Nevertheless, even in people with severe liver disease, its duration of action remains relatively short.
How the intervention might work
Glutamate dehydrogenase synthesises GABA from glutamate in presynaptic nerves. GABA binds to a specific receptor, which is embedded in the postsynaptic neural membrane. This receptor is part of a larger GABA‐A receptor complex, which also has binding sites for benzodiazepines, barbiturates, and neurosteroids. The binding of any of these ligands opens a chloride channel; the influx of chloride ions results in hyperpolarisation of the postsynaptic membrane and neuro‐inhibition. Neurosteroids are synthesised in the brain, primarily in astrocytes, and mediate the increased GABAergic tone associated with hepatic encephalopathy. Neurosteroid synthesis is mediated via activation of translocator protein, a mitochondrial neuroglial cholesterol‐transporter protein (Butterworth 2016). Translocator protein sites were previously known as 'peripheral‐type' or mitochondrial benzodiazepine receptors. Neurosteroids such as 3α‐5α‐tetrahydroprogesterone (allopregnanolone) are potent, endogenous, positive allosteric modulators of both the GABA and benzodiazepine sites on the GABA‐A receptor complex. Autopsy and imaging studies show consistent upregulation of translocator protein sites in people with hepatic encephalopathy. This upregulation is most likely mediated by ammonia and manganese (Ahboucha 2008), both of which accumulate as a result of hepatocellular failure and portal‐systemic shunting of blood. In addition, cerebrospinal fluid and autopsied brains of people with hepatic encephalopathy have increased concentrations of agonist ligands such as diazepam‐binding inhibitor and octadecaneuropeptide, which modulate the function of translocator protein sites (Córdoba 2002). People who die from hepatic encephalopathy have increased cerebral concentrations of allopregnanolone, which modulates components of the GABA‐A receptors. The neurosteroids may also act synergistically with other neurotoxins such as ammonia and benzodiazepine‐like compounds to further modulate GABA‐A receptor function. The net effect is an increase in GABAergic tone and neural inhibition. Involvement of the GABA system in the pathogenesis of hepatic encephalopathy is consistent with the increased sensitivity to benzodiazepines observed in these patients (Batki 1987).
Flumazenil is a selective, synthetic benzodiazepine antagonist with high affinity for the benzodiazepine recognition site but is itself devoid of intrinsic activity. This compound functions as an antagonist of positive and negative modulators acting at benzodiazepine recognition sites located in the GABA‐A receptor (Vicini 1987). Flumazenil may exert an indirect negative allosteric modulatory effect on GABA‐A receptor function by reducing the facilitatory action of the central benzodiazepine receptor on GABA‐related opening of the chloride ion‐channel and in turn the excessive inhibitory effect.
Why it is important to do this review
The resource utilisation associated with the management of people with hepatic encephalopathy continues to escalate (Poordad 2007; Stepanova 2012). The costs of treatment and rehabilitation are increasing year on year (Neff 2010). The identification of effective interventions which will facilitate the management of people with hepatic encephalopathy is clearly important. A number of randomised clinical trials have assessed the effects of flumazenil in people with cirrhosis and hepatic encephalopathy (Klotz 1989; Hermant 1991; Cadranel 1995; Gooday 1995; Gyr 1996; Amodio 1997; Barbaro 1998; Giger‐Mateeva 1999; Dursun 2003). However, the number of randomised clinical trials and of included participants is small and several trials used a cross‐over design, which hampers the analyses of clinical outcomes such as mortality and morbidity. A meta‐analysis undertaken in 2002 found that use of flumazenil may be associated with clinical and electroencephalographic improvement in people with cirrhosis and hepatic encephalopathy (Goulenok 2002). The previous versions of this review included 13 randomised clinical trials (Als‐Nielsen 2001; Als‐Nielsen 2004) and found no beneficial effect of flumazenil on all‐cause mortality, but a potential beneficial effect on manifestations of hepatic encephalopathy. We have updated this review based on current recommendations (Gluud 2017).
Objectives
To evaluate the beneficial and harmful effects of flumazenil versus placebo or no intervention for people with cirrhosis and hepatic encephalopathy.
Methods
Criteria for considering studies for this review
Types of studies
We included randomised clinical trials regardless of their publication status, language, or blinding in our primary analyses. If, during the selection of trials, we identified observational studies (i.e. quasi‐randomised studies, cohort studies, or patient reports) that reported adverse events caused by, or associated with, the interventions in our review, we included these studies for a review of the adverse events. We did not specifically search for observational studies for inclusion in this review, which is a known limitation.
Types of participants
Randomised clinical trials evaluating participants with cirrhosis and hepatic encephalopathy, irrespective of the aetiology and severity of the underlying liver disease. Included participants could have overt or minimal hepatic encephalopathy. If we identified trials including subsets of relevant participants with cirrhosis as well as participants without cirrhosis, we planned to exclude these trials in sensitivity analyses.
Types of interventions
Flumazenil at any dose, duration, or mode of administration versus placebo or no intervention.
Types of outcome measures
We assessed all outcomes at the maximum duration of follow‐up.
Primary outcomes
-
All cause‐mortality.
-
Hepatic encephalopathy (number of participants without improved manifestations).
-
Serious adverse events defined as any untoward medical occurrence that resulted in death, was life‐threatening, required hospitalisation, led to prolongation of the existing hospitalisation, or resulted in persistent or significant disability (ICH‐GCP 1997). We analysed serious adverse events as a composite outcome (Gluud 2017).
Secondary outcomes
-
Non‐serious adverse events defined as any adverse event that did not fulfil the criteria for a serious adverse event.
-
Health‐related quality of life.
Exploratory outcomes
-
Number Connection Test results.
Search methods for identification of studies
The last search update was May 2017.
Electronic searches
We searched The Cochrane Hepato‐Biliary Group Controlled Trials Register (Gluud 2017), Cochrane Central Register of Controlled Trials (CENTRAL; 2017, Issue 2) in the Cochrane Library (searched May 2017), MEDLINE Ovid (1946 to May 2017), Embase Ovid (1974 to May 2017), Science Citation Index Expanded (Web of Science; 1900 to May 2017) (Royle 2003), and LILACS (Bireme; 1982 to May 2017) using the strategy described in Appendix 1. We did not have access to Chinese or Japanese databases. We plan to search both Chinese and Japanese databases in future updates, should they become available to us via the Cochrane Hepato‐Biliary Group.
Searching other resources
We searched the reference lists of papers identified in the electronic searches and wrote to authors of the identified clinical trials and relevant pharmaceutical companies. We searched the conference proceedings of the European Association for the Study of the Liver (EASL), the United European Gastroenterology Week (UEGW), the American Gastroenterological Association (AGA), the American Association for the Study of Liver Diseases (AASLD), the International Society for Hepatic Encephalopathy and Nitrogen metabolism (ISHEN), the World Health Organization (WHO) online trial meta‐register (apps.who.int/trialsearch/), and Google Scholar using the search terms cirrhosis AND flumazenil.
Data collection and analysis
Selection of studies
Three review authors (ETG, MYM, and LLG), working independently, read the updated electronic searches, performed additional handsearches, and listed potentially eligible trials. All authors read the potentially eligible trials and participated in the final selection of those to be included in the analyses. For trials reported in more than one publication, we selected the paper reporting the longest duration of follow‐up as the primary reference. We listed details of all included trials in a 'Characteristics of included studies' table and listed all excluded studies with the reason for their exclusion in a 'Characteristics of excluded studies table'.
Data extraction and management
All review authors participated in data extraction and at least two review authors independently evaluated each randomised clinical trial. We resolved disagreements through discussion and sought key unpublished information that was missing from published trial reports, through correspondence with the primary investigators of included randomised clinical trials.
Where we were not able to gather sufficient data (number of events and participants) from the text and tables of the included reports of randomised clinical trials or from correspondence with investigators we attempted to extrapolate data, where possible, from any contained graphical material.
We gathered data on the following:
-
Trials: design (cross‐over or parallel), setting (number of clinical sites), country of origin, inclusion period;
-
Participants: mean age, proportion of men, type of hepatic encephalopathy, proportion with cirrhosis, proportion with alcoholic liver disease, proportion with viral hepatitis;
-
Interventions: type, dose, duration of therapy, mode of administration;
-
Outcomes: outcomes assessed, criteria used in the assessment of hepatic encephalopathy.
Assessment of risk of bias in included studies
We assessed bias control using the domains described in the Cochrane Hepato‐Biliary Group Module (Gluud 2017) and classified the risk of bias for separate domains as high, unclear, or low. We also included an overall assessment of bias control as described below:
Allocation sequence generation
-
Low risk of bias: sequence generation achieved using computer random number generation or a random number table. Drawing lots, tossing a coin, shuffling cards, or throwing dice were adequate if performed by an independent person not otherwise involved in the trial.
-
Unclear risk of bias: not described.
-
High risk of bias: sequence generation method was not random.
Allocation concealment
-
Low risk of bias: used a central and independent randomisation unit or similar adequate method (e.g. serially numbered opaque sealed envelopes) to ensure that the allocation sequence was unknown to the investigators (Hrobjartsson 2001; Savovic 2012a; Savovic 2012b).
-
Unclear risk of bias: allocation not described.
-
High risk of bias: allocation sequence was likely to be known to the investigators who assigned the participants.
Blinding of participants and personnel
-
Low risk of bias: blinding of participants and personnel performed adequately using a placebo. We defined lack of blinding as not likely to affect the evaluation of mortality.
-
Unclear risk of bias: insufficient information to assess blinding.
-
High risk of bias: no blinding or incomplete blinding.
Blinding of outcome assessors
-
Low risk of bias: blinding of outcome assessors performed adequately using a placebo. We defined lack of blinding as not likely to affect the evaluation of mortality (Hrobjartsson 2001; Savovic 2012a; Savovic 2012b).
-
Unclear risk of bias: there was insufficient information to blinding.
-
High risk of bias: no blinding or incomplete blinding.
Incomplete outcome data
-
Low risk of bias: missing data were unlikely to make treatment effects depart from plausible values. The investigators used sufficient methods, such as intention‐to‐treat analyses with multiple imputations or carry‐forward analyses to handle missing data.
-
Unclear risk of bias: there was insufficient information to assess missing data.
-
High risk of bias: the results were likely to be biased due to missing data.
Selective outcome reporting
-
Low risk of bias: the trial reported clinically relevant outcomes (all‐cause mortality, hepatic encephalopathy, and serious adverse events). If we had access to the original trial protocol, the outcomes selected should have been those described in the protocol. If we obtained information from a trial registry (such as www.clinicaltrials.gov), we only used that information if the investigators registered the trial before inclusion of the first participant.
-
Unclear risk of bias: predefined relevant outcomes were not reported fully or the reporting was unclear.
-
High risk of bias: one or more predefined outcomes were not reported.
For‐profit bias
-
Low risk of bias: the trial appeared free of industry sponsorship or other type of for‐profit support.
-
Unclear risk of bias: no information on clinical trial support or sponsorship.
-
High risk of bias: the trial was sponsored by industry or received other support (such as provision of study drugs).
Other bias
-
Low risk of bias: the trial appeared free of other biases including: medicinal dosing problems or follow‐up (as defined below).
-
Unclear risk of bias: the trial may or may not have been free of other domains that could put it at risk of bias.
-
High risk of bias: there were other factors in the trial that could put it at risk of bias such as the administration of inappropriate treatments being given to the controls (e.g. an inappropriate dose) or follow‐up (e.g. the trial included different follow‐up schedules for participants in the allocation groups).
Overall bias assessment
-
Low risk of bias: all domains were low risk of bias using the definitions described above.
-
High risk of bias: one or more of the bias domains were of unclear or high risk of bias.
Measures of treatment effect
We analysed dichotomous data using risk ratios (RR) and continuous data using mean differences (MD), both with 95% confidence intervals (CI).
Unit of analysis issues
Due to the fluctuating nature of hepatic encephalopathy and the nature of our primary outcomes, we included randomised clinical trials using a parallel group design and the first treatment period from cross‐over trials.
Dealing with missing data
We extracted data on all participants randomised to allow intention‐to‐treat analyses. We planned to undertake analyses to evaluate the influence of missing data (Higgins 2008) including worst‐case scenario analysis, and extreme worst‐case and best‐case scenario analyses (Gluud 2017). However, we did not identify randomised clinical trials with missing outcome data.
Assessment of heterogeneity
We assessed heterogeneity through visual inspection of the forest plots and expressed heterogeneity as I2 values using the following thresholds: 0% to 40% (unimportant), 40% to 60% (moderate), 60% to 80% (substantial), and greater than 80% (considerable). We included the information in our 'Summary of findings' tables.
Assessment of reporting biases
For meta‐analyses with at least 10 randomised clinical trials (meta‐analysis evaluating all‐cause mortality), we planned to prepare funnel plots and regression analyses of funnel plot asymmetry (Harbord 2006). However, our analyses included fewer than 10 randomised clinical trials.
Data synthesis
We performed the analyses using Review Manager 5 (RevMan 2014), STATA (Stata 14), and Trial Sequential Analysis (TSA 2011).
Meta‐analysis
We performed random‐effects and fixed‐effect meta‐analyses. The estimates of the random‐effects and fixed‐effect meta‐analyses were similar for all analyses. Therefore, we assumed that any small‐study effects had little effect on the intervention effect estimate. For random‐effects models, precision decreased with increasing heterogeneity and CIs widened correspondingly. Accordingly, the random‐effects model provided the most conservative (and a more correct) estimate of the intervention effect. Accordingly, we report the results of our analyses based on random‐effects meta‐analyses.
Trial Sequential Analysis
We performed Trial Sequential Analysis to evaluate the risk of errors and to evaluate futility (Wetterslev 2008; Thorlund 2011; Wetterslev 2017). We defined the required information size as the number of participants needed to detect or reject an intervention effect. We set alpha to 3% and power to 90% in all analyses. We used the model‐based diversity and repeated all analyses with a diversity increased by 10%. Due to the lack of randomised clinical trials assessed at low risk of bias, we were only able to conduct the analyses with inclusion of all randomised clinical trials (regardless of bias control).
All‐cause mortality: based on one large randomised clinical trial evaluating flumazenil (Barbaro 1998), and cohort studies evaluating the prognosis of people with hepatic encephalopathy (EASL/AASLD guideline 2014a; EASL/AASLD guideline 2014b), as well as the results of our meta‐analysis, we set the relative risk reduction to 10%, the control group risk to 20%, and increased diversity to 10%.
Hepatic encephalopathy: based on the Cochrane Hepato‐Biliary Group recommendations, we conducted the analysis with a relative risk reduction of 20% (corresponding to the upper 95% CI) and reduced the control group risk from the observed 93% to 60% (set lower than the observed control group risk).
Serious adverse events: we were only able to identify serious adverse events that were fatal. Accordingly, our analysis of all‐cause mortality and serious adverse events included the same numbers.
Subgroup analysis and investigation of heterogeneity
We performed subgroup analyses to investigate heterogeneity in randomised clinical trials based on the:
-
Type of hepatic encephalopathy;
-
Inclusion of participants with cirrhosis or acute liver failure
-
The trial design;
-
Duration of follow‐up.
Only one randomised clinical trial had a low risk of bias in the overall assessment.
Sensitivity analysis
We planned to perform worst‐case scenario analyses, but none of the trials reported missing outcome data.
'Summary of findings' table
We used GRADEpro (GRADEpro 2008) to generate a 'Summary of findings' table with information about outcomes, risk of bias, and results of the meta‐analyses. We used the GRADE system to evaluate the quality of the evidence for outcomes reported in the review considering the within‐study risk of bias (methodological quality), indirectness of evidence, diversity (heterogeneity), imprecision of effect estimate, and risk of publication bias.
Results
Description of studies
We included 14 randomised clinical trials in our analyses of benefits and harms (Klotz 1989; Hermant 1991; Pomier‐Layrargues 1994; Cadranel 1995; Gooday 1995; Van der Rijt 1995; Gyr 1996; Amodio 1997; Barbaro 1998; Zhu 1998; Giger‐Mateeva 1999; Lacetti 2000; Dursun 2003; Li 2009). We identified one randomised clinical trial which is currently ongoing (Yale 2014). We are unable to determine if this ongoing randomised clinical trial will be eligible for inclusion in the review. For additional information, see Characteristics of included studies; Characteristics of excluded studies; and Characteristics of ongoing studies tables.
Results of the search
We identified 249 references in the electronic and manual searches (Figure 2). After exclusion of duplicates and references to papers that did not describe clinical trials assessing benzodiazepine receptor antagonists for hepatic encephalopathy, we retrieved 33 references for further assessment. Fourteen randomised clinical trials described in 25 references fulfilled our inclusion criteria (Klotz 1989; Hermant 1991; Pomier‐Layrargues 1994; Cadranel 1995; Gooday 1995; Van der Rijt 1995; Gyr 1996; Amodio 1997; Barbaro 1998; Zhu 1998; Giger‐Mateeva 1999; Lacetti 2000; Dursun 2003; Li 2009). In addition, we identified one ongoing randomised clinical trial with an estimated completion date of June 2017 (Yale 2014).

Study flow diagram for identification and selection of randomised clinical trials.
Two trials were letters (Klotz 1989; Hermant 1991), and 12 were full‐text articles (Pomier‐Layrargues 1994; Cadranel 1995; Gooday 1995; Van der Rijt 1995; Gyr 1996; Amodio 1997; Barbaro 1998; Zhu 1998; Giger‐Mateeva 1999; Lacetti 2000; Dursun 2003; Li 2009). The language of the publications was English (Klotz 1989; Pomier‐Layrargues 1994; Cadranel 1995; Gooday 1995; Van der Rijt 1995; Gyr 1996; Amodio 1997; Barbaro 1998; Giger‐Mateeva 1999; Lacetti 2000; Dursun 2003), Chinese (Zhu 1998; Li 2009), or French (Hermant 1991).
Included studies
Six trials used a parallel group (Hermant 1991; Gyr 1996; Zhu 1998; Lacetti 2000; Dursun 2003; Li 2009), and eight used a cross‐over design (Klotz 1989; Pomier‐Layrargues 1994; Cadranel 1995; Gooday 1995; Van der Rijt 1995; Amodio 1997; Barbaro 1998; Giger‐Mateeva 1999). In three cross‐over trials, only people classified as non‐responders participated in the second cross‐over treatment period (Pomier‐Layrargues 1994; Cadranel 1995; Barbaro 1998). Six of the cross‐over trials included a washout period, which ranged from 3 minutes to 1 week (Pomier‐Layrargues 1994; Gooday 1995; Van der Rijt 1995; Amodio 1997; Barbaro 1998; Giger‐Mateeva 1999).
The investigators diagnosed hepatic encephalopathy using clinical scores, electrophysiological techniques, and psychometric tests (Table 1; Table 2; Table 3). Nine randomised clinical trials included participants with overt hepatic encephalopathy (Klotz 1989; Hermant 1991; Pomier‐Layrargues 1994; Cadranel 1995; Van der Rijt 1995; Barbaro 1998; Zhu 1998; Lacetti 2000; Li 2009). Six of these randomised clinical trials described precipitating events; the most common was gastrointestinal bleeding (Table 4). Three randomised clinical trials included participants with minimal hepatic encephalopathy (Gooday 1995; Amodio 1997; Giger‐Mateeva 1999), while one included participants with either minimal or overt hepatic encephalopathy (Dursun 2003). The majority of the participants in the 14 included studies had cirrhosis although 30 (33%) of the 90 participants included in two of the trials had fulminant hepatic failure (Van der Rijt 1995; Li 2009).
| Trial | Type of hepatic encephalopathy | Neuropsychiatric assessment | Definition of overall improvement |
| Minimal | Number Connection Test and Brainstem Auditory Evoked Response. | Investigators did not define or assess the number of participants with an overall improvement. | |
| Overt | Mental status assessed using a clinical scale (Table 2), Modified Glasgow Coma Scale (Table 2), and electroencephalography (Table 3). | Improvement in clinical scores or electroencephalography. | |
| Overt | Mental status assessed using a clinical scale (Table 2), and electroencephalography (Table 3). | Improvement in clinical score or electroencephalography. | |
| Minimal or overt | Mental status assessed using a clinical scale (Table 2), Number Connection Test results, and electroencephalography (Table 3). | Improvement based on the clinical score and Number Connection Test results. | |
| Minimal | Number Connection Test and brainstem auditory evoked response. | Not defined. The investigators included a post‐hoc subjective assessment of alertness. | |
| Minimal | Simple and complex reaction time, verbal memory, psychomotor speed, short‐term and working memory. | Improvement in psychomotor speed evaluated using change in reaction time; Investigators did not define or assess the number of participants with overall improvement. . | |
| Overt | Mental status (Table 2), and electroencephalography (Table 3). | Clinically relevant improvement defined as a 2‐point improvement in clinical score at any time during treatment compared with baseline. The investigators also reported improvement defined using the clinical scale score (mean for all individual observations). | |
| Overt | Glasgow Coma Scale (Table 2), and electroencephalography. | A 2‐point improvement in the Glasgow Coma Score and electroencephalography. | |
| Overt | Clinical assessment (score not described). | Improvement in clinical status | |
| Overt | Mental status (scale not specified) and Glasgow Coma Scale (Table 2). | Investigators originally classified participants as Grade III to IV coma. Method of assessment not stipulated. The trial report defined 'clinically relevant improvement' as primary outcome defined as a 3‐point improvement in Glasgow Coma Score. | |
| Overt | Glasgow Coma Scale (Table 2), and electroencephalography | Improvement in the Glasgow Coma Score of ≥ 3 points. | |
| Overt | Modified Glasgow Coma Score (Table 2), and electroencephalography. | Improvement in ≥ 2 items on modified Glasgow Coma Score within 1 hour after the end of treatment. | |
| Overt | Clinical scale (Table 2). | A ≥ 1 point decrease in severity of hepatic encephalopathy. | |
| Overt | Clinical scale (Table 2). | Overall improvement in hepatic encephalopathy based on clinical grade. |
RCT: randomised clinical trial.
| Scale (Grippon 1988) used in Cadranel 1995 ; Barbaro 1998 . | |
| I | Euphoria or depression, mild confusion, slowness, disorder in sleep rhythm. |
| II | Drowsiness, inappropriate behaviour, accentuation of stage I. |
| III | Stupor; participant sleeps most of the time but is rousable; incoherent speech; marked confusion. |
| IVa | Coma, co‐ordinated response to painful stimuli. |
| IVb | Coma, hyperextension, and pronosupination after painful stimuli. |
| IVc | Coma, no response to painful stimuli. |
| V | Clinical decerebration. |
| Scale (Fitz 1998) used in Dursun 2003 . | |
| Subclinical | Normal examination with subtle changes in psychometric or Number Connection Tests. |
| I | Impaired attention, irritability, depression, or personality changes. |
| II | Drowsiness, behavioural changes, sleep disorders, and poor memory. |
| III | Confusion, disorientation, somnolence, and amnesia. |
| Scale (Jones 1988) used in Gyr 1996 . | |
| ‐ | Clinical assessment criteria consisted of the anamnestic criterion: disorders of sleep pattern (insomnia, hypersomnia, inversion of sleep rhythm) in combination with assessment of the level of consciousness (1 to 4 as described below). Score items weighted so major disturbances of consciousness (portal systemic encephalopathy stage III and IV) were associated with scores of ≥ 11. Portal systemic encephalopathy stage II defined as scores of 5 to 10 and stage I of 3 to 4. |
| 1 | Light disturbance of consciousness if ≥ 1 of following symptoms were present: drowsiness (tendency to fall asleep but wake up spontaneously or in response to normal voice or light), intermittent or permanent disorientation, retardation of ability to perform mental tasks (serial subtractions of sevens), mood disorder, inappropriate behaviour. |
| 2 | Somnolence (arousable to physical stimuli such as mild prodding or shaking only). |
| 3 | Stupor (localised motor response to pain). |
| 4 | Coma (unarousability, no or unlocalised motor reactions to painful stimuli). |
| Scale (no reference provided in paper) used in Van der Rijt 1995 . | |
| 1 | Presence of ≥ 2 of following abnormalities: inverted sleep pattern, disturbed memory, impaired calculation (serial sevens), slowness of speech, or flapping tremor. |
| 2 | Presence of ≥ 2 of following: lethargy, time disorientation, or flapping tremor. |
| 3 | Presence of ≥ 2 of following: a state in which person had to be stimulated repetitively to open his/her eyes or execute commands, disorientation in terms of place and disorientation with respect to person. |
| 4 | Coma. |
| 1 | Trivial lack of awareness, euphoria or anxiety, shortened attention span, impaired performance of addition or subtraction. |
| 2 | Lethargy or apathy, minimal disorientation for time or place, subtle personality change, inappropriate behaviour. |
| 3 | Somnolence to semistupor, but responsive to verbal stimuli; confusion; gross disorientation. |
| 4 | Coma. |
| Glasgow Coma Scale (CGS) (Teasdale 1974) used in Hermant 1991 ; Lacetti 2000 ; Dursun 2003 ; Li 2009 . | |
| Scores | Eye opening (E):
Verbal response (V):
Motor response (M):
|
| Grading |
|
| Modified Glasgow Coma Scale (Pappas 1983) used in Pomier‐Layrargues 1994 ; Barbaro 1998 . | |
| Scores |
|
| Electroencephalography grading/Fischer classification (Nusinovici 1977 and Spehlman 1991) used in Hermant 1991 ; Pomier‐Layrargues 1994 ; Cadranel 1995 ; Barbaro 1998 . | |
| I | Irregular background activity (theta and alpha). |
| II | Continuous theta activity, bursts of delta waves. |
| III | Prevalent delta activity; polyphasic transients sharp and slow wave complexes. |
| IVa | Continuous delta activity; abundant sharp and slow wave complexes; electroencephalography reactivity present. |
| IVb | Slower activity (delta and some polyphasic transients); electroencephalography reactivity = 0. |
| IVc | Discontinuous activity with silent periods. |
| V | Flat. |
| Electroencephalography grading (Parsons‐Smith 1957) used in Dursun 2003 . | |
| A | Generalised suppression of alpha rhythm and its frequent replacement by faster potentials in all leads. The tracings in this grade are generally flat and featureless. |
| B | Alpha rhythm very unstable and disturbed by random waves at 5‐7 per second over both hemispheres. Rhythms most often seen over temporal lobes. In many cases with underlying fast activity. |
| C | Alpha rhythm still seen, but disturbed over both hemispheres by medium‐voltage 5‐6 per second waves. These occur in runs, are not paroxysmal, and do not usually block to eye opening although blocking may occur. Rhythms are particularly well seen over temporal and frontal lobes. |
| D | 5‐6 per second rhythms seen in grade C are now constant in all areas and replace all other cortical activity recorded on electroencephalogram. Appearance of this abnormality in a patient presenting with only slight neuropsychiatric symptoms is very striking. |
| E | 5 to 6 per second rhythms replaced by frontally preponderant bi‐lateral synchronous 2 per second rhythms, which spread backwards over hemispheres. At times, 6 per second rhythms might reappear, but special features of records are occurrence of these diencephalic discharges. |
| Electroencephalography grading (Kennedy 1973) used in Gyr 1996 . | |
| 0 | 8 to 12 per second basic rhythm, mean dominant frequency > 8 per second, % theta < 20. |
| 1 | Sudden shifts between normal alpha frequency (around 9 or 10 per second) and slow substitutes (6‐8 per second); mean dominant frequency > 7 per second, % theta > 35. |
| 2 | Diffuse slow activity posterior alpha rhythm seen occasionally, mean dominant frequency 5 to 7 per second, % theta > 60. |
| 3 | Dominant slow activity in all areas, mean dominant frequency 3 to 5 per second, % delta 70. |
| 4 | Bilaterally synchronous, 2‐3 per second waves, predominating over frontal lobes and spreading backwards to occipital lobes; occasional short‐lived appearance of faster rhythms (5 or 6 per second) or voltage depression, mean dominant frequency < 3 per second, % delta 70. |
| Electroencephalography grading (Markand 1984) used in Van der Rijt 1995 . | |
| 0 | Background activity consisting of alpha rhythm. |
| 1 | Alpha rhythm with some scattered theta waves. |
| 2 | Background activity of theta activity intermixed with some delta and alpha frequencies. |
| 3 | Background of delta polymorphic activity of high amplitude with spontaneous variability. |
| 4 | Delta activity of relatively small amplitude. |
| Trial | Participants (n) | Precipitating factors (n) |
| 527 | Gastrointestinal bleeding (352), surgery (95), sepsis (45), dehydration (6), unknown (29). | |
| 14 | Gastrointestinal bleeding (4), sepsis (7), alcoholic hepatitis (3), portal vein thrombosis (1), viral hepatitis (1), unknown (2). | |
| 54 | Gastrointestinal bleeding (31), sepsis (7), drugs (11), surgery (1). | |
| 21 | Gastrointestinal bleeding (7), sepsis (2), dehydration (1), surgery (2), none (9), portacaval shunting (4). | |
| 18 | Hepatitis (5), acute exacerbation in cirrhosis (2), partial hepatectomy (1). | |
| 25 | Gastrointestinal bleeding (13), protein overload (6), infection (2), wounds (1), unknown (3). |
n: number of participants.
Recent ingestion of benzodiazepines was a stipulated exclusion criterion in 10 randomised clinical trials with exclusion periods ranging from 3 days to 3 months (Hermant 1991; Pomier‐Layrargues 1994; Gooday 1995; Van der Rijt 1995; Amodio 1997; Barbaro 1998; Zhu 1998; Giger‐Mateeva 1999; Lacetti 2000; Dursun 2003; Table 5). Nine randomised clinical trials tested for blood/urine benzodiazepines at baseline (Hermant 1991; Pomier‐Layrargues 1994; Cadranel 1995; Van der Rijt 1995; Gyr 1996; Amodio 1997; Barbaro 1998; Giger‐Mateeva 1999; Lacetti 2000); three randomised clinical trials stipulated negative screening for blood/urine benzodiazepines as an inclusion criterion (Hermant 1991; Van der Rijt 1995; Lacetti 2000), while the proportion who tested positive for benzodiazepines in the other six randomised clinical trials ranged from 1.9% to 21%. The remaining five randomised clinical trials either stated that they did not measure blood/urine benzodiazepines or else did not mention testing (Table 5).
| Trial | Required period free of benzodiazepines before inclusion | Baseline screening for benzodiazepines | Screening method and detection level | Negative testing at baseline an inclusion criterion | Proportion testing positive for benzodiazepines at baseline |
| 2 weeks | Yes |
| No | 0% | |
| 4 days | Yes |
| No | 1.9% | |
| Not reported | Yes |
| No | 21.4% | |
| 3 days | No | Not reported | Not reported | Not reported | |
| 3 months | Yes |
| No | 0% | |
| 1 month | No | Not reported | Not reported | Not reported | |
| Yes, but length not specified | Yes |
Post‐hoc analysis
| No | 8.2% on screening tests Flumazenil 11%; placebo 5% 12/49 samples for more sensitive testing lost | |
| Not reported | Yes | Not reported | Yes | 0% | |
| Not reported | No | Not reported | Not reported | Not reported | |
| 2 weeks | Yes |
Post‐hoc analysis
| Yes | 0% | |
| Not reported | No | Not reported | N/A | N/A | |
| 3 days | Yes |
Post‐hoc analysis
| No | 19% | |
| Recent | Yes |
| Yes | 0% | |
| 7 days | No | Not reported | Not reported | Not reported |
All randomised clinical trials compared intravenous flumazenil versus placebo. The daily dose of flumazenil ranged from 0.2 mg to 6.5 mg and the total dose from 0.2 mg to 19.5 mg. The duration of treatment ranged from 10 minutes to 72 hours. Five randomised clinical trials evaluated the intervention effects at the end of the intervention (Klotz 1989; Hermant 1991; Amodio 1997; Giger‐Mateeva 1999; Dursun 2003). Four randomised clinical trials evaluated clinical outcomes at maximum of 24 to 72 hours after the intervention (Pomier‐Layrargues 1994; Cadranel 1995; Van der Rijt 1995; Lacetti 2000). The remaining five randomised clinical trials followed participants from 4 days to 4 weeks (Gooday 1995; Gyr 1996; Barbaro 1998; Zhu 1998; Li 2009).
The trials involving participants with overt hepatic encephalopathy defined overall improvement of hepatic encephalopathy based on a clinical assessment of mental status and the electroencephalogram (Table 1). The trials involving participants with minimal hepatic encephalopathy based their assessment of overall improvement on a subjective assessment of 'alertness' (Giger‐Mateeva 1999); Number Connection Test results (Dursun 2003), the Simple Reaction Time test results (Gooday 1995), or electroencephalography (Van der Rijt 1995).
Excluded studies
We excluded one cross‐over randomised clinical trial evaluating cognitive function and anxiety in people with alcohol‐related/ non‐alcohol‐related cirrhosis (Kapczinski 1995), one randomised clinical trial evaluating flumazenil alone or with lactulose (Wu 2001), and seven observational studies (Grimm 1988; Bansky 1989; Marsepoil 1990; Devictor 1995; Ozyilkan 1997; Golubovic 1999; Jia 1999). None of the excluded studies reported data that allowed analysis of serious adverse events.
One double‐blind, cross‐over trial involved participants with cirrhosis who were liver transplant candidates (Kapczinski 1995). The objective of the trial was to evaluate the differential effects of flumazenil versus placebo on cognitive function and anxiety in 10 people with alcohol‐related cirrhosis, 10 people with non‐alcohol‐related cirrhosis, and 10 healthy volunteers. None of the included participants had evidence of overt hepatic encephalopathy. The investigators evaluated a range of psychometric tests and reported the results as group mean values. The trial report did not provide information about the number of participants with abnormal test results, but stated that participants with cirrhosis performed worse than people in the control group on several tests including verbal recall, and on reaction time tasks. Treatment with flumazenil had no effect on the test results, but induced anxiety in the participants with non‐alcoholic cirrhosis.
Two prospective non‐randomised observational studies involved 47 participants with cirrhosis and overt hepatic encephalopathy (Marsepoil 1990; Jia 1999). The first study included 25 participants with alcohol‐related cirrhosis and acute hepatic encephalopathy, 13 of whom received flumazenil in a dose of 0.2 mg intravenously every 10 minutes until clinical improvement up to a maximum total dose of 2 mg followed by a continuous maintenance infusion of 0.3 mg. per hour for 48 hours (Marsepoil 1990). Similar mortality rates were reported in the flumazenil and control groups, but information on the number of participants who died was not provided. The second study included 22 participants with cirrhosis and overt hepatic encephalopathy (Jia 1999), 12 of whom received flumazenil while the remaining 10 received a traditional Chinese medicine, both infused intravenously. The trial report stated that two participants in the flumazenil group died of liver failure. The report did not mention deaths in the control group.
A randomised clinical trial involving 20 participants with cirrhosis and overt hepatic encephalopathy, 12 of whom were treated with repeated bolus injections of flumazenil combined with lactulose, administered as a retention enema, while a further eight participants received flumazenil alone (Wu 2001). The study authors defined improvement of hepatic encephalopathy as a three‐point or greater reduction in the Conn Score within six hours after the administration of the interventions. Seven (58%) of the 12 participants in the flumazenil plus lactulose group and four (50%) of the eight participants in the flumazenil alone group showed improvement. There were no reported deaths or adverse events.
We excluded five additional observational studies, involving 59 participants, 12 (20%) of whom were children (Grimm 1988; Bansky 1989; Devictor 1995; Ozyilkan 1997; Golubovic 1999). Two studies included participants with fulminant hepatic failure (Grimm 1988; Devictor 1995). One study, involving 14 participants with cirrhosis and overt hepatic encephalopathy, reported an improvement in mental status in 71% of participants within minutes of receiving flumazenil which lasted for 1 to 2 hours; six participants died (Bansky 1989). Another study, including 10 participants with cirrhosis and severe hepatic encephalopathy reported transient improvements in the manifestations of hepatic encephalopathy in 80% of the included participants; six died within one year (Golubovic 1999). A further study evaluated the effects of incremental intravenous boluses of flumazenil in 11 participants with cirrhosis in whom baseline somatosensory evoked potentials were abnormal; four (36%) showed a improvement in evoked potentials with flumazenil (Ozyilkan 1997). One prospective study, involving 15 adults and two children, reported transient improvement in hepatic encephalopathy, after administration of flumazenil, in four (44%) of nine participants with fulminant hepatic failure and in five (63%) of eight with cirrhosis (Grimm 1988). In a study undertaken exclusively in children with fulminant liver failure, awaiting emergency liver transplantation, flumazenil had a transient beneficial effect on arousal in one child (Devictor 1995).
Risk of bias in included studies
We assessed the risk of bias based on published information and on additional information from the trial investigators (Figure 3).

Risk of bias summary: review authors' judgements about each risk of bias item for each included study.
Allocation
We classified four randomised clinical trials with adequate allocation sequence generation and allocation concealment at low risk of selection bias (Gooday 1995; Gyr 1996; Barbaro 1998; Zhu 1998). The remaining 10 trials used an adequate method to conceal the allocation, but they did not describe the allocation sequence generation (Klotz 1989; Hermant 1991; Pomier‐Layrargues 1994; Cadranel 1995; Van der Rijt 1995; Amodio 1997; Giger‐Mateeva 1999; Lacetti 2000; Dursun 2003; Li 2009).
Blinding
We classified all randomised clinical trials as having a low risk of performance and detection bias as they were double‐blind and placebo‐controlled with blinding of participants, personnel, and outcome assessors (Klotz 1989; Hermant 1991; Pomier‐Layrargues 1994; Cadranel 1995; Gooday 1995; Van der Rijt 1995; Gyr 1996; Amodio 1997; Barbaro 1998; Zhu 1998; Giger‐Mateeva 1999; Lacetti 2000; Dursun 2003; Li 2009).
Incomplete outcome data
Two randomised clinical trials gave the impression that there were no missing outcome data although this was not specifically stated (Hermant 1991; Zhu 1998). The remaining trials had no missing outcome data and included all participants in the reported analyses (Klotz 1989; Pomier‐Layrargues 1994; Cadranel 1995; Gooday 1995; Van der Rijt 1995; Gyr 1996; Amodio 1997; Barbaro 1998; Giger‐Mateeva 1999; Lacetti 2000; Dursun 2003; Li 2009).
Selective reporting
We did not have access to protocols and were, therefore, unable to evaluate any potential differences between outcomes described in protocols compared with trial publications. All randomised clinical trials included a description of the outcomes all‐cause mortality and hepatic encephalopathy (Klotz 1989; Hermant 1991; Pomier‐Layrargues 1994; Cadranel 1995; Gooday 1995; Van der Rijt 1995; Gyr 1996; Amodio 1997; Barbaro 1998; Zhu 1998; Giger‐Mateeva 1999; Lacetti 2000; Dursun 2003; Li 2009). Therefore, we classified all trials at low risk of reporting bias.
For‐profit funding
Pharmaceutical companies provided financial or other support for five of the randomised clinical trials (Pomier‐Layrargues 1994; Van der Rijt 1995; Cadranel 1995; Gyr 1996; Zhu 1998). Seven trials did not provide information about funding (Klotz 1989; Hermant 1991; Gooday 1995; Giger‐Mateeva 1999; Lacetti 2000; Dursun 2003; Li 2009). The remaining two trials did not receive support from pharmaceutical companies (Amodio 1997; Barbaro 1998).
Other potential sources of bias
One randomised clinical trial simplified the intervention regimen and assessment of outcomes after the inclusion of nine of 18 participants (Van der Rijt 1995). We classified this trial at unclear risk of other bias and the remaining trials at low risk of bias (Klotz 1989; Hermant 1991; Pomier‐Layrargues 1994; Cadranel 1995; Gooday 1995; Gyr 1996; Amodio 1997; Barbaro 1998; Zhu 1998; Giger‐Mateeva 1999; Lacetti 2000; Dursun 2003).
Overall risk of bias
We classified one randomised clinical trial at low risk of bias for all domains (Barbaro 1998), and the remaining trials at high risk of bias (Klotz 1989; Hermant 1991; Pomier‐Layrargues 1994; Cadranel 1995; Gooday 1995; Van der Rijt 1995; Gyr 1996; Amodio 1997; Zhu 1998; Giger‐Mateeva 1999; Lacetti 2000; Dursun 2003; Li 2009).
Effects of interventions
The total number of participants was 867. Three cross‐over randomised clinical trials did not report outcomes for the first intervention period (Gooday 1995; Amodio 1997; Giger‐Mateeva 1999); we received information about the number of participants and mortality rates during the first allocation period for one of these trials (Gooday 1995), but not for the remaining two (Amodio 1997; Giger‐Mateeva 1999). We were able to gather data from the first allocation period for the five remaining cross‐over trials and required data from all of the parallel‐group trials. Accordingly, our analyses included 842 participants.
Primary outcomes
All‐cause mortality
In total, 32/433 participants allocated to flumazenil versus 38/409 participants allocated to placebo died (RR 0.75, 95% CI 0.48 to 1.16; 12trials; I2 = 0%; Analysis 1.1). The trial classified at low risk of bias found no beneficial or detrimental effect of flumazenil on all‐cause mortality (RR 0.76, 95% CI 0.37 to 1.53; Analysis 1.2). There was no evidence of small‐study effects (P = 0.31). The Trial Sequential Analyses ignored three randomised clinical trials due to insufficient information indicating that we have insufficient evidence to support or refute an effect of flumazenil on all‐cause mortality (Cadranel 1995; Gyr 1996; Zhu 1998; Figure 4). The trials including participants with minimal hepatic encephalopathy did not report any deaths (Gooday 1995; Dursun 2003; Analysis 1.1). There were no differences between trials involving participants with cirrhosis compared with trials involving participants with fulminant hepatic failure (Analysis 1.11). Additional analyses showed no differences between trials using a cross‐over or a parallel group design (Analysis 1.3); or between trials with short‐term (< 1 day) or long‐term (> 1 day) follow‐up (Analysis 1.4).
Trial Sequential Analysis of randomised clinical trials evaluating flumazenil versus placebo for people with cirrhosis and hepatic encephalopathy. The outcome is hepatic encephalopathy. The original meta‐analysis included 11 randomised clinical trials with 824 participants. The Trial Sequential Analysis is made with alpha 3%, power 90%, relative risk reduction 20%, assumed control risk 60%, and diversity 10%. The blue line (Z‐curve) corresponds to the cumulative meta‐analysis, the black horizontal line is the conventional boundary (3% level of significance), and the inward sloping green line is the Trial Sequential Monitoring Boundary. The analysis found that the Z‐curve crossed the monitoring boundary before reaching the diversity‐adjusted required information size of 914 participants.
Hepatic encephalopathy
Analysis of the data on 824 participants involved in 10 randomised clinical trials showed that flumazenil was associated with a beneficial effect on hepatic encephalopathy (RR 0.75, 95% CI 0.71 to 0.80; I2 = 0%; Analysis 1.5). The analysis only included 10 participants with minimal hepatic encephalopathy. The trial classified as having a low risk of bias found a beneficial effect of flumazenil on hepatic encephalopathy (RR 0.78, 95% CI 0.72 to 0.84; Analysis 1.6). In the Trial Sequential Analysis, the Z‐curve crossed the monitoring boundary (see Figure 4 for additional information). The analysis found that the diversity‐adjusted information size was 914 participants. The information size was 1028 participants when we increased the diversity to 20% (the model based diversity was 0%). The subgroup analyses showed no differences between subgroups of trials including participants with cirrhosis or fulminant hepatic failure (Analysis 1.9), or trials stratified by their design (Analysis 1.7), or their duration of follow‐up (Analysis 1.8).
Serious adverse events
We were only able to conduct analyses for fatal serious adverse event (Table 6). In the largest randomised clinical trial (Barbaro 1998), 13 nonresponders in the flumazenil group and 17 nonresponders in the placebo group died within 3 to 4 days (range 2 to 6). The causes of death were septic shock (n = 20); hypovolaemic shock (n = 8) and lactic acidosis (n = 2), but information was not provided on the number of deaths by cause in each group. In a smaller randomised clinical trial, four of 28 participants allocated to flumazenil and five of 21 participants allocated to placebo died within 4 weeks of the trial (Gyr 1996). One participant in the placebo group died with respiratory failure during the course of the trial, but the causes of death in the remaining eight participants were not provided. Three trials reported all‐cause mortality in the flumazenil and control groups without providing information about the cause of death (Zhu 1998; Lacetti 2000; Li 2009). None of the included participants experienced seizures.
| Trial | Number of participants | Included in analyses of serious adverse events | Data included in primary analysis | Serious adverse events |
| 13 | No | Cross‐over RCT. Data from the first treatment period not described. | Publication does not describe any deaths or other serious adverse events. | |
| 527 | Yes | Cross‐over RCT. Data from the first treatment period included. | Thirteen non‐responders in the flumazenil group and 17 non responders in the placebo group died 3 to 4 days (range 2‐6) after randomisation. The causes of dead were septic shock (20 participants); hypovolaemic shock (8 participants) and lactic acidosis (2 participants) but information was not provided on the number of deaths by cause in each group. | |
| 14 | Yes | Cross‐over RCT. Data from the first treatment period included. | One of 12 responders died from septic shock on day 4 and 2 of 6 non‐responders died from septic shock (day 2) and lactic acidosis (day 4) but information is not provided on the groups to which they a were allocated. | |
| 40 | Yes | Parallel‐arm RCT. We included all participants in the analyses. | Publication did not describe any deaths or other serious adverse events. | |
| 10 | No | Cross‐over RCT. Data from the first treatment period not described. | Publication did not describe any deaths or other serious adverse events. | |
| 10 | Yes | Cross‐over RCT. Data from the first treatment period included. | Publication did not describe any deaths or other serious adverse events. | |
| 49 | Yes | Parallel‐arm RCT. We included all participants in the analyses. | Four of 28 participants allocated to flumazenil and 5 of 21 allocated to placebo died within 4 weeks of the trial. One participant in the placebo group died with respiratory failure during the course of the study. The authors described participants as having severe liver disease suggesting that the cause of death in the remaining 8 participants may have been cirrhosis‐related although this is not specifically stated. The investigators classified the remaining adverse events viz flushing, nausea, vomiting, and irritability, which were experienced by 4 participants, as non‐serious. | |
| 12 | Yes | Parallel‐arm RCT. We included all participants in the analyses. | Publication did not describe any deaths or other serious adverse events. | |
| 2 | No | Cross‐over RCT. Data from the first treatment period were not described. | Publication does not describe any deaths or other serious adverse events. | |
| 54 | Yes | Parallel‐arm RCT. We include all participants in the analyses. | Six of 28 participants in the flumazenil group and 5 of 26 in the control group died. The causes of death were not provided. | |
| 72 | Yes | Parallel‐arm RCT. The included participants had hepatic encephalopathy associated with cirrhosis or acute liver failure. Data were not provide separately for the 2 groups. | Five of 39 participants in the flumazenil group and 4 of 33 participants in the control group died. The causes of death were not provided. | |
| 21 | Yes | Cross‐over RCT. Data from the first treatment period were included. | Publication did not describe any deaths or other serious adverse events. | |
| 18 | Yes | Cross‐over RCT. The included participants had hepatic encephalopathy associated with cirrhosis or acute liver failure. Data were not provide separately for the 2 groups. Data from the first treatment period were included. | Publication did not describe any deaths or other serious adverse events. Two participants with fulminant hepatic failure underwent orthotopic liver transplantation on day 1 of the study. | |
| 25 | Yes | Parallel‐arm RCT. We included all participants in the analyses. | Three of 13 participants in the flumazenil group and 5 of 12 participants in the control group died. The causes of death were not provided. |
RCT: randomised clinical trial.
Secondary outcome measures
None of the included trials assessed health‐related quality of life.
We were unable to conduct a meta‐analysis of non‐serious adverse events. Four randomised clinical trials reported that none of the included participants experienced non‐serious adverse events (Hermant 1991; Barbaro 1998; Lacetti 2000; Dursun 2003). In one trial, four participants in the flumazenil group experienced nausea, vomiting, flushing, or irritability (Gyr 1996); the total number of participants with the individual adverse events was not described. Two participants in one trial had transient palpitations, but the intervention group was not specified (Zhu 1998). One cross‐over trials reported that one in 10 participants felt drowsy, possibly after flumazenil infusion (Giger‐Mateeva 1999).
Exploratory outcomes
We were able to include Number Connection Test results from one randomised clinical trial with 40 participants. The trial found a MD of ‐3.79 seconds (95% CI ‐32.14 to 24.56; Analysis 1.10).
'Summary of findings' table
As shown in the summary of findings Table for the main comparison, we downgraded the strength of the evidence to low based on methodological concerns.
Discussion
Summary of main results
This review included 14 randomised clinical trials published between 1989 and 2009. The primary meta‐analyses showed no beneficial or detrimental effect of flumazenil on all‐cause mortality, but it showed a potential short‐term beneficial effect of flumazenil on the manifestations of hepatic encephalopathy. We found little evidence suggesting that flumazenil was associated with serious adverse effects, However, the reporting of serious and non‐serious adverse events was generally incomplete or unclear, and our analyses of adverse events may be subject to outcome reporting bias. Based on methodological concerns, we classified the strength of the evidence as low. Therefore, our review remains inconclusive.
Overall completeness and applicability of evidence
Flumazenil is a short‐acting specific benzodiazepine antagonist which acts by inhibiting activity at the benzodiazepine recognition site on the GABA/benzodiazepine receptor complex. Its oral bioavailability is poor and hence intravenous administration is necessary (Brogden 1991). The main indication for flumazenil is the reversal of benzodiazepine overdose or prolonged anaesthesia. Based on pharmacological studies, the onset of its effect is rapid and its duration of action is short (Brogden 1991). In healthy people, the half‐life is 50 minutes. Thus, repeated low intravenous doses or continuous infusion is needed if the clinical situation requires a longer lasting effect (Hood 2014). Hepatic encephalopathy is characterised by an increase in GABAergic tone which is the rationale for use of flumazenil in this condition.
The most important outcomes for people with cirrhosis and hepatic encephalopathy include mortality, morbidity, adverse events, and health‐related quality of life (Bajaj 2011). We found no detrimental or beneficial effect on all‐cause mortality or adverse events but a potential short‐term effect on the manifestations of hepatic encephalopathy. There was no reported information on health‐related quality of life. However, the applicability of the evidence will be limited because of the need for intravenous administration. Most trials evaluated single or repeated bolus injections (Klotz 1989; Hermant 1991; Pomier‐Layrargues 1994; Cadranel 1995; Gooday 1995; Amodio 1997; Barbaro 1998; Zhu 1998; Giger‐Mateeva 1999; Lacetti 2000). One trial assessed the effect of a 72‐hour infusion of flumazenil (Van der Rijt 1995), but the investigators changed the intervention to bolus injections because participants found the three‐day infusion too stressful. None of the trials compared different doses or different modes of administration. We found no effect of the dose of flumazenil on the estimated effect on all‐cause mortality or hepatic encephalopathy. However, based on the limited number of events and trials, important clinical differences may have been overlooked. The half‐life of flumazenil is prolonged up to 2.4 hours in people with moderate to severe hepatic decompensation, hence providing some prolongation of action (Amrein 1990). However, we found no further or additional effects of flumazenil when analysing trials with more than 24‐hour follow‐up.
The majority of the included randomised clinical trials enrolled participants with cirrhosis and an acute episode of hepatic encephalopathy although the severity varied between trials. Episodes of hepatic encephalopathy often develop in response to a precipitating event such as gastrointestinal bleeding, which was the most common precipitant identified in the included trials in this review. Identification and treatment of precipitating factors is key to the management of affected people (EASL/AASLD guideline 2014a; EASL/AASLD guideline 2014b). We did not have sufficient data to assess potential difference in outcomes between precipitated and non‐precipitated hepatic encephalopathy. None of the included participants had surgically created or transjugular intrahepatic portosystemic shunts. Likewise, the review contains very little information about people with recurrent or persistent hepatic encephalopathy as only two trials included participants classified as such (Gyr 1996; Klotz 1989). Two trials included a small number of participants with fulminant hepatic failure (Van der Rijt 1995; Li 2009). This condition is infrequent in clinical practice. We were unable to gather data that allowed us to evaluate any differential effects of flumazenil on hepatic encephalopathy associated with acute or chronic liver failure. However, subgroup analyses based on aggregated data found no difference between trials including or not including participants with fulminant hepatic failure. Nevertheless, it is likely that the pathophysiology of hepatic encephalopathy in participants with acute liver failure differs from that associated with cirrhosis. Three trials enrolled people with minimal hepatic encephalopathy (Gooday 1995; Amodio 1997; Giger‐Mateeva 1999), while a further trial included participants with both minimal and low‐grade acute hepatic encephalopathy (Dursun 2003). In these four trials, the objective appears to be more mechanistic than therapeutic, but based on our subgroup analysis, we found no difference in outcomes between overt and minimal hepatic encephalopathy. However, the diagnostic outcomes for hepatic encephalopathy in these trials were very different, namely clinical assessment versus psychometry and as the number of trials was small, statistical differences may have been overlooked.
Prior intake of benzodiazepines may influence the effects of flumazenil. Ten randomised clinical trial stipulated prior ingestion of benzodiazepines as an exclusion criterion (Hermant 1991; Pomier‐Layrargues 1994; Gooday 1995; Van der Rijt 1995; Amodio 1997; Barbaro 1998; Zhu 1998; Giger‐Mateeva 1999; Lacetti 2000; Dursun 2003), while nine trials undertook baseline screening for benzodiazepines (Hermant 1991; Pomier‐Layrargues 1994; Cadranel 1995; Van der Rijt 1995; Gyr 1996; Amodio 1997; Barbaro 1998; Giger‐Mateeva 1999; Lacetti 2000). Three randomised clinical trials stipulated negative testing for benzodiazepines as an inclusion criterion (Hermant 1991; Van der Rijt 1995; Lacetti 2000). In the remaining six trials, in which baseline testing was undertaken, it was unclear whether the results were available at the time of randomisation or whether participants were included irrespective of the results; in two of these trials, none of the participants tested positive (Amodio 1997; Giger‐Mateeva 1999), while in the remaining four trials, between 1.9% and 21.4% of participants tested positive (Pomier‐Layrargues 1994; Cadranel 1995; Gyr 1996; Barbaro 1998). Thus, the exclusion of participants based on reports of non‐ingestion of benzodiazepines is clearly unreliable. In all four of these trials, the assessment of outcomes in relation to the presence/absence of benzodiazepines were related to the response to flumazenil rather than to intervention allocation (Pomier‐Layrargues 1994; Cadranel 1995; Gyr 1996; Barbaro 1998). All four showed that the majority of participants who responded to flumazenil did not have detectable circulating benzodiazepines whereas some non‐responders had measurable quantities of these substances in their blood. The trials concluded that the presence of benzodiazepines was not predictive of participants' responses to flumazenil. We did not find this information in five trials, which should be considered when evaluating their results (Klotz 1989; Gooday 1995; Zhu 1998; Dursun 2003; Li 2009).
Administration of flumazenil by sublingual lozenge and topical cream has also been tested, albeit very selectively (Rye 2012); the preparations are not generally available nor applicable for use in most clinical settings; no trials have been undertaken in people with hepatic encephalopathy using this route of administration.
On the basis of this review, the use of flumazenil in the management of hepatic encephalopathy would be limited. It might be of value in people with severe hepatic encephalopathy not responding to usual management to facilitate procedures or to allow assessment of cognitive status in potential transplant candidates if other conditions, such as hypoxic injury, are suspected.
Quality of the evidence
The review is limited because of methodological and statistical issues relating to the included randomised clinical trials. Seven of the 14 included trial used a cross‐over design (Pomier‐Layrargues 1994; Cadranel 1995; Gooday 1995; Van der Rijt 1995; Amodio 1997; Barbaro 1998; Giger‐Mateeva 1999). While this design is suitable for evaluating interventions which are predicted to have a temporary effect on chronic stable conditions, it is not suitable for evaluating interventions which have a short‐term effect in unstable conditions (Rosenkranz 2015). The majority of trials in this review included participants with an acute episode of hepatic encephalopathy, and thus, a cross‐over design is not appropriate. The problem was further compounded since some of the trials used a modified design with cross‐over of only the non‐responders to the second treatment period. Therefore, inclusion of both periods in our analyses would introduce potential bias and would have posed statistical problems. We included data from the first period of the seven cross‐over trials, obtaining the data which correspond to those available from the more suitable parallel‐armed randomised clinical trials. The drawback of the strategy is loss of information from the second period. A further problem with the cross‐over design is that it precludes an assessment of risk of relapse.
Only one trial was at low risk of bias in the overall assessment (Barbaro 1998). The trial included the largest number of participants and had a weight of 39% in the analysis of mortality and 56% in the analysis of hepatic encephalopathy. We found no difference between this trial and the remaining trials with a high risk of bias for the two outcomes based on the test for subgroup differences; exclusion of the trial did not change the overall conclusion. We found no evidence of publication bias or other small‐study effects and between‐trial heterogeneity was negligible. Nevertheless, the CIs were wide. Although these findings support the quality of the evidence, we still have potential problems with the use of the cross‐over design. We classified the quality of the evidence as low.
While most trials reported mortality and hepatic encephalopathy, the quality of the reporting of both non‐fatal serious and non‐serious adverse events was low. We looked for additional information about harms in observational studies, but were unable to retrieve and analyse adverse events in the studies identified.
Potential biases in the review process
We attempted to minimise possible selection biases by using a comprehensive search strategy. Searches in electronic databases were combined with extensive handsearches. In addition, we also searched conference proceedings and abstract books. We think it likely that we have not missed published trials, but we cannot exclude the possibility that we have missed unpublished trials. The intervention is not high‐profile and it is possible that negative trials, particularly if small, will not have appeared as abstracts at conferences or been published in full. However, our meta‐regression analyses showed no evidence of publication bias or other dissemination biases.
Agreements and disagreements with other studies or reviews
One meta‐analysis undertaken in 2002 (Goulenok 2002) included six randomised clinical trials with 641 participants (Pomier‐Layrargues 1994; Cadranel 1995; Van der Rijt 1995; Groeneweg 1996; Gyr 1996; Barbaro 1998). The mean percentages of people with clinical improvement (five trials) were 27% in treated groups and 3% in placebo groups. We believe that two of these involve the same population of participants (Groeneweg 1996; Gyr 1996). The first trial included 49 participants with mild to moderate (Grade I to III) hepatic encephalopathy (Gyr 1996), while the second trial, which is described by the authors as an ancillary study, reported electroencephalography data from 32 of the original 49 participants (Groeneweg 1996). We excluded the second trial from this review.
The previous version of this review included 13 randomised clinical trials with 805 participants (Als‐Nielsen 2004). This earlier review found no effect of flumazenil on all‐cause mortality based on an analysis of 10 trials and a beneficial effect on hepatic encephalopathy based on an analysis of eight trials with a risk difference of 0.28 (95% CI 0.20 to 0.37). We have updated the review by inclusion of two additional randomised clinical trials in the analyses of benefits and harms (Giger‐Mateeva 1999; Li 2009), and by exclusion of one previously included study (Kapczinski 1995). Our analysis of all‐cause mortality included 12 trials and the analysis of hepatic encephalopathy included nine trials. In agreement with the previous review, we found no effect on all‐cause mortality and a beneficial effect on hepatic encephalopathy.

Trial Sequential Analysis of randomised clinical trials evaluating flumazenil versus placebo for people with hepatic encephalopathy. The outcome is all‐cause mortality. The original meta‐analysis included 11 randomised clinical trials with 842 participants. The Trial Sequential Analysis ignored three randomised clinical trials due to insufficient information size (Cadranel 1995; Gyr 1996; Zhu 1998). The analysis was made with alpha 3%, power 90%, relative risk reduction 20%, assumed control risk 10%, and diversity 10%. The blue line (Z‐curve) corresponds to the cumulative meta‐analysis, the black horizontal line is the conventional boundary (3% level of significance), and the inward sloping green line is the Trial Sequential Monitoring Boundary. Futility boundaries are ignored because the information is insufficient. The analysis found no evidence to support or refute a beneficial or harmful effect of flumazenil on mortality.

Study flow diagram for identification and selection of randomised clinical trials.
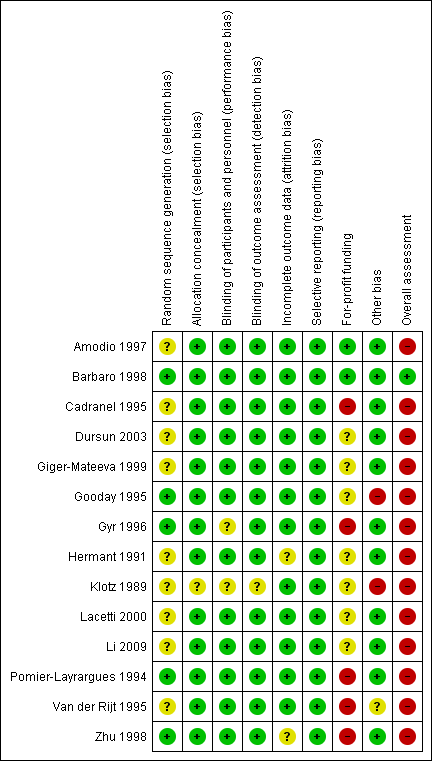
Risk of bias summary: review authors' judgements about each risk of bias item for each included study.

Trial Sequential Analysis of randomised clinical trials evaluating flumazenil versus placebo for people with cirrhosis and hepatic encephalopathy. The outcome is hepatic encephalopathy. The original meta‐analysis included 11 randomised clinical trials with 824 participants. The Trial Sequential Analysis is made with alpha 3%, power 90%, relative risk reduction 20%, assumed control risk 60%, and diversity 10%. The blue line (Z‐curve) corresponds to the cumulative meta‐analysis, the black horizontal line is the conventional boundary (3% level of significance), and the inward sloping green line is the Trial Sequential Monitoring Boundary. The analysis found that the Z‐curve crossed the monitoring boundary before reaching the diversity‐adjusted required information size of 914 participants.
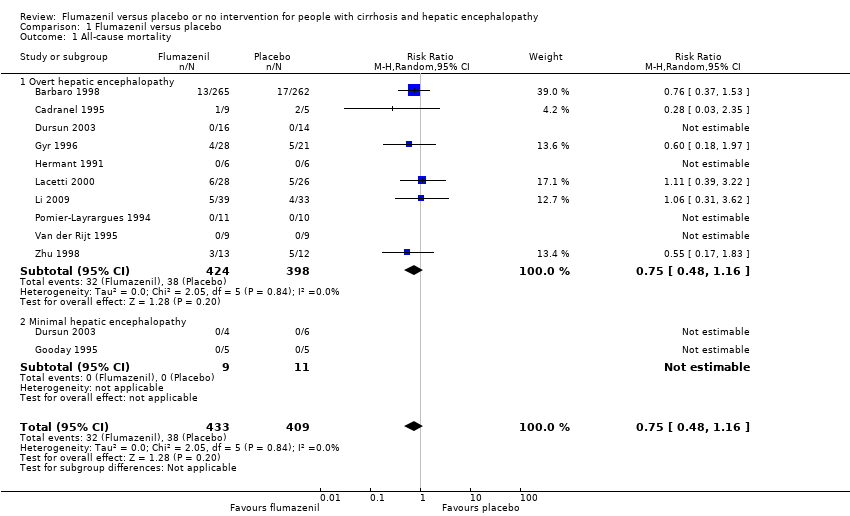
Comparison 1 Flumazenil versus placebo, Outcome 1 All‐cause mortality.

Comparison 1 Flumazenil versus placebo, Outcome 2 All‐cause mortality and bias control.

Comparison 1 Flumazenil versus placebo, Outcome 3 All‐cause mortality and trial design.
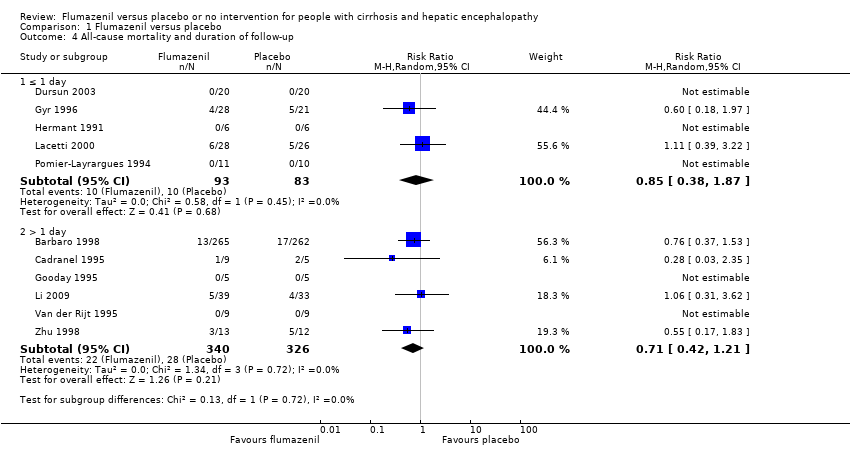
Comparison 1 Flumazenil versus placebo, Outcome 4 All‐cause mortality and duration of follow‐up.

Comparison 1 Flumazenil versus placebo, Outcome 5 Hepatic encephalopathy.

Comparison 1 Flumazenil versus placebo, Outcome 6 Hepatic encephalopathy and bias control.

Comparison 1 Flumazenil versus placebo, Outcome 7 Hepatic encephalopathy and trial design.
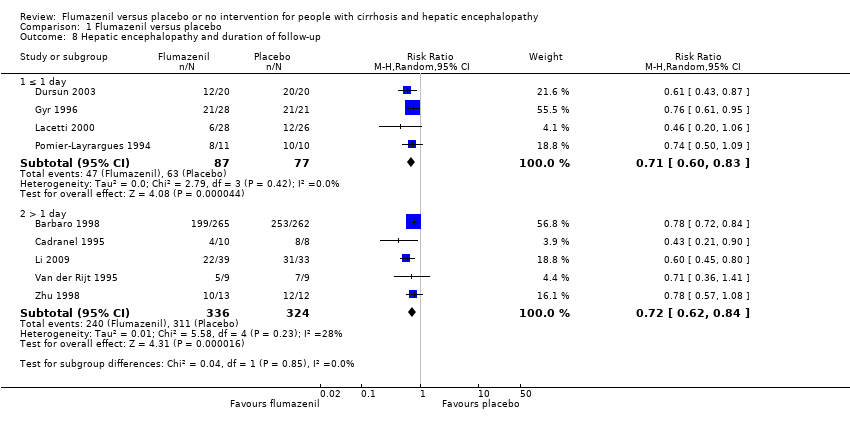
Comparison 1 Flumazenil versus placebo, Outcome 8 Hepatic encephalopathy and duration of follow‐up.

Comparison 1 Flumazenil versus placebo, Outcome 9 Hepatic encephalopathy and acute liver failure.
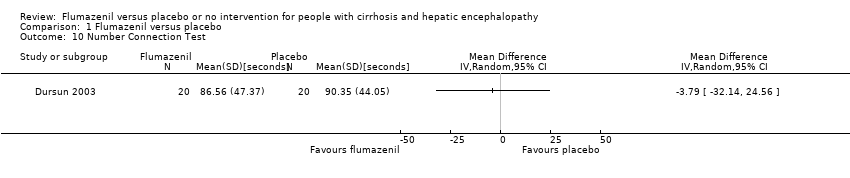
Comparison 1 Flumazenil versus placebo, Outcome 10 Number Connection Test.

Comparison 1 Flumazenil versus placebo, Outcome 11 All‐cause mortality and acute liver failure.
| Flumazenil versus placebo for people with cirrhosis and hepatic encephalopathy | ||||||
| Patient or population: people with hepatic encephalopathy Setting: hospital Intervention: flumazenil Comparison: placebo | ||||||
| Outcomes | Anticipated absolute effects* (95% CI) | Relative effect | No of participants | Quality of the evidence | Comments | |
| Risk with placebo | Risk with flumazenil | |||||
| All‐cause mortality | Study population | RR 0.75 | 842 | ⊕⊕⊝⊝ | The only RCT with low risk of bias found no effect of flumazenil on all‐cause mortality (RR 0.76, 95% CI 0.37 to 1.53). The Trial Sequential Analysis found insufficient evidence to support or refute an intervention benefit/harm. | |
| 93 per 1000 | 70 per 1000 | |||||
| Hepatic encephalopathy | Study population | RR 0.75 | 824 | ⊕⊕⊝⊝ | The only RCT with a low risk of bias reported a beneficial effect of flumazenil on hepatic encephalopathy (RR 0.78, 95% CI 0.72 to 0.84; Barbaro 1998). The Trial Sequential Analysis found that flumazenil was associated with a beneficial effect on hepatic encephalopathy (Figure 1). The methods used to assess this outcome varied considerably (Table 1) and the duration of follow‐up was very short in the majority of RCTs. | |
| 933 per 1000 | 700 per 1000 | |||||
| Serious adverse events | See comment | See comment | Not estimable | 842 | ⊕⊕⊝⊝ | All‐cause mortality was the only serious adverse event reported for both the intervention and control group (Table 6). The narrative text in 4 RCTs described that causes of death included liver failure, progressive liver disease, and infections. |
| *The risk in the intervention group (and its 95% confidence interval) is based on the assumed risk in the comparison group and the relative effect of the intervention (and its 95% CI). CI: confidence interval; RCT: randomised clinical trial; RR: risk ratio. | ||||||
| GRADE Working Group grades of evidence | ||||||
| 1 Downgraded due to risk of bias: only one RCT had a low risk of bias. 2 Downgraded due to imprecision: wide confidence intervals. | ||||||
| Trial | Type of hepatic encephalopathy | Neuropsychiatric assessment | Definition of overall improvement |
| Minimal | Number Connection Test and Brainstem Auditory Evoked Response. | Investigators did not define or assess the number of participants with an overall improvement. | |
| Overt | Mental status assessed using a clinical scale (Table 2), Modified Glasgow Coma Scale (Table 2), and electroencephalography (Table 3). | Improvement in clinical scores or electroencephalography. | |
| Overt | Mental status assessed using a clinical scale (Table 2), and electroencephalography (Table 3). | Improvement in clinical score or electroencephalography. | |
| Minimal or overt | Mental status assessed using a clinical scale (Table 2), Number Connection Test results, and electroencephalography (Table 3). | Improvement based on the clinical score and Number Connection Test results. | |
| Minimal | Number Connection Test and brainstem auditory evoked response. | Not defined. The investigators included a post‐hoc subjective assessment of alertness. | |
| Minimal | Simple and complex reaction time, verbal memory, psychomotor speed, short‐term and working memory. | Improvement in psychomotor speed evaluated using change in reaction time; Investigators did not define or assess the number of participants with overall improvement. . | |
| Overt | Mental status (Table 2), and electroencephalography (Table 3). | Clinically relevant improvement defined as a 2‐point improvement in clinical score at any time during treatment compared with baseline. The investigators also reported improvement defined using the clinical scale score (mean for all individual observations). | |
| Overt | Glasgow Coma Scale (Table 2), and electroencephalography. | A 2‐point improvement in the Glasgow Coma Score and electroencephalography. | |
| Overt | Clinical assessment (score not described). | Improvement in clinical status | |
| Overt | Mental status (scale not specified) and Glasgow Coma Scale (Table 2). | Investigators originally classified participants as Grade III to IV coma. Method of assessment not stipulated. The trial report defined 'clinically relevant improvement' as primary outcome defined as a 3‐point improvement in Glasgow Coma Score. | |
| Overt | Glasgow Coma Scale (Table 2), and electroencephalography | Improvement in the Glasgow Coma Score of ≥ 3 points. | |
| Overt | Modified Glasgow Coma Score (Table 2), and electroencephalography. | Improvement in ≥ 2 items on modified Glasgow Coma Score within 1 hour after the end of treatment. | |
| Overt | Clinical scale (Table 2). | A ≥ 1 point decrease in severity of hepatic encephalopathy. | |
| Overt | Clinical scale (Table 2). | Overall improvement in hepatic encephalopathy based on clinical grade. | |
| RCT: randomised clinical trial. | |||
| Scale (Grippon 1988) used in Cadranel 1995 ; Barbaro 1998 . | |
| I | Euphoria or depression, mild confusion, slowness, disorder in sleep rhythm. |
| II | Drowsiness, inappropriate behaviour, accentuation of stage I. |
| III | Stupor; participant sleeps most of the time but is rousable; incoherent speech; marked confusion. |
| IVa | Coma, co‐ordinated response to painful stimuli. |
| IVb | Coma, hyperextension, and pronosupination after painful stimuli. |
| IVc | Coma, no response to painful stimuli. |
| V | Clinical decerebration. |
| Scale (Fitz 1998) used in Dursun 2003 . | |
| Subclinical | Normal examination with subtle changes in psychometric or Number Connection Tests. |
| I | Impaired attention, irritability, depression, or personality changes. |
| II | Drowsiness, behavioural changes, sleep disorders, and poor memory. |
| III | Confusion, disorientation, somnolence, and amnesia. |
| Scale (Jones 1988) used in Gyr 1996 . | |
| ‐ | Clinical assessment criteria consisted of the anamnestic criterion: disorders of sleep pattern (insomnia, hypersomnia, inversion of sleep rhythm) in combination with assessment of the level of consciousness (1 to 4 as described below). Score items weighted so major disturbances of consciousness (portal systemic encephalopathy stage III and IV) were associated with scores of ≥ 11. Portal systemic encephalopathy stage II defined as scores of 5 to 10 and stage I of 3 to 4. |
| 1 | Light disturbance of consciousness if ≥ 1 of following symptoms were present: drowsiness (tendency to fall asleep but wake up spontaneously or in response to normal voice or light), intermittent or permanent disorientation, retardation of ability to perform mental tasks (serial subtractions of sevens), mood disorder, inappropriate behaviour. |
| 2 | Somnolence (arousable to physical stimuli such as mild prodding or shaking only). |
| 3 | Stupor (localised motor response to pain). |
| 4 | Coma (unarousability, no or unlocalised motor reactions to painful stimuli). |
| Scale (no reference provided in paper) used in Van der Rijt 1995 . | |
| 1 | Presence of ≥ 2 of following abnormalities: inverted sleep pattern, disturbed memory, impaired calculation (serial sevens), slowness of speech, or flapping tremor. |
| 2 | Presence of ≥ 2 of following: lethargy, time disorientation, or flapping tremor. |
| 3 | Presence of ≥ 2 of following: a state in which person had to be stimulated repetitively to open his/her eyes or execute commands, disorientation in terms of place and disorientation with respect to person. |
| 4 | Coma. |
| 1 | Trivial lack of awareness, euphoria or anxiety, shortened attention span, impaired performance of addition or subtraction. |
| 2 | Lethargy or apathy, minimal disorientation for time or place, subtle personality change, inappropriate behaviour. |
| 3 | Somnolence to semistupor, but responsive to verbal stimuli; confusion; gross disorientation. |
| 4 | Coma. |
| Glasgow Coma Scale (CGS) (Teasdale 1974) used in Hermant 1991 ; Lacetti 2000 ; Dursun 2003 ; Li 2009 . | |
| Scores | Eye opening (E):
Verbal response (V):
Motor response (M):
|
| Grading |
|
| Modified Glasgow Coma Scale (Pappas 1983) used in Pomier‐Layrargues 1994 ; Barbaro 1998 . | |
| Scores |
|
| Electroencephalography grading/Fischer classification (Nusinovici 1977 and Spehlman 1991) used in Hermant 1991 ; Pomier‐Layrargues 1994 ; Cadranel 1995 ; Barbaro 1998 . | |
| I | Irregular background activity (theta and alpha). |
| II | Continuous theta activity, bursts of delta waves. |
| III | Prevalent delta activity; polyphasic transients sharp and slow wave complexes. |
| IVa | Continuous delta activity; abundant sharp and slow wave complexes; electroencephalography reactivity present. |
| IVb | Slower activity (delta and some polyphasic transients); electroencephalography reactivity = 0. |
| IVc | Discontinuous activity with silent periods. |
| V | Flat. |
| Electroencephalography grading (Parsons‐Smith 1957) used in Dursun 2003 . | |
| A | Generalised suppression of alpha rhythm and its frequent replacement by faster potentials in all leads. The tracings in this grade are generally flat and featureless. |
| B | Alpha rhythm very unstable and disturbed by random waves at 5‐7 per second over both hemispheres. Rhythms most often seen over temporal lobes. In many cases with underlying fast activity. |
| C | Alpha rhythm still seen, but disturbed over both hemispheres by medium‐voltage 5‐6 per second waves. These occur in runs, are not paroxysmal, and do not usually block to eye opening although blocking may occur. Rhythms are particularly well seen over temporal and frontal lobes. |
| D | 5‐6 per second rhythms seen in grade C are now constant in all areas and replace all other cortical activity recorded on electroencephalogram. Appearance of this abnormality in a patient presenting with only slight neuropsychiatric symptoms is very striking. |
| E | 5 to 6 per second rhythms replaced by frontally preponderant bi‐lateral synchronous 2 per second rhythms, which spread backwards over hemispheres. At times, 6 per second rhythms might reappear, but special features of records are occurrence of these diencephalic discharges. |
| Electroencephalography grading (Kennedy 1973) used in Gyr 1996 . | |
| 0 | 8 to 12 per second basic rhythm, mean dominant frequency > 8 per second, % theta < 20. |
| 1 | Sudden shifts between normal alpha frequency (around 9 or 10 per second) and slow substitutes (6‐8 per second); mean dominant frequency > 7 per second, % theta > 35. |
| 2 | Diffuse slow activity posterior alpha rhythm seen occasionally, mean dominant frequency 5 to 7 per second, % theta > 60. |
| 3 | Dominant slow activity in all areas, mean dominant frequency 3 to 5 per second, % delta 70. |
| 4 | Bilaterally synchronous, 2‐3 per second waves, predominating over frontal lobes and spreading backwards to occipital lobes; occasional short‐lived appearance of faster rhythms (5 or 6 per second) or voltage depression, mean dominant frequency < 3 per second, % delta 70. |
| Electroencephalography grading (Markand 1984) used in Van der Rijt 1995 . | |
| 0 | Background activity consisting of alpha rhythm. |
| 1 | Alpha rhythm with some scattered theta waves. |
| 2 | Background activity of theta activity intermixed with some delta and alpha frequencies. |
| 3 | Background of delta polymorphic activity of high amplitude with spontaneous variability. |
| 4 | Delta activity of relatively small amplitude. |
| Trial | Participants (n) | Precipitating factors (n) |
| 527 | Gastrointestinal bleeding (352), surgery (95), sepsis (45), dehydration (6), unknown (29). | |
| 14 | Gastrointestinal bleeding (4), sepsis (7), alcoholic hepatitis (3), portal vein thrombosis (1), viral hepatitis (1), unknown (2). | |
| 54 | Gastrointestinal bleeding (31), sepsis (7), drugs (11), surgery (1). | |
| 21 | Gastrointestinal bleeding (7), sepsis (2), dehydration (1), surgery (2), none (9), portacaval shunting (4). | |
| 18 | Hepatitis (5), acute exacerbation in cirrhosis (2), partial hepatectomy (1). | |
| 25 | Gastrointestinal bleeding (13), protein overload (6), infection (2), wounds (1), unknown (3). | |
| n: number of participants. | ||
| Trial | Required period free of benzodiazepines before inclusion | Baseline screening for benzodiazepines | Screening method and detection level | Negative testing at baseline an inclusion criterion | Proportion testing positive for benzodiazepines at baseline |
| 2 weeks | Yes |
| No | 0% | |
| 4 days | Yes |
| No | 1.9% | |
| Not reported | Yes |
| No | 21.4% | |
| 3 days | No | Not reported | Not reported | Not reported | |
| 3 months | Yes |
| No | 0% | |
| 1 month | No | Not reported | Not reported | Not reported | |
| Yes, but length not specified | Yes |
Post‐hoc analysis
| No | 8.2% on screening tests Flumazenil 11%; placebo 5% 12/49 samples for more sensitive testing lost | |
| Not reported | Yes | Not reported | Yes | 0% | |
| Not reported | No | Not reported | Not reported | Not reported | |
| 2 weeks | Yes |
Post‐hoc analysis
| Yes | 0% | |
| Not reported | No | Not reported | N/A | N/A | |
| 3 days | Yes |
Post‐hoc analysis
| No | 19% | |
| Recent | Yes |
| Yes | 0% | |
| 7 days | No | Not reported | Not reported | Not reported |
| Trial | Number of participants | Included in analyses of serious adverse events | Data included in primary analysis | Serious adverse events |
| 13 | No | Cross‐over RCT. Data from the first treatment period not described. | Publication does not describe any deaths or other serious adverse events. | |
| 527 | Yes | Cross‐over RCT. Data from the first treatment period included. | Thirteen non‐responders in the flumazenil group and 17 non responders in the placebo group died 3 to 4 days (range 2‐6) after randomisation. The causes of dead were septic shock (20 participants); hypovolaemic shock (8 participants) and lactic acidosis (2 participants) but information was not provided on the number of deaths by cause in each group. | |
| 14 | Yes | Cross‐over RCT. Data from the first treatment period included. | One of 12 responders died from septic shock on day 4 and 2 of 6 non‐responders died from septic shock (day 2) and lactic acidosis (day 4) but information is not provided on the groups to which they a were allocated. | |
| 40 | Yes | Parallel‐arm RCT. We included all participants in the analyses. | Publication did not describe any deaths or other serious adverse events. | |
| 10 | No | Cross‐over RCT. Data from the first treatment period not described. | Publication did not describe any deaths or other serious adverse events. | |
| 10 | Yes | Cross‐over RCT. Data from the first treatment period included. | Publication did not describe any deaths or other serious adverse events. | |
| 49 | Yes | Parallel‐arm RCT. We included all participants in the analyses. | Four of 28 participants allocated to flumazenil and 5 of 21 allocated to placebo died within 4 weeks of the trial. One participant in the placebo group died with respiratory failure during the course of the study. The authors described participants as having severe liver disease suggesting that the cause of death in the remaining 8 participants may have been cirrhosis‐related although this is not specifically stated. The investigators classified the remaining adverse events viz flushing, nausea, vomiting, and irritability, which were experienced by 4 participants, as non‐serious. | |
| 12 | Yes | Parallel‐arm RCT. We included all participants in the analyses. | Publication did not describe any deaths or other serious adverse events. | |
| 2 | No | Cross‐over RCT. Data from the first treatment period were not described. | Publication does not describe any deaths or other serious adverse events. | |
| 54 | Yes | Parallel‐arm RCT. We include all participants in the analyses. | Six of 28 participants in the flumazenil group and 5 of 26 in the control group died. The causes of death were not provided. | |
| 72 | Yes | Parallel‐arm RCT. The included participants had hepatic encephalopathy associated with cirrhosis or acute liver failure. Data were not provide separately for the 2 groups. | Five of 39 participants in the flumazenil group and 4 of 33 participants in the control group died. The causes of death were not provided. | |
| 21 | Yes | Cross‐over RCT. Data from the first treatment period were included. | Publication did not describe any deaths or other serious adverse events. | |
| 18 | Yes | Cross‐over RCT. The included participants had hepatic encephalopathy associated with cirrhosis or acute liver failure. Data were not provide separately for the 2 groups. Data from the first treatment period were included. | Publication did not describe any deaths or other serious adverse events. Two participants with fulminant hepatic failure underwent orthotopic liver transplantation on day 1 of the study. | |
| 25 | Yes | Parallel‐arm RCT. We included all participants in the analyses. | Three of 13 participants in the flumazenil group and 5 of 12 participants in the control group died. The causes of death were not provided. | |
| RCT: randomised clinical trial. | ||||
| Outcome or subgroup title | No. of studies | No. of participants | Statistical method | Effect size |
| 1 All‐cause mortality Show forest plot | 11 | 842 | Risk Ratio (M‐H, Random, 95% CI) | 0.75 [0.48, 1.16] |
| 1.1 Overt hepatic encephalopathy | 10 | 822 | Risk Ratio (M‐H, Random, 95% CI) | 0.75 [0.48, 1.16] |
| 1.2 Minimal hepatic encephalopathy | 2 | 20 | Risk Ratio (M‐H, Random, 95% CI) | 0.0 [0.0, 0.0] |
| 2 All‐cause mortality and bias control Show forest plot | 12 | 844 | Risk Ratio (M‐H, Random, 95% CI) | 0.75 [0.48, 1.16] |
| 2.1 Low risk of bias | 1 | 527 | Risk Ratio (M‐H, Random, 95% CI) | 0.76 [0.37, 1.53] |
| 2.2 High risk of bias | 11 | 317 | Risk Ratio (M‐H, Random, 95% CI) | 0.75 [0.43, 1.31] |
| 3 All‐cause mortality and trial design Show forest plot | 12 | Risk Ratio (M‐H, Random, 95% CI) | Subtotals only | |
| 3.1 Cross‐over | 6 | 592 | Risk Ratio (M‐H, Random, 95% CI) | 0.69 [0.35, 1.34] |
| 3.2 Parallel‐arm | 6 | 252 | Risk Ratio (M‐H, Random, 95% CI) | 0.81 [0.45, 1.44] |
| 4 All‐cause mortality and duration of follow‐up Show forest plot | 11 | Risk Ratio (M‐H, Random, 95% CI) | Subtotals only | |
| 4.1 ≤ 1 day | 5 | 176 | Risk Ratio (M‐H, Random, 95% CI) | 0.85 [0.38, 1.87] |
| 4.2 > 1 day | 6 | 666 | Risk Ratio (M‐H, Random, 95% CI) | 0.71 [0.42, 1.21] |
| 5 Hepatic encephalopathy Show forest plot | 9 | 824 | Risk Ratio (M‐H, Random, 95% CI) | 0.75 [0.71, 0.80] |
| 5.1 Overt hepatic encephalopathy | 9 | 814 | Risk Ratio (M‐H, Random, 95% CI) | 0.73 [0.67, 0.80] |
| 5.2 Minimal hepatic encephalopathy | 1 | 10 | Risk Ratio (M‐H, Random, 95% CI) | 0.75 [0.41, 1.39] |
| 6 Hepatic encephalopathy and bias control Show forest plot | 9 | 824 | Risk Ratio (M‐H, Random, 95% CI) | 0.75 [0.71, 0.80] |
| 6.1 Low risk of bias | 1 | 527 | Risk Ratio (M‐H, Random, 95% CI) | 0.78 [0.72, 0.84] |
| 6.2 High risk of bias | 8 | 297 | Risk Ratio (M‐H, Random, 95% CI) | 0.69 [0.61, 0.78] |
| 7 Hepatic encephalopathy and trial design Show forest plot | 9 | Risk Ratio (M‐H, Random, 95% CI) | Subtotals only | |
| 7.1 Cross‐over | 4 | 584 | Risk Ratio (M‐H, Random, 95% CI) | 0.77 [0.72, 0.83] |
| 7.2 Parallel‐arm | 5 | 240 | Risk Ratio (M‐H, Random, 95% CI) | 0.69 [0.59, 0.79] |
| 8 Hepatic encephalopathy and duration of follow‐up Show forest plot | 9 | Risk Ratio (M‐H, Random, 95% CI) | Subtotals only | |
| 8.1 ≤ 1 day | 4 | 164 | Risk Ratio (M‐H, Random, 95% CI) | 0.71 [0.60, 0.83] |
| 8.2 > 1 day | 5 | 660 | Risk Ratio (M‐H, Random, 95% CI) | 0.72 [0.62, 0.84] |
| 9 Hepatic encephalopathy and acute liver failure Show forest plot | 9 | Risk Ratio (M‐H, Random, 95% CI) | Subtotals only | |
| 9.1 Cirrhosis | 7 | 734 | Risk Ratio (M‐H, Random, 95% CI) | 0.76 [0.71, 0.82] |
| 9.2 Acute liver failure or cirrhosis | 2 | 90 | Risk Ratio (M‐H, Random, 95% CI) | 0.62 [0.47, 0.80] |
| 10 Number Connection Test Show forest plot | 1 | Mean Difference (IV, Random, 95% CI) | Totals not selected | |
| 11 All‐cause mortality and acute liver failure Show forest plot | 11 | 842 | Risk Ratio (M‐H, Random, 95% CI) | 0.75 [0.48, 1.16] |
| 11.1 Participants with cirrhosis | 9 | 752 | Risk Ratio (M‐H, Random, 95% CI) | 0.71 [0.45, 1.14] |
| 11.2 Participants with cirrhosis or acute liver failure | 2 | 90 | Risk Ratio (M‐H, Random, 95% CI) | 1.06 [0.31, 3.62] |