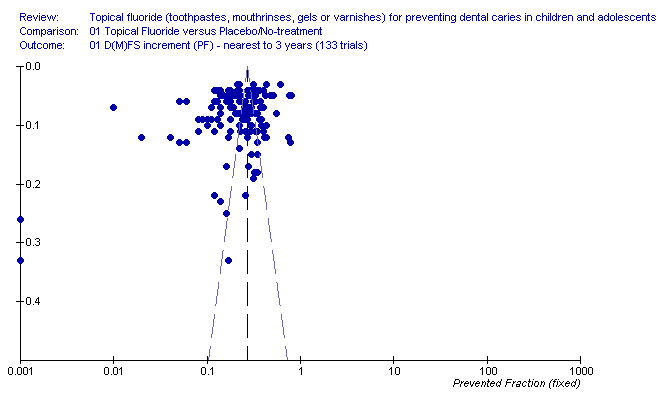
| 1 D(M)FS increment (PF) ‐ nearest to 3 years (133 trials) Show forest plot | 133 | 65179 | Prevented Fraction (Random, 95% CI) | 0.26 [0.23, 0.29] |
|
| 1.1 Fluoride toothpaste versus placebo | 70 | 41796 | Prevented Fraction (Random, 95% CI) | 0.24 [0.21, 0.28] |
| 1.2 Fluoride gel versus placebo | 13 | 4142 | Prevented Fraction (Random, 95% CI) | 0.21 [0.14, 0.28] |
| 1.3 Fluoride varnish versus placebo | 3 | 1654 | Prevented Fraction (Random, 95% CI) | 0.40 [0.09, 0.72] |
| 1.4 Fluoride mouthrinse versus placebo | 30 | 13324 | Prevented Fraction (Random, 95% CI) | 0.26 [0.22, 0.29] |
| 1.5 Fluoride gel versus no‐treatment | 9 | 2677 | Prevented Fraction (Random, 95% CI) | 0.38 [0.23, 0.53] |
| 1.6 Fluoride varnish versus no‐treatment | 4 | 624 | Prevented Fraction (Random, 95% CI) | 0.52 [0.35, 0.69] |
| 1.7 Fluoride mouthrinse versus no‐treatment | 4 | 962 | Prevented Fraction (Random, 95% CI) | 0.33 [0.27, 0.40] |
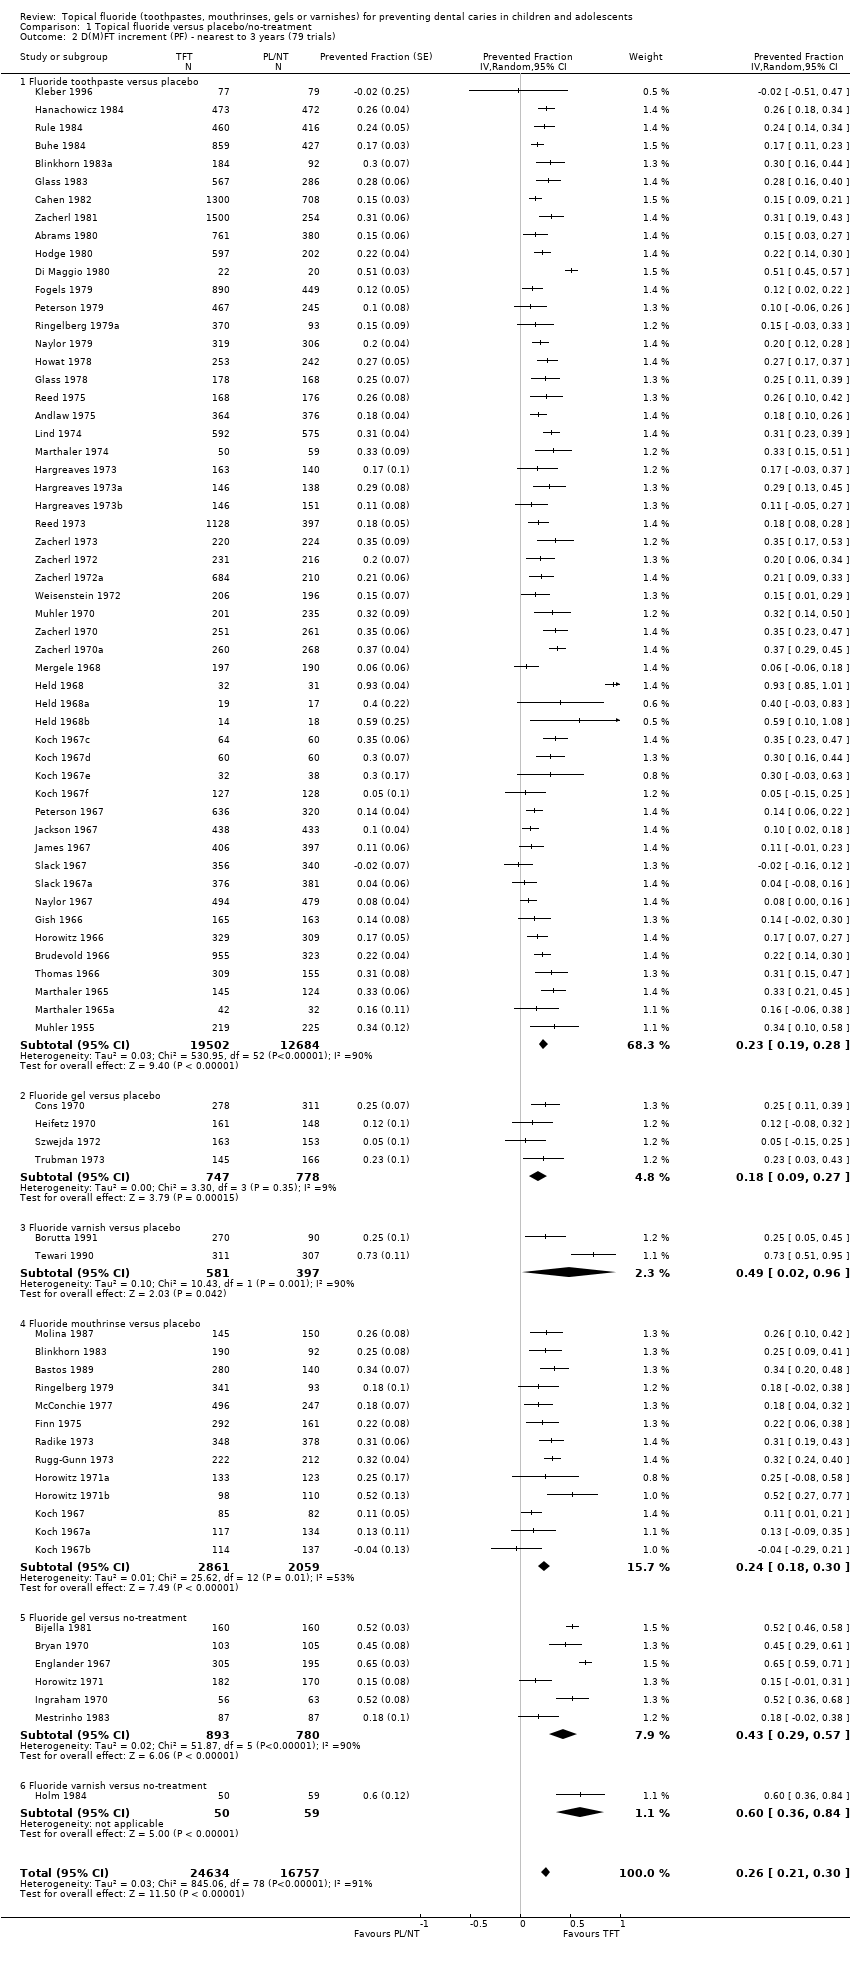
| 2 D(M)FT increment (PF) ‐ nearest to 3 years (79 trials) Show forest plot | 79 | 41391 | Prevented Fraction (Random, 95% CI) | 0.26 [0.21, 0.30] |
|
| 2.1 Fluoride toothpaste versus placebo | 53 | 32186 | Prevented Fraction (Random, 95% CI) | 0.23 [0.19, 0.28] |
| 2.2 Fluoride gel versus placebo | 4 | 1525 | Prevented Fraction (Random, 95% CI) | 0.18 [0.09, 0.27] |
| 2.3 Fluoride varnish versus placebo | 2 | 978 | Prevented Fraction (Random, 95% CI) | 0.49 [0.02, 0.96] |
| 2.4 Fluoride mouthrinse versus placebo | 13 | 4920 | Prevented Fraction (Random, 95% CI) | 0.24 [0.18, 0.30] |
| 2.5 Fluoride gel versus no‐treatment | 6 | 1673 | Prevented Fraction (Random, 95% CI) | 0.43 [0.29, 0.57] |
| 2.6 Fluoride varnish versus no‐treatment | 1 | 109 | Prevented Fraction (Random, 95% CI) | 0.6 [0.36, 0.84] |
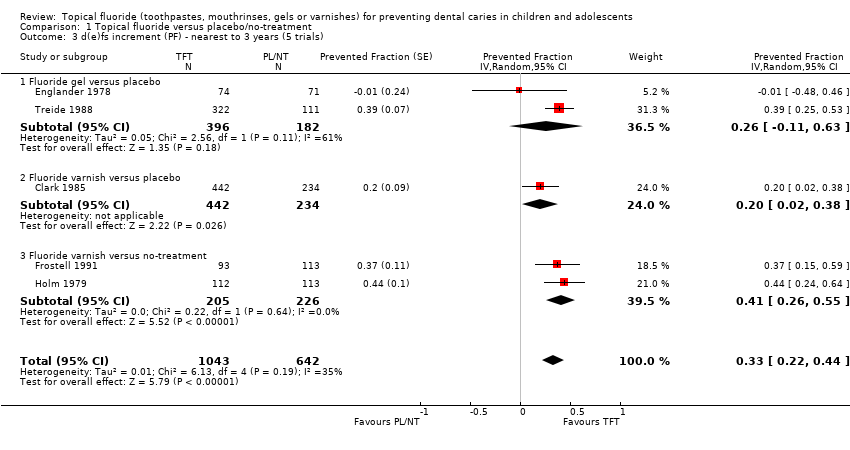
| 3 d(e)fs increment (PF) ‐ nearest to 3 years (5 trials) Show forest plot | 5 | 1685 | Prevented Fraction (Random, 95% CI) | 0.33 [0.22, 0.44] |
|
| 3.1 Fluoride gel versus placebo | 2 | 578 | Prevented Fraction (Random, 95% CI) | 0.26 [‐0.11, 0.63] |
| 3.2 Fluoride varnish versus placebo | 1 | 676 | Prevented Fraction (Random, 95% CI) | 0.2 [0.02, 0.38] |
| 3.3 Fluoride varnish versus no‐treatment | 2 | 431 | Prevented Fraction (Random, 95% CI) | 0.41 [0.26, 0.55] |
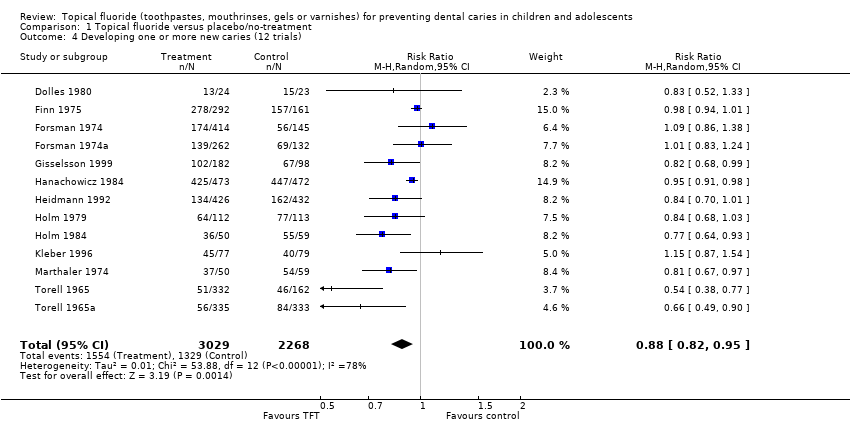
| 4 Developing one or more new caries (12 trials) Show forest plot | 13 | 5297 | Risk Ratio (M‐H, Random, 95% CI) | 0.88 [0.82, 0.95] |
|
| 5 Unacceptability of treatment as measured by leaving study early (10 trials) Show forest plot | 10 | 2897 | Risk Ratio (M‐H, Random, 95% CI) | 1.20 [0.85, 1.70] |
|