| 1 Mortality at discharge or 40‐41 weeks' postmenstrual age Show forest plot | 7 | | Risk Ratio (M‐H, Fixed, 95% CI) | Subtotals only |
|
| 1.1 All studies | 7 | 1614 | Risk Ratio (M‐H, Fixed, 95% CI) | 0.60 [0.39, 0.93] |
| 1.2 Intermittent KMC | 4 | 497 | Risk Ratio (M‐H, Fixed, 95% CI) | 0.60 [0.20, 1.85] |
| 1.3 Continuous KMC | 3 | 1117 | Risk Ratio (M‐H, Fixed, 95% CI) | 0.60 [0.38, 0.96] |
| 1.4 Infant age ≤10 days at initiation of KMC | 5 | 1426 | Risk Ratio (M‐H, Fixed, 95% CI) | 0.57 [0.36, 0.89] |
| 1.5 Infant age >10 days at initiation of KMC | 2 | 188 | Risk Ratio (M‐H, Fixed, 95% CI) | 1.32 [0.22, 7.73] |
| 1.6 Low/middle income countries | 6 | 1554 | Risk Ratio (M‐H, Fixed, 95% CI) | 0.58 [0.37, 0.90] |
| 1.7 High income countries | 1 | 60 | Risk Ratio (M‐H, Fixed, 95% CI) | 1.64 [0.16, 17.09] |
| 1.8 infant entered into trial before stabilization | 1 | 123 | Risk Ratio (M‐H, Fixed, 95% CI) | 0.57 [0.33, 1.00] |
| 1.9 infant entered into trial after stabilization | 6 | 1491 | Risk Ratio (M‐H, Fixed, 95% CI) | 0.63 [0.32, 1.24] |
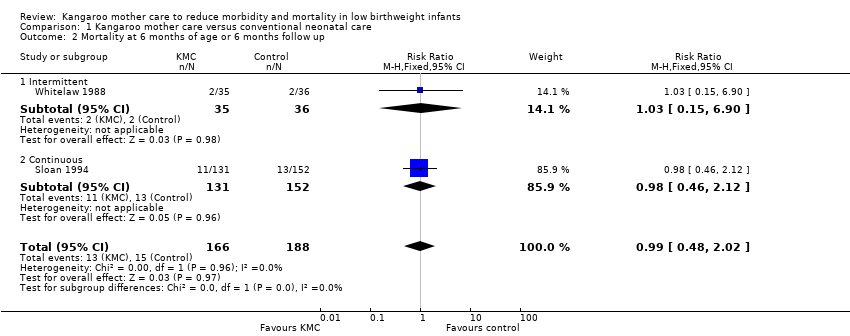
| 2 Mortality at 6 months of age or 6 months follow up Show forest plot | 2 | 354 | Risk Ratio (M‐H, Fixed, 95% CI) | 0.99 [0.48, 2.02] |
|
| 2.1 Intermittent | 1 | 71 | Risk Ratio (M‐H, Fixed, 95% CI) | 1.03 [0.15, 6.90] |
| 2.2 Continuous | 1 | 283 | Risk Ratio (M‐H, Fixed, 95% CI) | 0.98 [0.46, 2.12] |
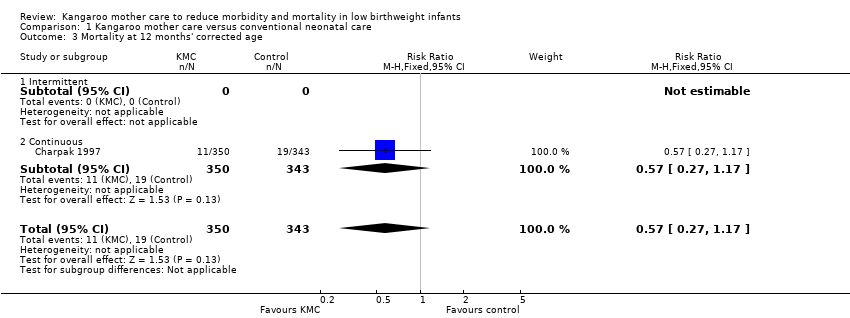
| 3 Mortality at 12 months' corrected age Show forest plot | 1 | 693 | Risk Ratio (M‐H, Fixed, 95% CI) | 0.57 [0.27, 1.17] |
|
| 3.1 Intermittent | 0 | 0 | Risk Ratio (M‐H, Fixed, 95% CI) | 0.0 [0.0, 0.0] |
| 3.2 Continuous | 1 | 693 | Risk Ratio (M‐H, Fixed, 95% CI) | 0.57 [0.27, 1.17] |
| 4 Mortality at latest follow up Show forest plot | 9 | | Risk Ratio (M‐H, Fixed, 95% CI) | Subtotals only |
|
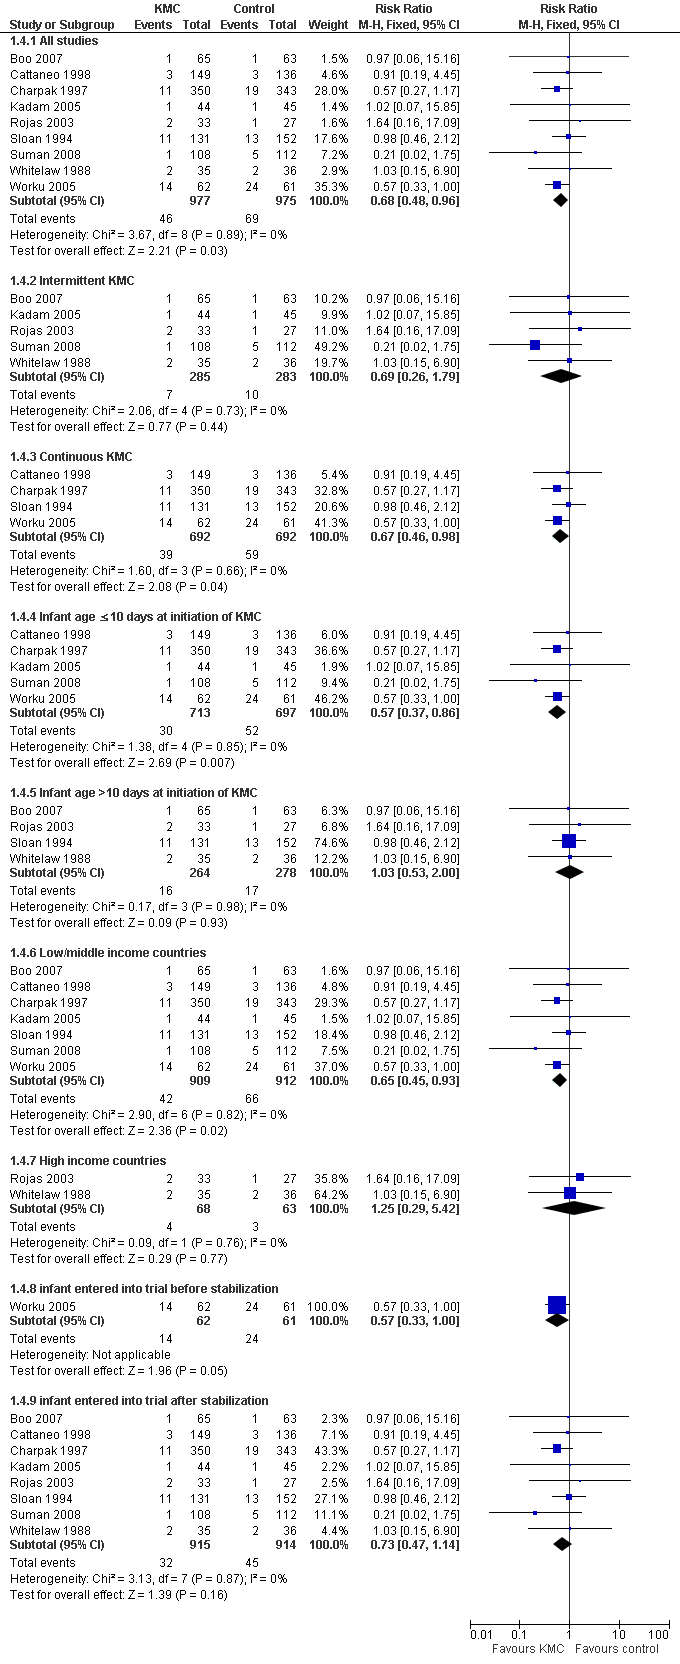
| 4.1 All studies | 9 | 1952 | Risk Ratio (M‐H, Fixed, 95% CI) | 0.68 [0.48, 0.96] |
| 4.2 Intermittent KMC | 5 | 568 | Risk Ratio (M‐H, Fixed, 95% CI) | 0.69 [0.26, 1.79] |
| 4.3 Continuous KMC | 4 | 1384 | Risk Ratio (M‐H, Fixed, 95% CI) | 0.67 [0.46, 0.98] |
| 4.4 Infant age ≤10 days at initiation of KMC | 5 | 1410 | Risk Ratio (M‐H, Fixed, 95% CI) | 0.57 [0.37, 0.86] |
| 4.5 Infant age >10 days at initiation of KMC | 4 | 542 | Risk Ratio (M‐H, Fixed, 95% CI) | 1.03 [0.53, 2.00] |
| 4.6 Low/middle income countries | 7 | 1821 | Risk Ratio (M‐H, Fixed, 95% CI) | 0.65 [0.45, 0.93] |
| 4.7 High income countries | 2 | 131 | Risk Ratio (M‐H, Fixed, 95% CI) | 1.25 [0.29, 5.42] |
| 4.8 infant entered into trial before stabilization | 1 | 123 | Risk Ratio (M‐H, Fixed, 95% CI) | 0.57 [0.33, 1.00] |
| 4.9 infant entered into trial after stabilization | 8 | 1829 | Risk Ratio (M‐H, Fixed, 95% CI) | 0.73 [0.47, 1.14] |
| 5 Severe infection/sepsis at latest follow up ‐ stabilized infants Show forest plot | 6 | 1250 | Risk Ratio (M‐H, Fixed, 95% CI) | 0.57 [0.40, 0.80] |
|
| 5.1 Intermittent | 5 | 587 | Risk Ratio (M‐H, Fixed, 95% CI) | 0.46 [0.28, 0.76] |
| 5.2 Continuous | 1 | 663 | Risk Ratio (M‐H, Fixed, 95% CI) | 0.69 [0.43, 1.12] |
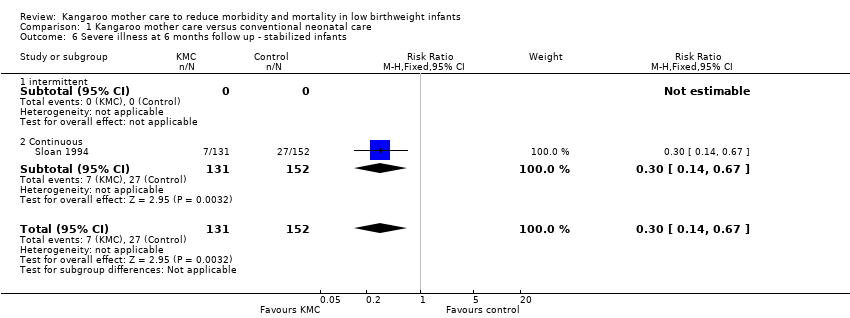
| 6 Severe illness at 6 months follow up ‐ stabilized infants Show forest plot | 1 | 283 | Risk Ratio (M‐H, Fixed, 95% CI) | 0.30 [0.14, 0.67] |
|
| 6.1 intermittent | 0 | 0 | Risk Ratio (M‐H, Fixed, 95% CI) | 0.0 [0.0, 0.0] |
| 6.2 Continuous | 1 | 283 | Risk Ratio (M‐H, Fixed, 95% CI) | 0.30 [0.14, 0.67] |
| 7 Nosocomial infection/sepsis at discharge or 40‐41 weeks' postmenstrual age ‐ stabilized infants Show forest plot | 2 | 777 | Risk Ratio (M‐H, Fixed, 95% CI) | 0.42 [0.24, 0.73] |
|
| 7.1 Intermittent | 1 | 114 | Risk Ratio (M‐H, Fixed, 95% CI) | 0.30 [0.10, 0.86] |
| 7.2 Continuous | 1 | 663 | Risk Ratio (M‐H, Fixed, 95% CI) | 0.49 [0.25, 0.93] |
| 8 Mild/moderate infection or illness at latest follow up ‐ stabilized infants Show forest plot | 4 | 1266 | Risk Ratio (M‐H, Random, 95% CI) | 1.28 [0.87, 1.88] |
|
| 8.1 Intermittent | 2 | 320 | Risk Ratio (M‐H, Random, 95% CI) | 1.52 [0.43, 5.38] |
| 8.2 Continuous | 2 | 946 | Risk Ratio (M‐H, Random, 95% CI) | 1.42 [0.53, 3.79] |
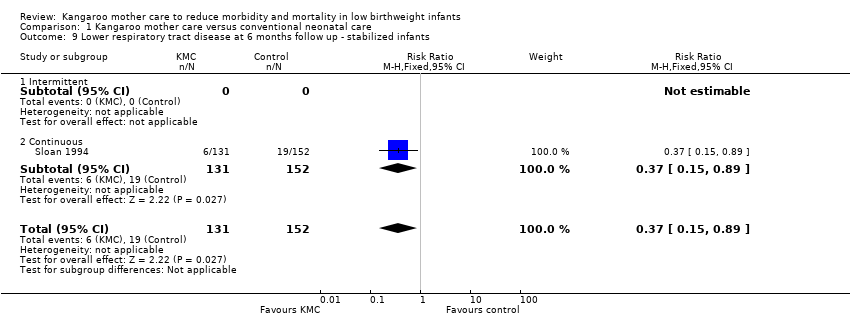
| 9 Lower respiratory tract disease at 6 months follow up ‐ stabilized infants Show forest plot | 1 | 283 | Risk Ratio (M‐H, Fixed, 95% CI) | 0.37 [0.15, 0.89] |
|
| 9.1 Intermittent | 0 | 0 | Risk Ratio (M‐H, Fixed, 95% CI) | 0.0 [0.0, 0.0] |
| 9.2 Continuous | 1 | 283 | Risk Ratio (M‐H, Fixed, 95% CI) | 0.37 [0.15, 0.89] |
| 10 Diarrhea at 6 months follow up ‐ stabilized infants Show forest plot | 1 | 283 | Risk Ratio (M‐H, Fixed, 95% CI) | 0.65 [0.35, 1.20] |
|
| 10.1 Intermittent | 0 | 0 | Risk Ratio (M‐H, Fixed, 95% CI) | 0.0 [0.0, 0.0] |
| 10.2 Continuous | 1 | 283 | Risk Ratio (M‐H, Fixed, 95% CI) | 0.65 [0.35, 1.20] |
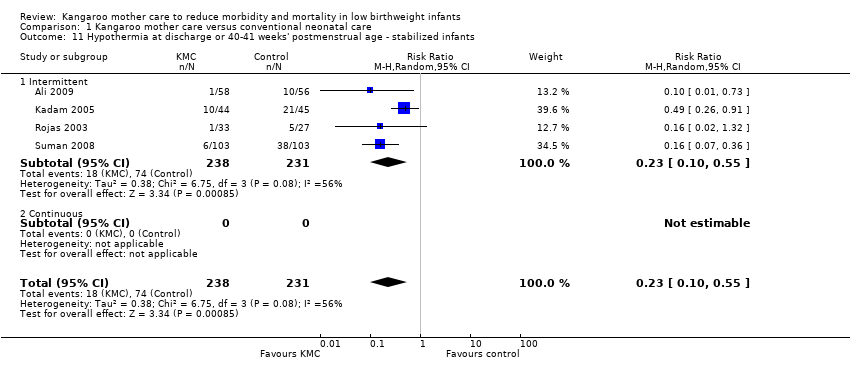
| 11 Hypothermia at discharge or 40‐41 weeks' postmenstrual age ‐ stabilized infants Show forest plot | 4 | 469 | Risk Ratio (M‐H, Random, 95% CI) | 0.23 [0.10, 0.55] |
|
| 11.1 Intermittent | 4 | 469 | Risk Ratio (M‐H, Random, 95% CI) | 0.23 [0.10, 0.55] |
| 11.2 Continuous | 0 | 0 | Risk Ratio (M‐H, Random, 95% CI) | 0.0 [0.0, 0.0] |
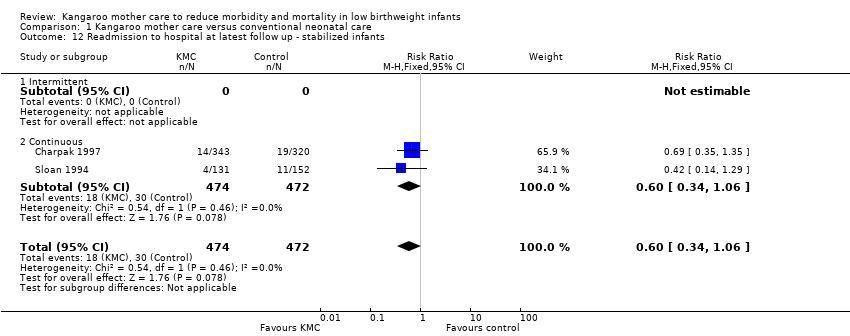
| 12 Readmission to hospital at latest follow up ‐ stabilized infants Show forest plot | 2 | 946 | Risk Ratio (M‐H, Fixed, 95% CI) | 0.60 [0.34, 1.06] |
|
| 12.1 Intermittent | 0 | 0 | Risk Ratio (M‐H, Fixed, 95% CI) | 0.0 [0.0, 0.0] |
| 12.2 Continuous | 2 | 946 | Risk Ratio (M‐H, Fixed, 95% CI) | 0.60 [0.34, 1.06] |
| 13 Weight gain at latest follow up (g/day) ‐ stabilized infants Show forest plot | 9 | 936 | Mean Difference (IV, Random, 95% CI) | 3.86 [1.87, 5.84] |
|
| 13.1 Intermittent | 8 | 651 | Mean Difference (IV, Random, 95% CI) | 3.87 [1.67, 6.08] |
| 13.2 Continuous | 1 | 285 | Mean Difference (IV, Random, 95% CI) | 3.60 [0.78, 6.42] |
| 14 Weight at discharge or 40‐41 weeks' postmenstrual age (g) ‐ stabilized infants Show forest plot | 4 | 1097 | Mean Difference (IV, Fixed, 95% CI) | 21.65 [‐15.98, 59.27] |
|
| 14.1 Intermittent | 2 | 149 | Mean Difference (IV, Fixed, 95% CI) | 63.54 [‐2.58, 129.67] |
| 14.2 Continuous | 2 | 948 | Mean Difference (IV, Fixed, 95% CI) | 1.59 [‐44.16, 47.34] |
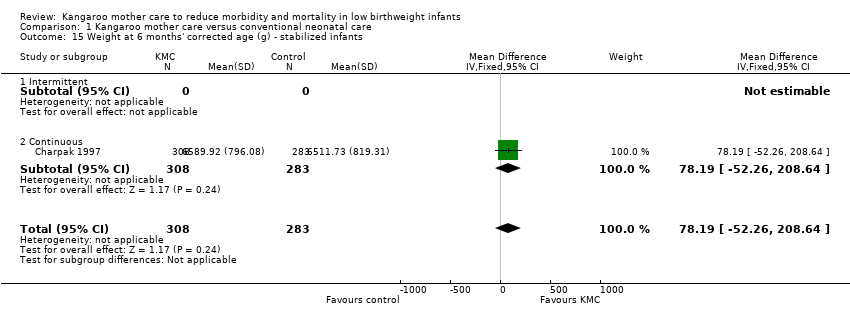
| 15 Weight at 6 months' corrected age (g) ‐ stabilized infants Show forest plot | 1 | 591 | Mean Difference (IV, Fixed, 95% CI) | 78.19 [‐52.26, 208.64] |
|
| 15.1 Intermittent | 0 | 0 | Mean Difference (IV, Fixed, 95% CI) | 0.0 [0.0, 0.0] |
| 15.2 Continuous | 1 | 591 | Mean Difference (IV, Fixed, 95% CI) | 78.19 [‐52.26, 208.64] |
| 16 Weight at 12 months' corrected age (g) ‐ stabilized infants Show forest plot | 1 | 596 | Mean Difference (IV, Fixed, 95% CI) | 31.46 [‐135.08, 198.00] |
|
| 16.1 Intermittent | 0 | 0 | Mean Difference (IV, Fixed, 95% CI) | 0.0 [0.0, 0.0] |
| 16.2 Continuous | 1 | 596 | Mean Difference (IV, Fixed, 95% CI) | 31.46 [‐135.08, 198.00] |
| 17 Length gain at latest follow up (cm/week) ‐ stabilized infants Show forest plot | 2 | 251 | Mean Difference (IV, Fixed, 95% CI) | 0.29 [0.27, 0.31] |
|
| 17.1 Intermittent | 2 | 251 | Mean Difference (IV, Fixed, 95% CI) | 0.29 [0.27, 0.31] |
| 17.2 Continuous | 0 | 0 | Mean Difference (IV, Fixed, 95% CI) | 0.0 [0.0, 0.0] |
| 18 Length at discharge or 40‐41 weeks' postmenstrual age (cm) ‐ stabilized infants Show forest plot | 2 | 720 | Mean Difference (IV, Fixed, 95% CI) | 0.06 [‐0.28, 0.39] |
|
| 18.1 Intermittent | 1 | 57 | Mean Difference (IV, Fixed, 95% CI) | 0.40 [‐0.48, 1.28] |
| 18.2 Continuous | 1 | 663 | Mean Difference (IV, Fixed, 95% CI) | 0.0 [‐0.36, 0.36] |
| 19 Length at 6 months' corrected age (cm) ‐ stabilized infants Show forest plot | 1 | 590 | Mean Difference (IV, Fixed, 95% CI) | 0.23 [‐0.18, 0.64] |
|
| 19.1 Intermittent | 0 | 0 | Mean Difference (IV, Fixed, 95% CI) | 0.0 [0.0, 0.0] |
| 19.2 Continuous | 1 | 590 | Mean Difference (IV, Fixed, 95% CI) | 0.23 [‐0.18, 0.64] |
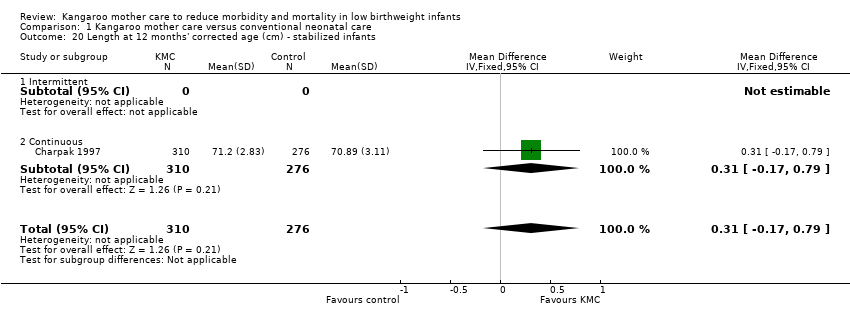
| 20 Length at 12 months' corrected age (cm) ‐ stabilized infants Show forest plot | 1 | 586 | Mean Difference (IV, Fixed, 95% CI) | 0.31 [‐0.17, 0.79] |
|
| 20.1 Intermittent | 0 | 0 | Mean Difference (IV, Fixed, 95% CI) | 0.0 [0.0, 0.0] |
| 20.2 Continuous | 1 | 586 | Mean Difference (IV, Fixed, 95% CI) | 0.31 [‐0.17, 0.79] |
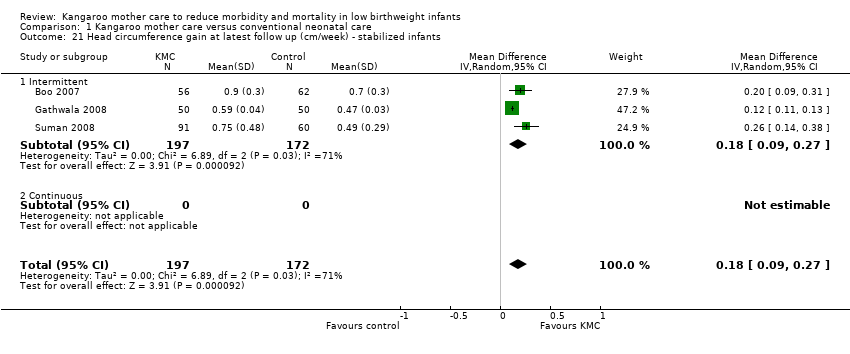
| 21 Head circumference gain at latest follow up (cm/week) ‐ stabilized infants Show forest plot | 3 | 369 | Mean Difference (IV, Random, 95% CI) | 0.18 [0.09, 0.27] |
|
| 21.1 Intermittent | 3 | 369 | Mean Difference (IV, Random, 95% CI) | 0.18 [0.09, 0.27] |
| 21.2 Continuous | 0 | 0 | Mean Difference (IV, Random, 95% CI) | 0.0 [0.0, 0.0] |
| 22 Head circumference at discharge or 40‐41 weeks' postmenstrual age (cm) ‐ stabilized infants Show forest plot | 2 | 720 | Mean Difference (IV, Random, 95% CI) | 0.39 [‐0.28, 1.07] |
|
| 22.1 Intermittent | 1 | 57 | Mean Difference (IV, Random, 95% CI) | 0.80 [0.20, 1.40] |
| 22.2 Continuous | 1 | 663 | Mean Difference (IV, Random, 95% CI) | 0.10 [‐0.14, 0.34] |
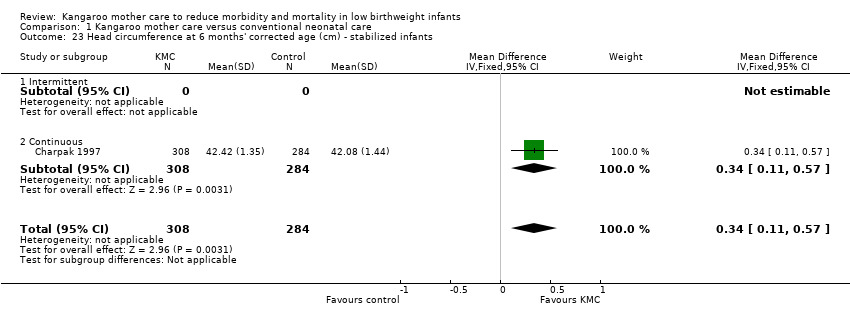
| 23 Head circumference at 6 months' corrected age (cm) ‐ stabilized infants Show forest plot | 1 | 592 | Mean Difference (IV, Fixed, 95% CI) | 0.34 [0.11, 0.57] |
|
| 23.1 Intermittent | 0 | 0 | Mean Difference (IV, Fixed, 95% CI) | 0.0 [0.0, 0.0] |
| 23.2 Continuous | 1 | 592 | Mean Difference (IV, Fixed, 95% CI) | 0.34 [0.11, 0.57] |
| 24 Head circumference at 12 months' corrected age (cm) ‐ stabilized infants Show forest plot | 1 | 597 | Mean Difference (IV, Fixed, 95% CI) | 0.39 [‐0.00, 0.78] |
|
| 24.1 Intermittent | 0 | 0 | Mean Difference (IV, Fixed, 95% CI) | 0.0 [0.0, 0.0] |
| 24.2 Continuous | 1 | 597 | Mean Difference (IV, Fixed, 95% CI) | 0.39 [‐0.00, 0.78] |
| 25 Psychomotor development (Griffith quotients) at 12 months' corrected age Show forest plot | 1 | | Mean Difference (IV, Fixed, 95% CI) | Subtotals only |
|
| 25.1 Locomotion | 1 | 579 | Mean Difference (IV, Fixed, 95% CI) | 2.25 [‐0.45, 4.95] |
| 25.2 Personal, social | 1 | 579 | Mean Difference (IV, Fixed, 95% CI) | 0.97 [‐1.27, 3.21] |
| 25.3 Hand‐eye coordination | 1 | 579 | Mean Difference (IV, Fixed, 95% CI) | 0.57 [‐1.25, 2.39] |
| 25.4 Audition, language | 1 | 579 | Mean Difference (IV, Fixed, 95% CI) | 1.29 [‐0.98, 3.56] |
| 25.5 Execution | 1 | 579 | Mean Difference (IV, Fixed, 95% CI) | 0.30 [‐1.50, 2.10] |
| 25.6 All criteria | 1 | 579 | Mean Difference (IV, Fixed, 95% CI) | 1.05 [‐0.75, 2.85] |
| 26 Cerebral palsy at 12 months' corrected age Show forest plot | 1 | 588 | Risk Ratio (M‐H, Fixed, 95% CI) | 0.65 [0.21, 2.02] |
|
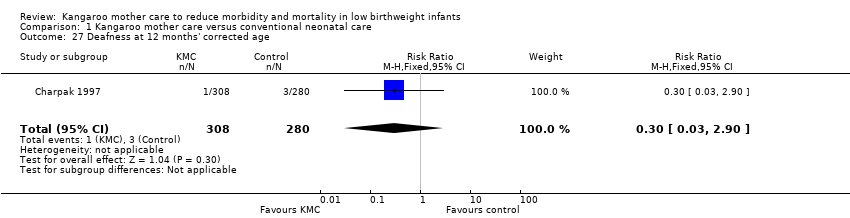
| 27 Deafness at 12 months' corrected age Show forest plot | 1 | 588 | Risk Ratio (M‐H, Fixed, 95% CI) | 0.30 [0.03, 2.90] |
|
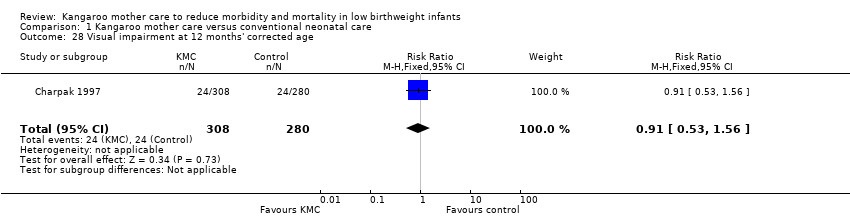
| 28 Visual impairment at 12 months' corrected age Show forest plot | 1 | 588 | Risk Ratio (M‐H, Fixed, 95% CI) | 0.91 [0.53, 1.56] |
|
| 29 Exclusive breast feeding at discharge or 40‐41 weeks' postmenstrual age ‐ stabilized infants Show forest plot | 4 | 1197 | Risk Ratio (M‐H, Random, 95% CI) | 1.21 [1.08, 1.36] |
|
| 29.1 Intermittent | 2 | 255 | Risk Ratio (M‐H, Random, 95% CI) | 1.29 [1.15, 1.44] |
| 29.2 Continuous | 2 | 942 | Risk Ratio (M‐H, Random, 95% CI) | 1.14 [0.92, 1.42] |
| 30 Exclusive breast feeding at 1‐3 months follow up ‐ stabilized infants Show forest plot | 5 | 600 | Risk Ratio (M‐H, Random, 95% CI) | 1.20 [1.01, 1.43] |
|
| 30.1 Intermittent | 3 | 221 | Risk Ratio (M‐H, Random, 95% CI) | 1.36 [1.12, 1.65] |
| 30.2 Continuous | 2 | 379 | Risk Ratio (M‐H, Random, 95% CI) | 1.03 [0.96, 1.10] |
| 31 Exclusive breast feeding at 6‐12 months follow up ‐ stabilized infants Show forest plot | 3 | 810 | Risk Ratio (M‐H, Fixed, 95% CI) | 1.29 [0.95, 1.76] |
|
| 31.1 Intermittent | 1 | 75 | Risk Ratio (M‐H, Fixed, 95% CI) | 1.52 [1.10, 2.10] |
| 31.2 Continuous | 2 | 735 | Risk Ratio (M‐H, Fixed, 95% CI) | 1.10 [0.66, 1.86] |
| 32 Any breast feeding at discharge or 40‐41 weeks' postmenstrual age ‐ stabilized infants Show forest plot | 8 | 1440 | Risk Ratio (M‐H, Random, 95% CI) | 1.25 [1.06, 1.47] |
|
| 32.1 Intermittent | 6 | 498 | Risk Ratio (M‐H, Random, 95% CI) | 1.31 [1.11, 1.55] |
| 32.2 Continuous | 2 | 942 | Risk Ratio (M‐H, Random, 95% CI) | 1.14 [0.93, 1.40] |
| 33 Any breast feeding at 1‐2 months follow up ‐ stabilized infants Show forest plot | 6 | 538 | Risk Ratio (M‐H, Random, 95% CI) | 1.33 [1.00, 1.78] |
|
| 33.1 Intermittent | 4 | 159 | Risk Ratio (M‐H, Random, 95% CI) | 1.89 [1.30, 2.75] |
| 33.2 Continuous | 2 | 379 | Risk Ratio (M‐H, Random, 95% CI) | 1.03 [0.96, 1.10] |
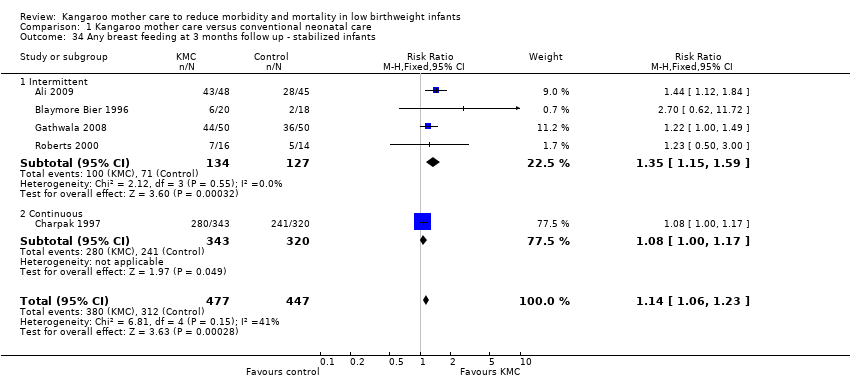
| 34 Any breast feeding at 3 months follow up ‐ stabilized infants Show forest plot | 5 | 924 | Risk Ratio (M‐H, Fixed, 95% CI) | 1.14 [1.06, 1.23] |
|
| 34.1 Intermittent | 4 | 261 | Risk Ratio (M‐H, Fixed, 95% CI) | 1.35 [1.15, 1.59] |
| 34.2 Continuous | 1 | 663 | Risk Ratio (M‐H, Fixed, 95% CI) | 1.08 [1.00, 1.17] |
| 35 Any breast feeding at 6 months follow up ‐ stabilized infants Show forest plot | 5 | 952 | Risk Ratio (M‐H, Fixed, 95% CI) | 1.12 [0.98, 1.29] |
|
| 35.1 Intermittent | 3 | 143 | Risk Ratio (M‐H, Fixed, 95% CI) | 1.50 [1.08, 2.08] |
| 35.2 Continuous | 2 | 809 | Risk Ratio (M‐H, Fixed, 95% CI) | 1.07 [0.92, 1.24] |
| 36 Any breast feeding at 12 months follow up ‐ stabilized infants Show forest plot | 1 | 589 | Risk Ratio (M‐H, Fixed, 95% CI) | 0.89 [0.65, 1.21] |
|
| 36.1 Intermittent | 0 | 0 | Risk Ratio (M‐H, Fixed, 95% CI) | 0.0 [0.0, 0.0] |
| 36.2 Continuous | 1 | 589 | Risk Ratio (M‐H, Fixed, 95% CI) | 0.89 [0.65, 1.21] |
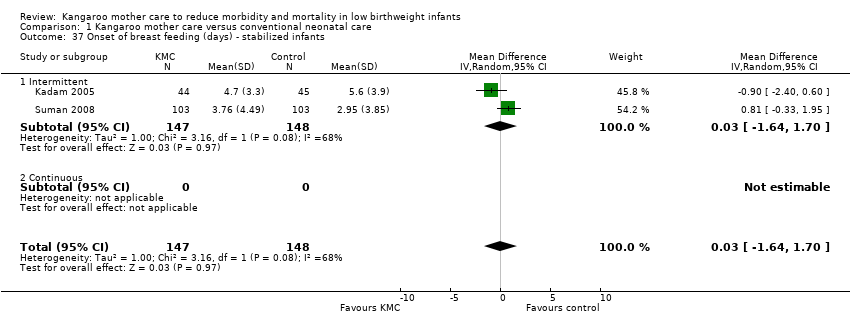
| 37 Onset of breast feeding (days) ‐ stabilized infants Show forest plot | 2 | 295 | Mean Difference (IV, Random, 95% CI) | 0.03 [‐1.64, 1.70] |
|
| 37.1 Intermittent | 2 | 295 | Mean Difference (IV, Random, 95% CI) | 0.03 [‐1.64, 1.70] |
| 37.2 Continuous | 0 | 0 | Mean Difference (IV, Random, 95% CI) | 0.0 [0.0, 0.0] |
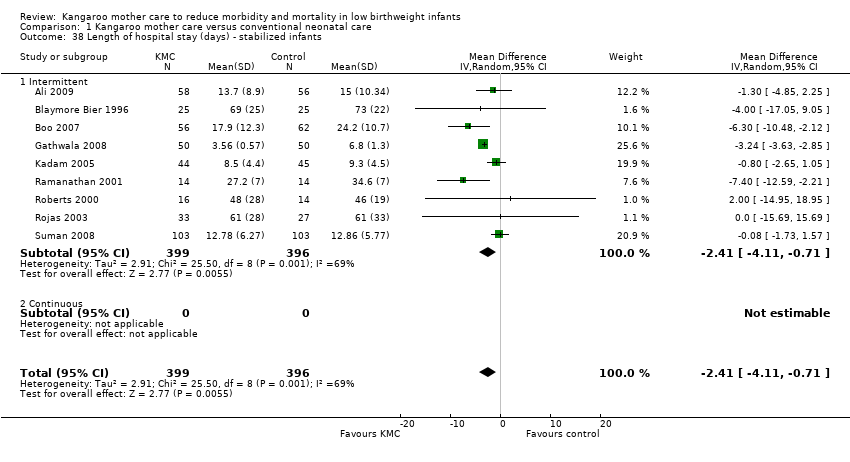
| 38 Length of hospital stay (days) ‐ stabilized infants Show forest plot | 9 | 795 | Mean Difference (IV, Random, 95% CI) | ‐2.41 [‐4.11, ‐0.71] |
|
| 38.1 Intermittent | 9 | 795 | Mean Difference (IV, Random, 95% CI) | ‐2.41 [‐4.11, ‐0.71] |
| 38.2 Continuous | 0 | 0 | Mean Difference (IV, Random, 95% CI) | 0.0 [0.0, 0.0] |
| 39 Parental and familiar satisfaction (continuous KMC) Show forest plot | 1 | | Risk Ratio (M‐H, Fixed, 95% CI) | Subtotals only |
|
| 39.1 Mother satisfied with method | 1 | 269 | Risk Ratio (M‐H, Fixed, 95% CI) | 1.17 [1.05, 1.30] |
| 39.2 Father satisfied with method | 1 | 269 | Risk Ratio (M‐H, Fixed, 95% CI) | 1.02 [0.91, 1.14] |
| 39.3 Family satisfied with method | 1 | 269 | Risk Ratio (M‐H, Fixed, 95% CI) | 0.97 [0.83, 1.13] |
| 40 Mother‐infant attachment: mother's feelings and perceptions according to interval between birth and start of intervention, and infant admission to NICU Show forest plot | 1 | | Mean Difference (IV, Fixed, 95% CI) | Subtotals only |
|
| 40.1 Sense of competence ‐ interval of 1‐2 days | 1 | 170 | Mean Difference (IV, Fixed, 95% CI) | 0.41 [0.14, 0.68] |
| 40.2 Sense of competence ‐ interval of 3‐14 days | 1 | 177 | Mean Difference (IV, Fixed, 95% CI) | 0.25 [‐0.08, 0.58] |
| 40.3 Sense of competence ‐ interval >14 days | 1 | 141 | Mean Difference (IV, Fixed, 95% CI) | 0.21 [‐0.17, 0.59] |
| 40.4 Sense of competence ‐ infant admitted to NICU | 1 | 82 | Mean Difference (IV, Fixed, 95% CI) | 0.54 [0.07, 1.01] |
| 40.5 Sense of competence ‐ infant not admitted to NICU | 1 | 406 | Mean Difference (IV, Fixed, 95% CI) | 0.24 [0.05, 0.43] |
| 40.6 Worry and stress ‐ interval of 1‐2 days | 1 | 170 | Mean Difference (IV, Fixed, 95% CI) | 0.31 [0.04, 0.58] |
| 40.7 Worry and stress ‐ interval of 3‐14 days | 1 | 177 | Mean Difference (IV, Fixed, 95% CI) | 0.09 [‐0.20, 0.38] |
| 40.8 Worry and stress ‐ interval >14 days | 1 | 141 | Mean Difference (IV, Fixed, 95% CI) | ‐0.29 [‐0.70, 0.12] |
| 40.9 Worry and stress ‐ infant admitted to NICU | 1 | 82 | Mean Difference (IV, Fixed, 95% CI) | ‐0.1 [‐0.60, 0.40] |
| 40.10 Worry and stress ‐ infant not admitted to NICU | 1 | 406 | Mean Difference (IV, Fixed, 95% CI) | 0.12 [‐0.06, 0.30] |
| 40.11 Social support ‐ interval of 1‐2 days | 1 | 170 | Mean Difference (IV, Fixed, 95% CI) | ‐0.06 [‐0.35, 0.23] |
| 40.12 Social support ‐ interval of 3‐14 days | 1 | 177 | Mean Difference (IV, Fixed, 95% CI) | ‐0.06 [‐0.34, 0.22] |
| 40.13 Social support ‐ interval >14 days | 1 | 141 | Mean Difference (IV, Fixed, 95% CI) | ‐0.47 [‐0.84, ‐0.10] |
| 40.14 Social support ‐ infant admitted to NICU | 1 | 82 | Mean Difference (IV, Fixed, 95% CI) | ‐0.05 [‐0.52, 0.42] |
| 40.15 Social support ‐ infant not admitted to NICU | 1 | 406 | Mean Difference (IV, Fixed, 95% CI) | ‐0.2 [‐0.39, ‐0.01] |
| 41 Mother‐infant attachment: mother's responses to the infant according to interval between birth and start of intervention, and infant admission to NICU Show forest plot | 1 | | Mean Difference (IV, Fixed, 95% CI) | Subtotals only |
|
| 41.1 Mother's sensitivity ‐ interval of 1‐2 days | 1 | 170 | Mean Difference (IV, Fixed, 95% CI) | 0.02 [‐0.02, 0.06] |
| 41.2 Mother's sensitivity ‐ interval of 3‐14 days | 1 | 177 | Mean Difference (IV, Fixed, 95% CI) | ‐0.01 [‐0.05, 0.03] |
| 41.3 Mother's sensitivity ‐ interval >14 days | 1 | 141 | Mean Difference (IV, Fixed, 95% CI) | 0.06 [0.01, 0.11] |
| 41.4 Mother's sensitivity ‐ infant admitted to NICU | 1 | 82 | Mean Difference (IV, Fixed, 95% CI) | 0.02 [‐0.04, 0.08] |
| 41.5 Mother's sensitivity ‐ infant not admitted to NICU | 1 | 406 | Mean Difference (IV, Fixed, 95% CI) | 0.02 [‐0.00, 0.04] |
| 41.6 Mother's response to child's distress ‐ interval of 1‐2 days | 1 | 170 | Mean Difference (IV, Fixed, 95% CI) | ‐0.03 [‐0.08, 0.02] |
| 41.7 Mother's response to child's distress ‐ interval of 3‐14 days | 1 | 177 | Mean Difference (IV, Fixed, 95% CI) | 0.01 [‐0.03, 0.05] |
| 41.8 Mother's response to child's distress ‐ interval >14 days | 1 | 141 | Mean Difference (IV, Fixed, 95% CI) | 0.01 [‐0.04, 0.06] |
| 41.9 Mother's response to child's distress ‐ infant admitted to NICU | 1 | 82 | Mean Difference (IV, Fixed, 95% CI) | 0.05 [‐0.01, 0.11] |
| 41.10 Mother's response to child's distress ‐ infant not admitted to NICU | 1 | 406 | Mean Difference (IV, Fixed, 95% CI) | ‐0.02 [‐0.05, 0.01] |
| 41.11 Mother's response to child's socioemotional growth fostering ‐ interval of 1‐2 days | 1 | 170 | Mean Difference (IV, Fixed, 95% CI) | 0.01 [‐0.04, 0.06] |
| 41.12 Mother's response to child's socioemotional growth fostering ‐ interval of 3‐14 days | 1 | 177 | Mean Difference (IV, Fixed, 95% CI) | ‐0.02 [‐0.06, 0.02] |
| 41.13 Mother's response to child's socioemotional growth fostering ‐ interval >14 days | 1 | 141 | Mean Difference (IV, Fixed, 95% CI) | 0.05 [‐0.00, 0.10] |
| 41.14 Mother's response to child's socioemotional growth fostering ‐ infant admitted to NICU | 1 | 82 | Mean Difference (IV, Fixed, 95% CI) | ‐0.05 [‐0.12, 0.02] |
| 41.15 Mother's response to child's socioemotional growth fostering ‐ infant not admitted to NICUNICU | 1 | 406 | Mean Difference (IV, Fixed, 95% CI) | 0.02 [‐0.01, 0.05] |
| 41.16 Mother's response to child's cognitive growth fostering ‐ interval of 1‐2 days | 1 | 170 | Mean Difference (IV, Fixed, 95% CI) | 0.02 [‐0.04, 0.08] |
| 41.17 Mother's response to child's cognitive growth fostering ‐ interval of 3‐14 days | 1 | 177 | Mean Difference (IV, Fixed, 95% CI) | ‐0.04 [‐0.10, 0.02] |
| 41.18 Mother's response to child's cognitive growth fostering ‐ interval >14 days | 1 | 141 | Mean Difference (IV, Fixed, 95% CI) | 0.07 [0.00, 0.14] |
| 41.19 Mother's response to child's cognitive growth fostering ‐ infant admitted to NICU | 1 | 82 | Mean Difference (IV, Fixed, 95% CI) | ‐0.07 [‐0.17, 0.03] |
| 41.20 Mother's response to child's cognitive growth fostering ‐ infant not admitted to NICU | 1 | 406 | Mean Difference (IV, Fixed, 95% CI) | 0.03 [‐0.01, 0.07] |
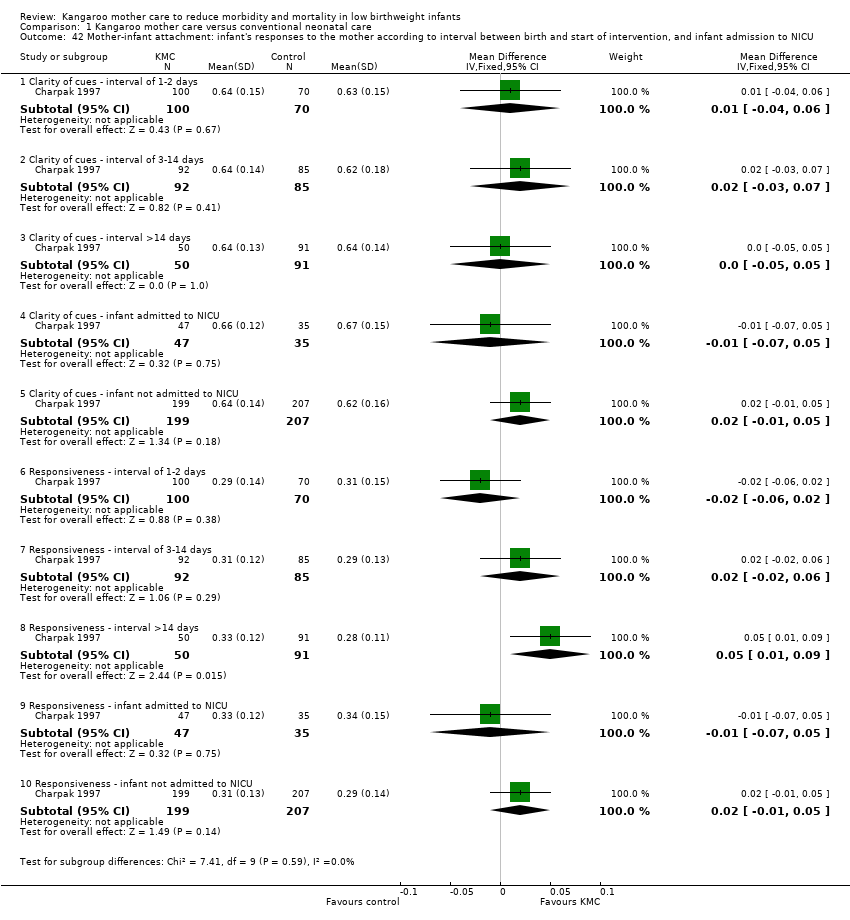
| 42 Mother‐infant attachment: infant's responses to the mother according to interval between birth and start of intervention, and infant admission to NICU Show forest plot | 1 | | Mean Difference (IV, Fixed, 95% CI) | Subtotals only |
|
| 42.1 Clarity of cues ‐ interval of 1‐2 days | 1 | 170 | Mean Difference (IV, Fixed, 95% CI) | 0.01 [‐0.04, 0.06] |
| 42.2 Clarity of cues ‐ interval of 3‐14 days | 1 | 177 | Mean Difference (IV, Fixed, 95% CI) | 0.02 [‐0.03, 0.07] |
| 42.3 Clarity of cues ‐ interval >14 days | 1 | 141 | Mean Difference (IV, Fixed, 95% CI) | 0.0 [‐0.05, 0.05] |
| 42.4 Clarity of cues ‐ infant admitted to NICU | 1 | 82 | Mean Difference (IV, Fixed, 95% CI) | ‐0.01 [‐0.07, 0.05] |
| 42.5 Clarity of cues ‐ infant not admitted to NICU | 1 | 406 | Mean Difference (IV, Fixed, 95% CI) | 0.02 [‐0.01, 0.05] |
| 42.6 Responsiveness ‐ interval of 1‐2 days | 1 | 170 | Mean Difference (IV, Fixed, 95% CI) | ‐0.02 [‐0.06, 0.02] |
| 42.7 Responsiveness ‐ interval of 3‐14 days | 1 | 177 | Mean Difference (IV, Fixed, 95% CI) | 0.02 [‐0.02, 0.06] |
| 42.8 Responsiveness ‐ interval >14 days | 1 | 141 | Mean Difference (IV, Fixed, 95% CI) | 0.05 [0.01, 0.09] |
| 42.9 Responsiveness ‐ infant admitted to NICU | 1 | 82 | Mean Difference (IV, Fixed, 95% CI) | ‐0.01 [‐0.07, 0.05] |
| 42.10 Responsiveness ‐ infant not admitted to NICU | 1 | 406 | Mean Difference (IV, Fixed, 95% CI) | 0.02 [‐0.01, 0.05] |
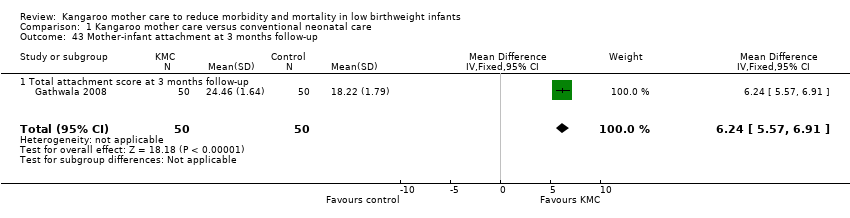
| 43 Mother‐infant attachment at 3 months follow‐up Show forest plot | 1 | 100 | Mean Difference (IV, Fixed, 95% CI) | 6.24 [5.57, 6.91] |
|
| 43.1 Total attachment score at 3 months follow‐up | 1 | 100 | Mean Difference (IV, Fixed, 95% CI) | 6.24 [5.57, 6.91] |
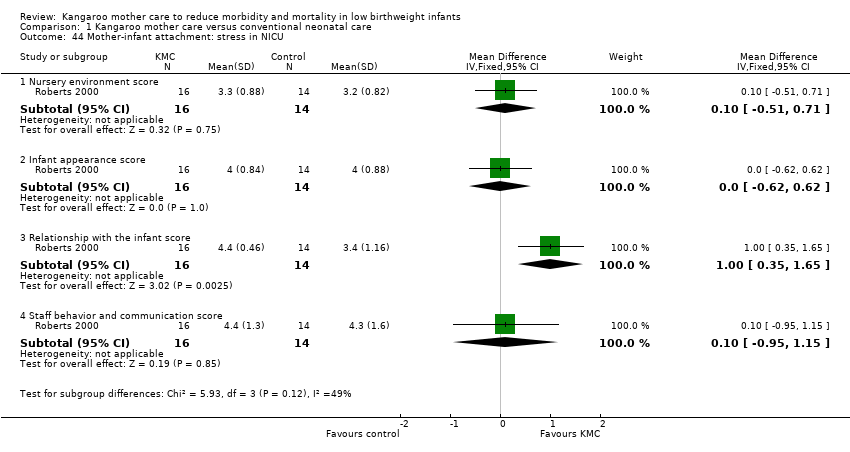
| 44 Mother‐infant attachment: stress in NICU Show forest plot | 1 | | Mean Difference (IV, Fixed, 95% CI) | Subtotals only |
|
| 44.1 Nursery environment score | 1 | 30 | Mean Difference (IV, Fixed, 95% CI) | 0.10 [‐0.51, 0.71] |
| 44.2 Infant appearance score | 1 | 30 | Mean Difference (IV, Fixed, 95% CI) | 0.0 [‐0.62, 0.62] |
| 44.3 Relationship with the infant score | 1 | 30 | Mean Difference (IV, Fixed, 95% CI) | 1.00 [0.35, 1.65] |
| 44.4 Staff behavior and communication score | 1 | 30 | Mean Difference (IV, Fixed, 95% CI) | 0.10 [‐0.95, 1.15] |
| 45 Mother‐infant attachment: parenting skills Show forest plot | 1 | 30 | Mean Difference (IV, Fixed, 95% CI) | ‐0.40 [‐0.89, 0.09] |
|
| 45.1 Total score at discharge | 1 | 30 | Mean Difference (IV, Fixed, 95% CI) | ‐0.40 [‐0.89, 0.09] |
| 46 Mother‐infant interaction at 6 months follow‐up Show forest plot | 1 | | Mean Difference (IV, Fixed, 95% CI) | Subtotals only |
|
| 46.1 Symmetrical coregulation | 1 | 45 | Mean Difference (IV, Fixed, 95% CI) | 16.38 [13.61, 19.15] |
| 46.2 Asymmetrical coregulation | 1 | 45 | Mean Difference (IV, Fixed, 95% CI) | ‐18.31 [‐21.42, ‐15.20] |
| 46.3 Unilateral regulation | 1 | 45 | Mean Difference (IV, Fixed, 95% CI) | 2.12 [‐1.24, 5.48] |
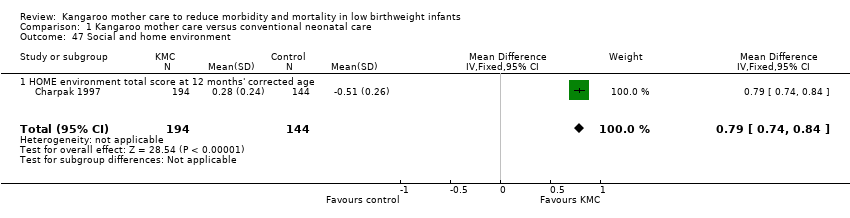
| 47 Social and home environment Show forest plot | 1 | 338 | Mean Difference (IV, Fixed, 95% CI) | 0.79 [0.74, 0.84] |
|
| 47.1 HOME environment total score at 12 months' corrected age | 1 | 338 | Mean Difference (IV, Fixed, 95% CI) | 0.79 [0.74, 0.84] |