Körperliches Training bei zystischer Fibrose
Referencias
References to studies included in this review
References to studies excluded from this review
References to studies awaiting assessment
References to ongoing studies
Additional references
References to other published versions of this review
Characteristics of studies
Characteristics of included studies [ordered by study ID]
| Methods | Design: single‐centre, open‐label, parallel RCT (the record on clinicaltrials.gov states cross‐over design, but this is not evident from published paper). Inclusion criteria: participants with CF; age > 18 years; sedentary (less than 100 min/week of structured exercise assessed by physical activity questionnaire and phone interview; FEV1 > 40 % predicted; clinically stable for the last 6 weeks; IGT; CFRD without pharmacological treatment or elevated 1‐h plasma glucose concentration during an oral glucose tolerance test (indeterminate 1‐h glucose concentration of > 11.0 but 2‐h plasma glucose concentration < 7.8 mmol/L‐1). | |
| Participants | 14 participants with CF. Group demographics Exercise group (n = 8): mean (range) age 31.9 (24; 41) years. Control groups (n = 6): mean (range) age 35.5 (22; 57) years. | |
| Interventions | 12‐week combined aerobic and resistance training study. Exercise group: aerobic and resistance training exercises 3x per week for about 20 ‐ 40 minutes with a day off between the training sessions (in total 36 training sessions). Exercise intensity and volume were progressively increased. Participants recorded their training sessions in a diary. Once every 4 weeks, participants received a supervised training session and a phone call on a weekly basis.
Control group: no information was reported in the original publication. Detailed information on control intervention is available on clinicaltrials.gov. | |
| Outcomes | Included in this study were: pulmonary function (FVC, FEV1); metabolic parameters (HbA1c, plasma glucose area under the curve, insulin sensitivity index, plasma insulin area under the curve (0 ‐ 120 min); exercise capacity measured by a cycle cardiopulmonary exercise test (VO2 peak and VE at VO2 peak); muscle strength (leg press, chest press, latpull down, biceps curl) and endurance (push‐up, sit‐up, flexibility, handgrip strength); body composition (bodyweight, BMI, body fat and fat‐free mass); HRQoL and objectively measured physical activity (steps per days; energy expenditure) and assessed by questionnaire. Further, inflammatory markers were measured in this study (e.g., IL‐1; IL‐6; IL‐8; YKL‐40 and CRP‐hs) but inflammatory biomarkers are not outcomes relevant for this review. | |
| Notes | Study registration: The study was registered as cross‐over trial (Clinicaltrials.gov NCT02127957) but results were reported as parallel‐design study. The authors confirmed that they had to stop the study due to recruitment problems. The authors presented only results from the first study phase (12 weeks). Information provided on clinicaltrials.gov "Intervention Model: Crossover Assignment" "Following the visit #6, patients in the control group will be invited to participate in a second study phase to participate in supervised exercise program. This participation will involve an additional 12 weeks of follow‐up, which included the same visit as Group 1 with exercises. In this case, to simplify participation and reduce the volume of blood collected, the final visit (#5) of the project will also be the first visit of exercises phase. This part of study, involves 2 supervised training sessions and 8 follow up phone call. The exercises program will be performed three times per week for about one hour." | |
| Risk of bias | ||
| Bias | Authors' judgement | Support for judgement |
| Random sequence generation (selection bias) | Unclear risk | Randomly assigned open‐label study with two parallel arms. Randomisation was conducted in blocks by gender with a ratio of 2:2. No details given for generation of sequence. |
| Allocation concealment (selection bias) | Unclear risk | Not discussed. |
| Blinding of participants and personnel (performance bias) | Unclear risk | Not possible to blind participants to intervention. |
| Blinding of outcome assessment (detection bias) | Unclear risk | Unclear whether outcome assessors blinded. |
| Incomplete outcome data (attrition bias) | High risk | At screening,1 participant could not be randomized due to an adverse event during cardiopulmonary exercise testing. There were 3 dropouts post‐randomisation (18%).
The study was registered as crossover study but results for the second study part were not presented. |
| Selective reporting (reporting bias) | High risk | Heart rate and SaO2 were measured during cardiopulmonary exercise testing, but results were not reported. The second study phase was not reported in the original publication. |
| Other bias | High risk | Sample size Information on sample size and recruitment goals differ between the information provided under Clinicaltrials.gov and the final publication. This study aimed to recruit 24 participants (12 exercise group, 12 control group), see Clinicaltrials.gov, NCT02127957. The recruitment goal was not achieved (N = 18 were recruited but only 17 randomised ), but no information was provided in the final paper. According to the power calculation provided in the original publication, 18 participants (9 per group) were required for the analysis. Finally, 14 participants completed the study so the study is likely to be underpowered. Statistical analyses The authors reported pre‐post within‐group changes and no between‐group differences as would be appropriate for a RCT. We received raw data from the authors and calculated between‐group differences for plasma glucose and plasma insulin values during the oral glucose tolerance test. Our results differ compared to the results reported in the original publication. The initial power analysis, aiming to demonstrate a difference of 1.5 mmol/L in plasma glucose levels 120 minutes after ingestion of the glucose solution after exercise training required a study sample of 18 participants (9 per group). Finally, only 14 participants completed the study that reduces the statistical power to observe a difference between the interventions in the study. Control intervention In the original publication, no information was provided on the control intervention. We noticed discrepancies between the registered (clinicaltrials.gov) and published trial design (cross‐over versus parallel‐group design). |
| Methods | Design: single‐centre, parallel RCT during hospital admission for acute exacerbation. Inclusion criteria: participants with CF who were admitted to the hospital for treatment of an acute exacerbation. Those who were able to perform a pulmonary function test and provided written informed consent (assumed patient or parental depending on age) were included. Exclusion criteria: not described. | |
| Participants | 17 participants with CF. Exercise group (n = 9): mean (SD) age 15.4 (4.9) years. Bronchial hygiene group (n = 8): mean (SD) age 15.9 (4.9) years. | |
| Interventions | Short‐term aerobic study. Group 2: 3 bronchial hygiene sessions per day during admission: mean (SD) 13 days (2.6 days). | |
| Outcomes | Included in this study were: pulmonary function (FVC, ERV, IC, FEV1, FEF25‐75,RV, FRC, TLC, Raw, SGAW, SaO2, and PFS); exercise performance during cycle ergometry with load increased by 0.3 W/kg every 2 minutes until participant could continue no longer (SaO2, peak load, EMG activity, peak HR, peak VE to peak load ratio, peak HR to peak load ratio); cough (15 min post treatment session); sputum (wet and dry weight, volume). | |
| Notes | ||
| Risk of bias | ||
| Bias | Authors' judgement | Support for judgement |
| Random sequence generation (selection bias) | Unclear risk | Described as randomised but no details of the method. |
| Allocation concealment (selection bias) | Unclear risk | Not discussed. |
| Blinding of participants and personnel (performance bias) | Unclear risk | Not possible to blind participants to intervention. Unclear whether personnel was blinded. |
| Blinding of outcome assessment (detection bias) | Unclear risk | Unclear whether outcome assessors blinded. |
| Incomplete outcome data (attrition bias) | Low risk | There were no dropouts. |
| Selective reporting (reporting bias) | Low risk | All outcomes detailed in methods were reported in results. Data reported for all time points. |
| Other bias | Unclear risk | Stated the inclusion criteria but not the exclusion criteria. Pulmonary function values FEV1 and FEF25‐75 were significantly lower in the control compared to the training group at admission. Clearly described statistical analysis methods. |
| Methods | Design: single‐centre RCT (INSPIRE‐CF) in the UK; duration 24 months. Powered to show changes in primary outcome measure of FEV1 z score after 24 months (66 participants needed). Inclusion criteria: not described in abstract. Exclusion criteria: not described in abstract. | |
| Participants | Recruited 71 participants with CF; age 6 to 15.5 years; mean (SD) FEV1 89 (16) % predicted. Group demographics Intervention group (n = 37). Control group (n = 34). 67 children completed the study. | |
| Interventions | Intervention group: standard specialist care including weekly exercise training. Control group: standard specialist care without weekly exercise training. | |
| Outcomes | Included in this study were: average and individual exercise training attendance rates (%); reason for non‐attendance to the exercise training programme. At baseline,12 and 24 months the following outcomes were measured: multiple‐breath washout (lung clearance index); spirometry (FEV1, FVC, FEV1/FVC (measured in litres and converted to z scores)); growth parameters (height; weight; BMI (measured in cm²; kg; and converted to z scores); cardiopulmonary exercise test (Bruce protocol): at peak and anaerobic threshold (VO2 peak; work rate (power); VE/VCO2; RER; HRmax; SaO2; 10m modified shuttle walk test (25‐level version) (distance in meters; level achieved); HRmax; SaO2; Cystic Fibrosis Questionnaire (CFQ UK version). At 6 months only spirometry and the 10 m modified shuttle walk test were repeated. | |
| Notes | INSPIRE‐CF is an 24‐month exercise training study that investigates the effects of an individually tailored and supervised exercise training programme on lung function, exercise capacity and HRQoL for children with CF. This abstract evaluates the participation in the intervention group in the first year of the study (study has been completed, but not yet published in full). Study was powered to show changes after 24 months in primary outcome measure of FEV1 z score; Required 66 participants. | |
| Risk of bias | ||
| Bias | Authors' judgement | Support for judgement |
| Random sequence generation (selection bias) | Low risk | Described as randomised but no details of the method. Randomised by minimisation to one of the two groups (after baseline testing) by an independent blinded medical statistician using the SiMin software package (Wade 2006). |
| Allocation concealment (selection bias) | Unclear risk | Not discussed. |
| Blinding of participants and personnel (performance bias) | Low risk | Not possible to blind participants to intervention. Investigators confirmed that lung function (spirometry and multiple inert gas washout tests), and cycle ergometer cardiopulmonary exercise tests were performed by clinicians who were not made aware of the randomised grouping of the children. |
| Blinding of outcome assessment (detection bias) | Low risk | Investigators confirmed blinded outcome assessment. |
| Incomplete outcome data (attrition bias) | Low risk | 4 participants dropped out: 1 from the control group at 6 months (social concerns); 3 from the intervention group at 12 months (1 due to moving to a new area and changing hospitals; 2 because they no longer wished to exercise). |
| Selective reporting (reporting bias) | Unclear risk | This is an abstract so unable to assess if all outcome used in methods were reported in results. Unable to assess if data were reported for all time points. |
| Other bias | Unclear risk | None identified based on limited information available. |
| Methods | Design: multicentre parallel RCT; duration 24 months (6‐month intervention and long‐term, open follow‐up period). Inclusion criteria: participants with CF; age > 12 years; FEV1> 35 % predicted; ability to perform physical activities. Exclusion criteria: non CF‐related chronic diseases and CF‐related conditions posing an increased risk to the participant when exercising. These were specifically oesophageal varicosis, pulmonary bullae, a < 80% drop in arterial oxygen saturation with exercise and signs of pulmonary hypertension on electrocardiogram and/or echocardiogram. | |
| Participants | 38 participants with CF. Group demographics Exercise group (n = 23): mean (SD) age 19.5 (6.4) years. Control group (n = 15): mean (SD) age 19.4 (5.3) years. | |
| Interventions | Long‐term partially supervised conditioning programme. Group 1 (intervention): exercise intervention with endurance‐type and strengthening exercises. Participants agreed to increase their vigorous physical activities by a minimum of 3x 60 min per week in the first 6 months of the study. An individual exercise plan was devised for participants; activity counselling was stopped after the first 6 months and participants were encouraged to maintain or further increase their physical activity level. Group 2 (control): participants told to keep their activity level constant during the first 12 months of the study. During the second year (period from 12 ‐ 24 months) they were free to change their activity behaviour. | |
| Outcomes | Included in this study were: VO2 peak; peak workload; Wingate Anaerobic Test (PP, MP); FVC; FEV1; RV/TLC; vigorous physical activity; skinfold thickness; body fat; fat‐free mass and HRQoL. Outcomes were measured at baseline and after 3, 6, 12, 18 and 24 months. | |
| Notes | This study is a full text article of the Hebestreit 2003 abstract. The author provided additional raw data for this review were not reported in detail in the original paper (e.g. data for RV/TLC, bodyweight, BMI, body fat and fat‐free mass). The control group in this study is also used in the Kriemler study (Kriemler 2013). | |
| Risk of bias | ||
| Bias | Authors' judgement | Support for judgement |
| Random sequence generation (selection bias) | High risk | 40 folded paper tickets were put into a bag with a 3:2 ratio, i.e. 24 tickets for the intervention group and 16 for the control group. Participants drew a ticket at random and the drawn ticket was then destroyed. Principal investigator was aware of the number of lots in the bag. |
| Allocation concealment (selection bias) | High risk | Participants drew a folded paper ticket from an opaque bag with closed eyes. In case that all lots have been drawn out by 1 study group, allocation concealment would no longer exist. |
| Blinding of participants and personnel (performance bias) | Unclear risk | Not possible to blind participants to intervention. Unclear whether personnel was blinded. |
| Blinding of outcome assessment (detection bias) | Unclear risk | Outcome assessors were not blinded with respect to the participants' group allocation for VO2 peak and skinfold measurements. |
| Incomplete outcome data (attrition bias) | Unclear risk | 5 participants dropped out during the first 12 months of the study: 3 gave no reason, 1 joined another study and 1 moved away. At 18 and 24 months, dropout rate was 13% and 26% respectively. Dropouts were balanced between groups. Reasons for drop out were not recorded. Intention‐to‐treat was not performed. |
| Selective reporting (reporting bias) | Unclear risk | Anaerobic capacity (PP, MP) was only reported for 18 ‐ 24 months follow up (non‐significant) and results for HRQoL are only presented for the scale 'physical functioning'. No effects were observed for all other HRQoL scales. |
| Other bias | Unclear risk | Financial support (max 200 Euro) was offered for intervention group participants to foster the realisation of the exercise training plan. |
| Methods | Design: Single‐centre parallel RCT; 3‐month duration Inclusion criteria: participants with CF aged 7 ‐ 20 years; stable disease, no signs of exacerbation of respiratory symptoms in last 15 days. Exclusion criteria: cognitive impairment, non CF‐related bone and muscle abnormalities, heart disease with haemodynamic instability. | |
| Participants | 34 participants with CF (20 boys, 14 girls). Group demographics Exercise group (n = 17): mean (SD) age 13.4 (2.8) years. Control group (n = 17): mean (SD) age 12.7 (3.3) years. | |
| Interventions | Aerobic exercise program based on verbal and written guidelines. Exercise group: participants took part in a 3‐month aerobic exercise training program based on verbal and written guidelines. The program included exercises such as jogging, swimming, walking, ball games and stretching exercises. Participants were told to practice the exercises at least twice a week for at least 20 min. No recommendations were provided regarding exercise intensity. Participants received telephone calls every 2 weeks and instructions were provided by one of the authors. Control group: Participants were instructed about aerobic exercises once at baseline according to the CF center routine. | |
| Outcomes | Included in this study were: VO2 peak; FVC; FEV1; FEV1/FVC; FEF25‐75; HRQoL; self‐reported physical activity; body weight; BMI z score; triceps skinfold thickness; arm muscle circumference; SaO2 at rest and peak exercise, treadmill time; treadmill speed; peak HR; Borg breathlessness and fatigue. | |
| Notes | The sample size was estimated based on a mean (SD) change of 18.1 (13.8) points in the physical score of the HRQoL questionnaire. The estimated sample size was 15 participants in each group (95% power at a 5% level of significance). 2 more participants were included in each group to account for potential dropouts. Another study from the same group using the same aerobic exercise program was published recently (Schindel 2015). The responsible author of this publication confirmed that the vast majority of included participants were the same as in the Hommerding study (Hommerding 2015). There were only marginal differences in lung function (FEV1, FVC and FEF25‐75) compared to the Hommerding study for which reasons we decided not to include lung function data in this review. | |
| Risk of bias | ||
| Bias | Authors' judgement | Support for judgement |
| Random sequence generation (selection bias) | Low risk | Participants were allocated to the intervention or control group in blocks of 6. A computer‐based program was used for randomisation. |
| Allocation concealment (selection bias) | Unclear risk | Not discussed. |
| Blinding of participants and personnel (performance bias) | Unclear risk | Not possible to blind participants to intervention. Unclear whether personnel was blinded. |
| Blinding of outcome assessment (detection bias) | Unclear risk | Unclear whether outcome assessors blinded. |
| Incomplete outcome data (attrition bias) | Low risk | No drop outs were reported during the study. |
| Selective reporting (reporting bias) | Unclear risk | Blood pressure was measured prior to and after cardiopulmonary exercise testing but not reported. HR at rest and SaO2 at peak exercise were measured but results were not reported at baseline. |
| Other bias | Unclear risk | No validity criteria for maximal performance during cardiopulmonary exercise testing were reported in the methods. The mean (SD) peak heart rate reached during the exercise test was 157.1 (38.5) beats per min in the training group and 167.7 (20.8) beats per min in the control group, indicative of a submaximal effort. This likely underestimates the true VO2 peak of the study participants. |
| Methods | Design: Single‐centre, parallel RCT, 3‐month duration. Inclusion criteria: Participants with CF aged 9 ‐ 18 years; a stable clinical condition (i.e., no need for oral or IV antibiotic treatment in the 3 months prior to testing); the absence of musculoskeletal disorders; and an FEV1 > 30 % predicted. Exclusion criteria: not specified. | |
| Participants | 20 participants with CF (stable disease) completed the study. Group 1 (training) (n = 11): mean (SD) age 13.6 (1.3) years. Group 2 (control) (n = 9): mean (SD) age 14.2 (2.1) years. | |
| Interventions | Long‐term anaerobic study (12 weeks). Group 1: anaerobic exercise (2 days per week for 30 ‐ 45 min). Group 2: normal daily activities. | |
| Outcomes | Included in this study were: BMI; FEV1; FVC; FEF25‐75; RV/TLC; Wingate Anerobic Test (PP, MP); VO2 peak; peak working capacity; VCO2; VE; RER; lactate; habitual activity estimation scale; HRQoL; fat‐free mass. Outcomes measured again at 12 weeks follow up. | |
| Notes | To achieve a difference in PP per kg body weight of 10% with an SD of 0.8 W/kg and a statistical power of 80%, it was calculated that 8 participants had to be included in each study group. | |
| Risk of bias | ||
| Bias | Authors' judgement | Support for judgement |
| Random sequence generation (selection bias) | Unclear risk | Described as randomised, but no details of the method. |
| Allocation concealment (selection bias) | Low risk | Allocation concealed in opaque envelopes. |
| Blinding of participants and personnel (performance bias) | Unclear risk | Not possible to blind participants to intervention. The primary researcher was blinded but their role in the study is unclear. |
| Blinding of outcome assessment (detection bias) | Unclear risk | The primary researcher was blinded, but it is unclear whether this researcher was responsible for outcome assessment. |
| Incomplete outcome data (attrition bias) | Low risk | Clear description and details about dropouts. Intention‐to‐treat analysis was not performed. |
| Selective reporting (reporting bias) | Unclear risk | Results for HRQoL are only presented for the scale 'physical functioning' which was significantly higher in the training group after the 12‐week training period. No change in this HRQoL scale was observed in the control group after 12‐weeks. No significant effects were observed for any other HRQoL scales. Data were not reported in detail. |
| Other bias | Unclear risk | Clearly stated inclusion criteria but exclusion criteria were not reported. Described statistical methods used in analysis. |
| Methods | Design: multi‐centre, parallel RCT with 3 arms; 24 months (6‐month intervention and long‐term, open follow‐up period). Inclusion criteria: diagnosis of CF; aged 12 years and over; a FEV1 % predicted ≥ 35%; ability to perform physical activity without harm. Exclusion criteria: non‐CF related chronic diseases and conditions posing an increased risk to the participant when exercising. | |
| Participants | 39 participants with CF split into 3 groups. Group demographics Group 1 (aerobic training) (n = 17): mean (95% CI) age 23.8 (21.5 to 26.5) years. Group 2 (strength training) (n = 12): mean (95% CI) age 19.0 (16.0 to 22.0) years. Group 3 (control) (n = 10): mean (95% CI) age 20.3 (17.0 to 23.6) years. A separate control group from a parallel study (Hebestreit 2010) was added due to an unusual deterioration of physical health in the control group in this study (n = 15), mean (95% CI) age 19.5 (16.8 to 22.2) years. | |
| Interventions | Long‐term exercise study. Group 1: participants consented to perform 3 aerobic training sessions per week of 30 ‐ 45 min duration for the first 6 months and received support which was stopped thereafter. Group 2: participants consented to perform 3 strength training sessions per week of 30 ‐ 45 min duration for the first 6 months and received support which was stopped thereafter. Group 3: participants in the control group were told to keep their activity level constant. Free access to a fitness centre for 1 year was offered after the first study year. | |
| Outcomes | Included in this study were: FEV1; FVC; RV/TLC; VO2 peak; peak workload; Wingate anaerobic test (PP, MP); physical activity; body fat; fat‐free mass. | |
| Notes | This study is a full text article of the Kriemler 2001 and Hebestreit 2003 abstracts. The control group experienced a deterioration of physical health during the study. In the original paper, a second control group from a German study with similar design and methods (Hebestreit 2010) was used for comparisons. | |
| Risk of bias | ||
| Bias | Authors' judgement | Support for judgement |
| Random sequence generation (selection bias) | High risk | Participants were randomly assigned by a lot that was drawn from an opaque bag with closed eyes. Investigator was aware of the number of lots in the bag. |
| Allocation concealment (selection bias) | High risk | Participants drew a lot from an opaque bag with closed eyes. In case that all lots have been drawn out by one study group, allocation concealment would no longer exist. |
| Blinding of participants and personnel (performance bias) | Unclear risk | Not possible to blind participants to intervention. Unclear whether personnel was blinded. |
| Blinding of outcome assessment (detection bias) | Low risk | Outcome assessors were blinded for pulmonary function testing (primary outcome FEV1). Outcome assessors were not involved in supervision and delivery of the intervention. |
| Incomplete outcome data (attrition bias) | Low risk | Clear description and details about excluded participants and drop‐outs. 3 participants were excluded at baseline due to FEV1 below 35% predicted. 8 participants dropped out at different time points (exacerbation n = 1; non‐compliance n = 2; death n = 2; unclear reasons n = 3). 2 of the participants that dropped out for unclear reasons were in the control group and one was in the aerobic training group. Dropout rate was 21%. Intention‐to‐treat analysis was not performed. |
| Selective reporting (reporting bias) | Low risk | All outcome detailed in methods were reported in results except HRQoL (secondary outcome) which was mentioned to be reported separately. In the meantime published as Hebestreit et al. BMC Pulm Med. 2014, 27;14:26. HRQoL data were pooled from two intervention studies (Hebestreit 2010; Kriemler 2013) and results were presented for baseline and 6‐month follow up. |
| Other bias | Unclear risk | Clearly stated inclusion and exclusion criteria and described statistical methods used in analysis. Due to the deterioration of physical health in the control group, the results of this study should be interpreted with caution. |
| Methods | Design: single‐centre, parallel RCT during hospital admission. Inclusion criteria: not specified. Exclusion criteria: not specified. | |
| Participants | 9 participants with CF, not stated how many allocated to each group. Exercise group: mean (SD) age 25.5 (10.5) years. Non‐exercise group: mean (SD) age 21.5 (3.2) years. | |
| Interventions | Short‐term aerobic study. Group 2: standardised CF protocol. | |
| Outcomes | Included in this study were: skin folds; mid‐arm circumference; grip strength; respiratory muscle strength; ideal body weight. Measured at 1 month post‐discharge. | |
| Notes | Limited information as published as abstract only. | |
| Risk of bias | ||
| Bias | Authors' judgement | Support for judgement |
| Random sequence generation (selection bias) | Unclear risk | Described as randomised, but no details of method. |
| Allocation concealment (selection bias) | Unclear risk | Not discussed. |
| Blinding of participants and personnel (performance bias) | Unclear risk | Not possible to blind participants to intervention. Unclear whether personnel was blinded. |
| Blinding of outcome assessment (detection bias) | Unclear risk | Unclear whether outcome assessors blinded. |
| Incomplete outcome data (attrition bias) | Unclear risk | No details of dropouts or whether intention‐to‐treat analysis had been used. |
| Selective reporting (reporting bias) | Unclear risk | This is an abstract so unable to assess if all outcome used in methods were reported in results. Unable to assess if data were reported for all time points. |
| Other bias | Unclear risk | Do not state inclusion or exclusion criteria, nor do they describe the methods of statistical analysis used. |
| Methods | Design: single‐centre, parallel RCT; 1‐year duration. Inclusion criteria: participants with CF who were willing to participate were recruited from a population of 150 attending the adult CF centre in Manchester at the time of the study. All participants had documented CF on the basis of clinical history plus either an increased sweat chloride or abnormal genetic testing. Exclusion criteria: participation in another clinical trial; pregnancy; transplant listing, or clinical cor pulmonale. | |
| Participants | 51 participants with CF were randomised; 42 completed the study. Exercise group (n = 30): mean (SD) age 23.5 (6.4) years. Control group (n = 18): 23.6 (5.5) years. | |
| Interventions | Long‐term aerobic and anaerobic study over 1 year. Group 2: control (continue with usual activities). | |
| Outcomes | Included in this study were: FEV1; FVC; whole blood lactate; RER; heart rate; Borg breathlessness and muscle effort; VE, RR peak for arm and bicycle ergometry at 55% maximal workload; BMI and weight. | |
| Notes | This study is a full text article of Dodd 1998 and Moorcroft 2000 abstracts. | |
| Risk of bias | ||
| Bias | Authors' judgement | Support for judgement |
| Random sequence generation (selection bias) | Unclear risk | Randomised to either active or control groups in a ratio of 3:2. A stratified randomisation in blocks (block size not stated) was used to balance the groups for FEV1, sputum colonisation by Burkholderia cepacia and gender. No details of method reported. |
| Allocation concealment (selection bias) | Unclear risk | Not discussed. |
| Blinding of participants and personnel (performance bias) | Unclear risk | Not possible to blind participants to intervention. Unclear whether personnel was blinded. |
| Blinding of outcome assessment (detection bias) | Unclear risk | Unclear whether outcome assessors blinded. |
| Incomplete outcome data (attrition bias) | Unclear risk | 3 participants dropped out at the start of programme: 1 from training group due to failure to attend on initial assessment; and 2 in the control group were withdrawn due to ill health. A further 6 participants dropped out during the 1‐year period. Reasons for dropout were not clearly reported. After 1 year, overall dropout rate was 18% and balanced among the groups (19% in the intervention and 15% in the control group). Intentition‐to‐treat analysis was not performed. Missing data were treated by omission and only data for those who completed study presented. |
| Selective reporting (reporting bias) | Low risk | All outcome detailed in methods were reported in results. Data reported for all time points. |
| Other bias | Low risk | Clearly stated inclusion and exclusion criteria and described method of statistical analysis used. |
| Methods | Design: single‐centre, parallel RCT; 3‐months home‐based exercise programme. Inclusion criteria: participants diagnosed with CF in accordance with the criteria of the consensus;aged ≥16 years; ≥ 30 days of clinical respiratory disease stability. Exclusion criteria: participants who refused to take part in the study; pregnant ladies; individuals with heart disease, orthopaedic or traumatological problems. | |
| Participants | 41 participants with CF. Group demographics Exercise group (n = 22): mean (SD) age 23.8 (8.3) years. Control group (n = 19): mean (SD) age 25.4 (6.9) years. 2 study participants in the exercise group could not be assessed at the 3‐months follow up due to lung transplant assessment. | |
| Interventions | 3‐month home‐based exercise programme. Group 1: participants received printed guidance for aerobic and muscle strengthening exercises and were advised to perform the programme on a daily basis. Weekly telephone contacts were performed during the 3‐month period. Group 2: control group participants received standard programme without any specific exercise instructions. | |
| Outcomes | Included in this study were: HRQoL; FEV1; FVC; walking distance (6MWT); SaO2 at peak exercise; RR at peak exercise; peak exercise HR; dyspnoea and fatigue scores; upper and lower body muscle strength. | |
| Notes | ||
| Risk of bias | ||
| Bias | Authors' judgement | Support for judgement |
| Random sequence generation (selection bias) | Low risk | Participants were randomly allocated in blocks of 6 to the exercise or control group. A computer programme was used to generate randomisation sequence. |
| Allocation concealment (selection bias) | Unclear risk | Not discussed. |
| Blinding of participants and personnel (performance bias) | Unclear risk | Not possible to blind participants to intervention. 1 researcher was blinded to the randomisation and intervention and was responsible for database entries. |
| Blinding of outcome assessment (detection bias) | Low risk | Outcome assessors were blinded. |
| Incomplete outcome data (attrition bias) | Low risk | 2 participants in the exercise group could not be assessed at the 3‐month visit due to submission to the lung transplant programme. Intention‐to‐treat analysis was used and imputations for missing data were performed for these 2 participants. |
| Selective reporting (reporting bias) | Low risk | All outcome detailed in methods were reported in results. Data reported for all time points. |
| Other bias | Unclear risk | Clearly stated inclusion and exclusion criteria and described method of statistical analysis used. Baseline between‐group differences existed in BMI which could possibly impact on HRQoL (primary outcome). |
| Methods | Design: single‐centre, parallel RCT; 3‐month duration (8 weeks training, 4 weeks detraining). Inclusion criteria: potential participants included 111 children previously diagnosed using a genetic test for CF and treated at the Children’s Hospital Nino Jesus in Madrid. Males or females aged 5 to 15 years and living in the Madrid area (able to attend training sessions). Exclusion criteria: severe lung deterioration, as defined by an FEV1 < 50% predicted; unstable clinical condition (i.e. hospitalisation within the previous 3 months); Burkholderia cepacia infection; musculoskeletal disease or any other disorder impairing exercise. | |
| Participants | 22 participants with CF. Group demographics. Training group (n = 11): mean (SEM, range) age 11 years (3 years, 5 ‐ 15 years). Control group (n = 11): mean (SEM, range) age 10.0 years (2 years, 6 ‐ 14 years). | |
| Interventions | 8‐week intrahospital programme followed by a 4‐week detraining period. All participants received the same chest physiotherapy during the entire study period. Group 1: endurance and strengthening exercises, 3 times per week. Group 2: control. | |
| Outcomes | Included in this study were: VO2 peak; upper and lower body strength (bench press, leg press, seated row); FEV1; FVC; PImax; SaO2 at peak exercise; body weight; BMI; fat‐free mass; body fat; HRQoL; Timed Up and Go test (TUG); Timed Up and Down Stairs test (TUDS). | |
| Notes | Additional raw data for all included outcomes provided by the authors | |
| Risk of bias | ||
| Bias | Authors' judgement | Support for judgement |
| Random sequence generation (selection bias) | Unclear risk | Participants were randomly assigned to exercise or control group with a block on gender based on the randomisation sequence. No details about how randomisation sequence was generated. |
| Allocation concealment (selection bias) | Unclear risk | Not discussed. |
| Blinding of participants and personnel (performance bias) | Unclear risk | Not possible to blind participants to intervention. Personnel involved in training not blinded. |
| Blinding of outcome assessment (detection bias) | Low risk | Outcome assessors were blinded to participants group assignment. |
| Incomplete outcome data (attrition bias) | High risk | Clear description of missing outcome data. 5 participants could not be assessed at different time points (1 post‐intervention and 4 after detraining) due to hospitalisations (n = 3), relocation (n = 1) and parents who declined further evaluation (n = 1). Dropout rate was unbalanced with 28% in the control group and 9% in the intervention group after the detraining period. Intention‐to‐treat analysis was used and missing outcome data (at post‐training or detraining visit) were replaced by baseline data. |
| Selective reporting (reporting bias) | Low risk | All outcomes detailed in methods were reported in results. Data reported for all time points. |
| Other bias | High risk | Some raw data were made available, but there were inconsistencies between raw data and data reported in the original publication. There were significant between‐group differences in primary (VO2 peak) and secondary (strength measures) outcome measures at baseline. |
| Methods | Design: single‐centre, parallel RCT; 3‐month study (8 weeks training, 4 weeks detraining). Inclusion criteria: potential participants included 95 outpatient children previously diagnosed with CF by genetic testing and treated at the Children’s Hospital Nino Jesus in Madrid. Males or females aged 6 – 17 years and living in the Madrid area (able to attend training sessions). Exclusion criteria: severe lung deterioration (FEV1 < 50% predicted); unstable clinical condition (i.e., hospitalisation within the previous 3 months); Burkholderia cepacia infection or any disorder (e.g., musculoskeletal) impairing exercise. | |
| Participants | 20 participants with CF. Group demographics Training group (n = 10): mean (SEM) age 11.1 (1.1) years. Control group (n = 10): mean (SEM) age 10.1 (1.1) years. | |
| Interventions | 8‐week programme followed by a 4‐week detraining period. All participants received the same standard chest physiotherapy. Group 1: whole body aerobic and weight training 3 times per week, plus two daily inspiratory muscle training sessions Group 2: control group performed inspiratory muscle training only at a low intensity. | |
| Outcomes | Included in this study were: VO2 peak; FVC; FEV1; PImax; SaO2 at peak exercise, muscle strength; body weight; body fat; fat‐free mass; and HRQoL. | |
| Notes | Additional raw data for all included outcomes provided by the authors | |
| Risk of bias | ||
| Bias | Authors' judgement | Support for judgement |
| Random sequence generation (selection bias) | Unclear risk | Randomisation to intervention or control group with block on gender. No details given for sequence generation. |
| Allocation concealment (selection bias) | Unclear risk | Not discussed. |
| Blinding of participants and personnel (performance bias) | Unclear risk | Not possible to blind participants to intervention. Personnel involved in training not blinded. |
| Blinding of outcome assessment (detection bias) | Low risk | Outcome assessors were blinded to participants group assignment. |
| Incomplete outcome data (attrition bias) | High risk | Clear description of missing outcome data. 3 participants of the control group could not be assessed at different time points (1 for post‐intervention and detraining phase and 2 after detraining phase) due to hospitalisation for lung transplantation preparation (n = 1), infection with Burkholderia cepacia (n = 1) and refusal (n = 1). Unbalanced distribution of dropouts. Dropout rate in the control group was 30% versus none in the intervention group. Intention‐to‐treat analysis was reported, but it is not clear how missing data were handled. |
| Selective reporting (reporting bias) | Low risk | All outcome detailed in methods were reported in results. Data reported for all time points. |
| Other bias | High risk | Some raw data were made available, but there were inconsistencies between raw data and data reported in the original publication. Significant between‐group differences in primary outcomes (VO2 peak and strength measures) existed at baseline. |
| Methods | Design: single‐centre, parallel RCT, 3‐year duration. Inclusion criteria: participants with CF aged 7 ‐ 19 years with an FEV1 > 40% predicted. Exclusion criteria: not specified. | |
| Participants | 65 participants with CF; 2 groups similar at baseline. 7 dropouts. Exercise group (n = 30): mean (SD) age 13.4 (3.9 years). Control group (n = 35): mean (SD) age 13.3 (3.6) years. | |
| Interventions | Long‐term aerobic study. Group 2: maintained regular activity (control). | |
| Outcomes | Included in this study were: FVC; FEV1; FEF25‐75; PEFR; TV; VO2 peak; VCO₂; peak exercise heart rate; peak exercise VE; VE peak/MVV; RER; blood pressure; % of ideal weight for height; compliance and sense of well‐being; feasibility of exercise; hospital stays and number of days in hospital; chest X‐ray; and Schwachman scores. | |
| Notes | ||
| Risk of bias | ||
| Bias | Authors' judgement | Support for judgement |
| Random sequence generation (selection bias) | Low risk | Computer‐generated randomisation sequence. |
| Allocation concealment (selection bias) | Unclear risk | Not discussed. |
| Blinding of participants and personnel (performance bias) | Unclear risk | Not possible to blind participants to intervention. Unclear whether personnel blinded. |
| Blinding of outcome assessment (detection bias) | Low risk | Pulmonary function assessors were blinded to group assignment (primary outcome measure). |
| Incomplete outcome data (attrition bias) | Unclear risk | Clear description and details about 7 dropouts were recorded. Intention‐to‐treat analysis was reported to yield similar results for pulmonary function. Results were only reported for 65 participants who completed the 2‐year follow up. |
| Selective reporting (reporting bias) | Low risk | All outcome detailed in methods were reported in results. Data reported for all time points. |
| Other bias | Unclear risk | Groups similar at baseline. |
| Methods | Design: single‐centre, parallel RCT; hospital admission for recurrent chest infections. Inclusion criteria: children with CF, aged 8 ‐ 16 years who were admitted the the Royal Alexandria Hospital for Children for the treatment of an infectious pulmonary exacerbation. Exclusion criteria: children with known pulmonary hypertension, or who required daytime oxygen prior to the pulmonary exacerbation which led to the hospital admission. | |
| Participants | 66 children with CF (28 males, 38 females). No dropouts. Aerobic training group (n = 22): mean (SD) age 13.2 (2.0) years), 9 males and 13 females. Resistance training group (n = 22): mean (SD) age 13.1 (2.1) years, 10 males and 12 females. Control group (n = 22): mean (SD) age 13.2 (2.0) years, 9 male and 1 females. | |
| Interventions | Short‐term aerobic and anaerobic/strength training study during hospital admission (mean duration 18.7 days, range 14 ‐ 36 days). Group 2: 30 min supervised resistance training 5 times per week. Group 3: no specific training. | |
| Outcomes | Included in this study were: VO2 peak; peak VE; VCO₂; peak HR; HRQoL; FEV1; FVC; weight; lower limb strength; and fat‐free mass. | |
| Notes | ||
| Risk of bias | ||
| Bias | Authors' judgement | Support for judgement |
| Random sequence generation (selection bias) | Unclear risk | Random allocation in sets of 6. No details given for generation of sequence. |
| Allocation concealment (selection bias) | Low risk | Concealed information inside opaque envelopes. |
| Blinding of participants and personnel (performance bias) | Unclear risk | Not possible to blind participants to intervention. Unclear whether personnel blinded. |
| Blinding of outcome assessment (detection bias) | Unclear risk | Unclear whether outcome assessors blinded. |
| Incomplete outcome data (attrition bias) | Low risk | Stated no dropouts. |
| Selective reporting (reporting bias) | Unclear risk | Did not report on all secondary outcomes detailed in methods (e.g. VE, VCO2, RQ) in results. Data reported for all time points. |
| Other bias | Low risk | Clearly stated inclusion and exclusion criteria. |
| Methods | Design: single‐centre, parallel RCT; hospital admission for routine assessment of clinical condition. Inclusion criteria: not specified. Exclusion criteria: not specified. | |
| Participants | 12 children with CF, 8 males, mean age 12.3 years. | |
| Interventions | Short‐term aerobic study. Group 2: normal hospital treatment. | |
| Outcomes | Included in this study were: FEV1 and FVC. | |
| Notes | This study has only been reported in a single abstract and therefore the information is limited. | |
| Risk of bias | ||
| Bias | Authors' judgement | Support for judgement |
| Random sequence generation (selection bias) | Unclear risk | Described as randomised, but no details given for sequence generation. |
| Allocation concealment (selection bias) | Unclear risk | Not discussed. |
| Blinding of participants and personnel (performance bias) | Unclear risk | Not possible to blind participants to intervention. Unclear whether personnel blinded. |
| Blinding of outcome assessment (detection bias) | Unclear risk | Unclear whether outcome assessors blinded. |
| Incomplete outcome data (attrition bias) | Unclear risk | No details of dropouts or whether intention‐to‐treat analysis had been used. |
| Selective reporting (reporting bias) | Unclear risk | This is an abstract so unable to assess if all outcome used in methods were reported in results. Data were reported for all time points. |
| Other bias | Unclear risk | Do not state inclusion or exclusion criteria, nor do they describe the methods of statistical analysis used. |
BMI: body mass index
CF: cystic fibrosis
CFRD: cystic fibrosis‐related diabetes
FEF25‐75: forced expiratory flow 25‐75%
FEV1: forced expiratory volume at one second
FRC: functional residual capacity
FVC: forced vital capacity
HRQoL: health‐related quality of life
IGT: impaired glucose tolerance
MP: mean power
MVV: maximal voluntary ventilation
PFS: progression‐free survival
PImax: maximum inspiratory mouth pressure
PP: peak power
Raw: airways resistance
RCT: randomised controlled trial
RER: respiratory exchange ratio
RR: respiratory rate
RV: residual volume
SaO2: oxygen saturation
SD: standard deviation
SEM: standard error of the mean
SGAW: specific airways conductance
TLC: total lung capacity
VE: minute ventilation
VO2 peak: peak oxygen consumption
VCO2: carbon dioxide production
VO2: oxygen uptake
W: watt
WAnT: Wingate Anaerobic Test
6MWT: six‐minute walk test
Characteristics of excluded studies [ordered by study ID]
| Study | Reason for exclusion |
| This study compared the acute cardiovascular response in participants playing different active video games. No control group included. | |
| This study was designed with the exercise group as the control group, therefore we could not compare data with baseline, no physical exercise training as per our protocol. | |
| IMT training and not physical exercise training as per our protocol. | |
| Not a randomised controlled study. | |
| This study was designed with the aim of comparing the effectiveness of a single treatment sessions of exercise and PEP on sputum clearance. Participants in this study did not undertake a programme of physical training. | |
| IMT training and not physical exercise training as per our protocol. | |
| This study was designed with the aim of comparing the effectiveness of a single treatment session of exercise and PEP on sputum clearance. Participants in this study did not undertake a programme of physical training. | |
| Not a physical exercise training study, comparison of different tests for assessing exercise capacity. | |
| Not a randomised controlled study. | |
| Study of respiratory muscle endurance training, not a physical exercise training study. | |
| This study was designed with the aim of comparing the effectiveness of a single treatment session of exercise or physiotherapy or exercise and physiotherapy on sputum clearance and lung function. Participants in this study did not undertake a programme of physical training. | |
| Study evaluating the clinical usefulness of the steep ramp test and not a physical training study. | |
| No control group with no physical training. | |
| Study of methods for evaluating muscle function and not a physical training study. | |
| This study involved respiratory muscle training exclusively. This intervention does not constitute physical training as defined within our protocol. | |
| Not a randomised controlled study. | |
| No control group with no physical training. | |
| Study duration insufficient, | |
| Study duration insufficient, | |
| Not a randomised controlled study. | |
| This study was designed with the aim of comparing the effectiveness of a single treatment session of exercise or positive expiratory pressure on lung function. Participants in this study did not undertake a programme of physical training. | |
| Study of respiratory muscle endurance training and not a physical training study. | |
| No control group with no physical training. | |
| Evaluation of the incremental step test not a study of physical training. | |
| Not a randomised controlled study. | |
| Not a physical exercise training study, examines effect of a singing program compared to no singing. | |
| Study duration insufficient, only 3 single day interventions on non‐consecutive days of a week. | |
| Compares Nintendo Wii exercise training to an existing exercise programme, no control group with no physical training. | |
| This study was designed with the aim of comparing the effectiveness of a single treatment session of exercise and FET or positive expiratory pressure and FET or postural drainage, thoracic expansion exercises and FET on mucous clearance. Participants in this study did not undertake programme of physical training. | |
| No physical exercise training study, study looks at effect of non‐invasive ventilation on exercise capacity and lung function. | |
| No control group with no physical training. | |
| Not a randomised controlled study, single arm trial of physical exercise, | |
| Not a randomised controlled study, single arm trial of physical exercise, | |
| A study of CFTR potentiator therapy and effects on exercise capacity. | |
| A study of CFTR potentiator therapy and effects on exercise capacity. | |
| Not a randomised controlled study, study of the effect of antibiotics on muscular strength and not physical training. | |
| Not a randomised controlled study. | |
| Compares aerobic training to upper‐body strength training, no control group with no physical training. | |
| IMT training and not physical exercise training as per our protocol. | |
| Study to evaluate the efficacy of the test of incremental respiratory endurance, not a physical training study. | |
| Not a randomised controlled study. | |
| Not a physical exercise training study. This study was designed to develop an incremental field exercise test for children with CF. | |
| Acute study comparing exercise with expiratory breathing manoeuvres to breathing techniques for airway clearance. | |
| Not a randomised controlled study. | |
| A comparison of two exercise interventions (Xbox Kinect versus stationary cycle). No control group with no physical training. | |
| No control group with no physical training. | |
| Not a randomised controlled study. | |
| Not a randomised controlled study. | |
| Study to evaluate modified shuttle test and not a study of physical training. | |
| This study evaluated neuromuscular electrical stimulation prior to endurance training in people with CF. No control group with no physical training. | |
| Intervention only given on 3 single days, comparison of physical training and albuterol for airway clearance. |
CF: cystic fibrosis
FET: forced expiration technique
IMT: inspiratory muscle training
PEP: positive expiratory pressure
Characteristics of studies awaiting assessment [ordered by study ID]
| Methods | RCT. Parallel design. Duration: 12 weeks. |
| Participants | Target sample size: 150. Inclusion criteria: confirmed diagnosis of CF, hospital inpatient admission (including hospital in the home) for IV antibiotic therapy for a respiratory cause, informed consent, access to the Internet via computer or mobile device. Exclusion criteria: presence of severe co‐morbidity limiting mobilisation or physical activity participation, previous lung transplantation, pregnancy. Age minimum: 12 Years Age maximum: 24 Years Gender: Both males and females |
| Interventions | Intervention group: use of the ActivOnline program, via the Internet, as well as usual care. ActivOnline was developed in accordance of the principles of motivational interviewing and has been used to promote physical activity participation in older adults with chronic respiratory disease. Those allocated to the ActivOnline group will be provided with a unique logon and password to access the ActivOnline program and will be asked to record their daily physical activity and exercise using the secure portal. When logging onto ActivOnline they will be prompted to set goals, will record their PA or exercise using a pedometer or other device of their choice and will regularly enter data about that will be displayed graphically so they can see their progress. Control group: usual care. Usual care provides details for an online resource regarding physical activity participation and physical activity targets for children and young adults (www.nhs.uk/Livewell/fitness/Pages/physical‐activity‐guidelines‐for‐young‐people.aspx) as well as activity and exercise guidance, as indicated, as part of their routine clinical care on hospital discharge. |
| Outcomes | Primary outcome Change in physical activity participation objectively measured via accelerometry Secondary outcomes Change in exercise capacity as measured by the MST |
| Notes | Supported by UK CF Trust. Email confirmation from lead investigator (17 August 2017) that trial has been completed and they are currently analysing data. We hope to obtain data for the CF participants once the trial has been published. |
| Methods | Parallel design RCT. 6‐month intervention. |
| Participants | 38 participants with CF aged 7 ‐ 13 years. No group demographics available. Inclusion criteria: not specified. Exclusion criteria: not specified. |
| Interventions | Group 1 (n = 19): classical physiotherapy plus sport activities 3 times per week. Group 2 (n = 19): classical physiotherapy alone. |
| Outcomes | Eligible for inclusion are: FEV1; FVC; FEF25‐75; number of hospitalisations; participation at school; and activities of daily living. |
| Notes | No information were available in the abstract about types of exercises, intensity, frequency and duration of exercise training. |
| Methods | Design: Modified RCT; motivational incentive‐based walking program for patients hospitalised with pulmonary exacerbation. Series of 2‐week intervals with 1‐week wash‐out periods were created and randomized as either treatment or control. |
| Participants | 29 participants with CF (11 males; 18 females). Group demographics: Intervention group (n = 18) Control group (n = 11) Inclusion criteria: not specified. Exclusion criteria: not specified. |
| Interventions | Intervention group (n = 18): incentive‐based walking program plus standard care including daily (Monday to Friday) physical therapy. Control group (n = 11): standard care including daily (Monday to Friday) physical therapy. |
| Outcomes | Included in this study were: 6MWT distance; vital signs; Bruininks‐Oseretsky Test of Motor Proficiency; strengths assessment score and HRQoL (CFQ‐R). Data were collected within 72 hours of hospital admission and within 48 hours of hospital discharge. |
| Notes |
| Methods | Design: parallel RCT; 6‐week exercise programme followed by a 16‐week home‐based programme. |
| Participants | 89 participants aged 7 ‐ 11 years old and with different lung conditions: asthma (n = 60), CF (n = 12), a history of chronic neonatal lung disease (n = 17). Group demographics are not available. No information on dropouts. Inclusion criteria: not specified. Exclusion criteria: not specified. |
| Interventions | 6‐week exercise programme with weekly exercise sessions followed by a home‐based programme using behaviour change strategies to promote aerobic exercise. Participants were evaluated at baseline, 7 weeks and 24 weeks. Intervention group: n = 45. Control group: n = 44. |
| Outcomes | Included in this study were: aerobic fitness (exercise test not specified); vigorous physical activity; self perception of athletic competence and physical appearance. |
| Notes | We plan to contact the authors to obtain the CF‐specific data. |
| Methods | Design: parallel RCT; single centre comparative effectiveness trial at the Royal Brompton Hospital, London, UK. Phase 2 study. |
| Participants | 72 participants with CF aged over 6 years from the Royal Brompton Hospital, London. Group demographics are not available. Inclusion criteria: not specified. Exclusion criteria: not specified. |
| Interventions | Phase 2 study. Group 1: 8x one‐on‐one Tai Chi sessions then given a DVD and a handout to use at home for 9 months and encouraged to practice up to 5 times per week. Group 2: no treatment (standard care) for the first 3 months (this is the control), then 8x online Tai Chi sessions (e.g. via Skype) and given a DVD and a handout to use at home for 6 months and again encouraged to practice up to 5 times per week. The programme was evaluated at baseline and after 3, 6 and 9 months. |
| Outcomes | Included in this study were: HRQoL; mindfulness, sleep (not specified); medical data (not specified) and respiratory function (not specified); participants' experience; Tai Chi feasibility; perceived health impact and study participation. |
| Notes | We plan to contact the authors to obtain more information on study design and results. |
| Methods | Design: parallel RCT, 10 ‐ 14 day inpatient period at a tertiary hospital followed by a 8 ‐ 12 week home‐based program. Blinded assessor. |
| Participants | 31 participants with CF aged 8.5 to 17.6 years and with a mean FEV1 of 66.74 %. Group demographics Group 1: exercise program (n = 15). Group 2: standard physiotherapy exercise (n = 16). Inclusion criteria: not specified. Exclusion criteria: not specified. |
| Interventions | Group 1 (n = 15): a novel exercise program including a portable exercise package (FitKit™ ‐ exercise in a bag including instruction cards, exercise equipment and daily exercise log). Group 2 (n = 16): standard physiotherapy exercise practice. |
| Outcomes | Performance on study measures (scoped within the framework of the International Classification of Functioning, Disability and Health model) ‐ details not reported. Assessment at 3 time points:
|
| Notes | No data available currently, but will be added when study published in full. |
| Methods | Design: cross‐over RCT; single blind (outcome assessor); 6 months duration; single‐centre study at Children's Hospital of Pittsburgh, USA. |
| Participants | Enrolment goal: 38 participants with CF. Inclusion criteria: CF diagnosis; males and females; age 10 ‐ 18 years; reliable pulmonary function test; living at home; able to read; able to ride a stationary bike; able to walk and/pr run on a treadmill. Exclusion criteria: enrolled in another intervention study; participation in structured aerobic exercise for 30 continuous minutes 3 times per week; sibling enrolled in study. |
| Interventions | Intervention group: home‐based exercise programme at least 3 times per week for 6 months with telephone reinforcement. After the first 6 months, participants receive instructions to maintain their self‐regulated exercise activity for another 6 months without receiving telephone calls. Control group: standard recommendations for exercise activity during the first 6 months. Thereafter, the control group will cross over to the self‐regulated exercise without telephone reinforcement. |
| Outcomes | Included in this study were: VO2 peak; peak workload; VO2 150 (VO2 at a heart rate of 150 bpm per minute during an exercise test); FEV1; sustained phonation time; HRQoL (CF questionnaire and well‐being scale) and exercise experiences of children and parents assessed with interviews. |
| Notes | A 6‐month program of self‐regulated, home‐based exercise programme with telephone reinforcement on cardiorespiratory fitness, pulmonary function and HRQoL of children with CF, compared to controls. A secondary aim is to exploring the exercise experiences of the children and parents. The principal investigator confirmed that the trial is completed and data are currently being analyzed. |
| Methods | Design: parallel RCT; open‐label; duration 24 months; partially‐supervised; single‐centre study at University Hospital, Strasbourg, France. |
| Participants | Enrolment goal: 50 participants with CF. Inclusion criteria: males and females aged 15 ‐ 65 years with CF diagnosed by clinical history and positive genetic or sweat testing; signed informed consent (or by parents for paediatric participants); participant covered by social security; participant has no indication of cardiac issues; stable disease (FEV1 > 1000 mL); in the case of insulin‐dependent diabetes, it must be stable; participant had been informed of the results of the medical examination; women of childbearing age confirmed not to be pregnant by urine test. Exclusion criteria: participant with unstable diabetes or known cardiac issues; participant on transplant list. |
| Interventions | Intervention group: partially‐supervised exercise training programme with the aim of exercising 3x per week over 24 months; exercise intensity controlled with heart rate monitors and supported by exercise coaches. Control group: normal daily activities and physiotherapy regimen. |
| Outcomes | Included in this study were: VO2 peak; HRQoL (CFQ‐14+ and SF 36). |
| Notes | The principal investigator of this study responded on our request and confirmed that the study has been closed prematurely due to local organisational and recruitment problems. No publication is planned for this study. |
| Methods | Design: parallel RCT; duration 6 weeks; open‐label; single‐centre study at Universidad Autonoma de Madrid, Spain. |
| Participants | Enrolment goal: 41 participants with CF. Inclusion criteria: males and females aged 7‐18 years diagnosed with CF; clinically stable with no exacerbations of the disease in the previous 6 weeks to the inclusion date. Exclusion criteria: clinical evidence of cardiovascular, neuromuscular or osteo‐articular co‐morbidities that limit the participation in exercise programmes; lung transplant candidates and participants that followed any kind of rehabilitation programme 12 months before the study. |
| Interventions | Intervention group: 30 ‐ 60 min exercise using a Nintendo Wii platform with the game EA SPORTS ACTIVE 2, 5 days/week for 6 weeks. The exercise activities are loaded into each participant's console during the clinical interview and the exercises adjusted according to their age: <12 years and >13 years. The program consists of 6 different workouts (1st and 2nd weeks: legs exercises; 3rd week: upper limb exercises; 4th week: thorax exercises; 5th and 6th weeks: cardio exercises) with gradually increasing intensities reaching the maximum load at the end of the training. Control group: routine clinical management. |
| Outcomes | Included in this study were: exercise capacity (6MWT; modified shuttle walk test); muscular strength (horizontal jump test, medicine ball throw, handgrip strength); HRQoL using 3 versions of the CFQ‐R (CFQ‐R 6‐11, CFQ‐R 14+, CFQ‐R Parents). |
| Notes | The aim of this study is to evaluate the efficacy of a long‐term domiciliary exercise program using the Wii video game platform as a training modality in people with CF. |
| Methods | Design: parallel RCT; outcome assessor (exercise supervisor) blinded; single‐centre study at Hospital de Clínicas de Porto Alegre, Brazil. |
| Participants | Estimated enrolment: 68 participants with CF. Inclusion criteria: males and females age 16 ‐ 50 years, diagnosed with CF according to consensus criteria and regularly followed up in the Hospital de Clinicas de Porto Alegre Programme for Adolescents and Adults with CF; admitted to hospital (for at least 24 hours) due to exacerbation of lung disease. Exclusion criteria: participants with cardiac, orthopedic or trauma complications that make it impossible to perform the proposed exercises; pregnancy; participants with haemodynamic instability, massive haemoptysis, pneumothorax, and continuous use of non‐invasive ventilation. |
| Interventions | Intervention group: aerobic and anaerobic exercise 5 times a week during the hospitalisation period, with sessions lasting about an hour, programme beginning within 48 hours of admission. Control group: physiotherapeutic follow‐up (including respiratory physiotherapy, inhalation therapy and techniques for removal of secretions) performed by the physiotherapist of the programme for adults with CF during the hospitalisation period. |
| Outcomes | Included in this study were: primary outcome: 6MWT distance; secondary outcomes: FEV1; HRQoL (CFQ‐R); C‐reactive protein; interleukin‐6; interleukin‐8 and tumor necrosis factor. |
| Notes | This study study aims to evaluate the effects of an early rehabilitation programme based on aerobic training and muscle strength training in adolescent and adult participants with CF hospitalised at Hospital de Clinicas de Porto Alegre for exacerbation of lung disease. |
| Methods | Design: parallel RCT ("Do More, B'More, Live Fit"), duration 6 months; single‐centre study at Johns Hopkins University, Baltimore, US. |
| Participants | Enrollment goal: 60 participants with CF. Inclusion criteria: males and females aged 12 ‐ 21 years old with CF and cared for at Johns Hopkins; participants must have a smartphone and/or computer with universal serial bus (USB) to set‐up FitBit Flex. Exclusion criteria: FEV1 < 40% predicted; individuals already participating in vigorous physical activity (as assessed by the study team) in year‐round organised sports and/or aerobic exercise for longer than 30 minutes more than 5x per weeks may or may not be included in this study at the discretion of the principal investigator and study team. |
| Interventions | Intervention group: at baseline assessment participants given individualised exercise prescriptions with the aim of achieving 30‐minutes of an endurance‐style exercise (team sports, walking, jump roping, stair climbing or more complex Tabata‐style workouts) 5 times/week for 6 months. At 4‐6 weeks and 8‐10 weeks post‐enrolment, participants attend a follow‐up 30‐minute session which will vary based on initial assessment and previous exercise prescription success, but will include strength training for major muscles groups and/or flexibility exercises with yoga as well as reinforcement of previously learned techniques with additional individualised recommendations. Participants will also receive motivational messages starting 14 days after enrolment via preferred contact method (SMS, telephone call and/or email) every 3‐4 days over the 6‐month study period. Participants also given access to "Do More, B'More, Live Fit" web page which includes spotlighted exercises, instructional exercise photos and videos; also invited to join the "Do More, B'More, Live Fit" Activity Group via the FitBit Dashboard and to friend the study team members and other exercise‐intervention participants in order to take part in FitBit step‐goal challenges. Control group: at baseline assessment, the FitBit daily step goal is set at the manufacturer standard 10,000 steps. At routine clinic visits, baseline and follow‐up assessments (3 and 6 month clinic visits) participants given generic, non‐personalised encouragement and recommendations (if requested by the participant) for physical activity. At the 3‐ and 6‐month visits, exercise is reinforced with generic encouragement, export FitBit data and review any missing data concerning for equipment failure or user error. |
| Outcomes | Included in this study were: Primary outcomes: LCI (LCI 2.5 and LCI 5.0); daily activity via FitBit step count and daily step count (mean, median and highest daily) recorded through participant FitBit flex. Secondary outcomes: FEV1 % predicted; self‐reported physical activity (Habitual Activity estimation Scale); HRQoL (CFQ‐R); exercise capacity (modified shuttle walk test); acceptability and feasibility of the programme using semi‐structured interviews. |
| Notes | This study evaluates the "Do More, B'More, Live Fit", a 6‐month fitness programme designed to optimise exercise habits of participants with CF through structured exercises with personalised coaching, exercise equipment including the FitBit Flex, online support and motivational messages delivered electronically. The intervention incorporates fitness preferences and encompasses endurance, strength and flexibility exercises while adjusting to physical fitness needs. The hypothesis is that intervention participants will have increased and sustained engagement and better health outcomes compared to control group participants. |
| Methods | Design: parallel, prospective controlled clinical study; single‐centre study; not clear from the abstract whether participants were randomly allocated to different interventions. |
| Participants | 20 participants with CF, mean age 13.21 years. Intervention group: n = 10. Control group: n = 10. Inclusion criteria: not specified Exclusion criteria: not specified. |
| Interventions | Group 1: physical training at a private clinic and physiotherapy clinic. Group 2: no physical training. |
| Outcomes | Included in this study were: lung function (not specified), 3‐minute step test, maximum exertion test (not specified), collection of blood samples and a quality of life questionnaire. |
| Notes | Unclear whether this is a RCT. We contacted one author of the abstract, but have not received a reply to date. No information available in the abstract about types of exercises, intensity, frequency and duration of exercise training. |
| Methods | Design: parallel RCT. |
| Participants | 35 participants aged 8 ‐ 21 years with an FEV1 < 60%, who were admitted for a ≥ 10 day hospitalisation for a CF exacerbation. 29 participants, mean (SD) age 15 (3.5) years, completed the study; 4 dropouts were recorded. Inclusion criteria: not specified. Exclusion criteria: not specified. |
| Interventions | Training for PT management of a CF exacerbation during an inpatient hospital stay. Group 1: standardized moderate‐to‐high intensity resistance and aerobic training consisting of 1 hour of resistance training and flexibility training 3 days per week and 20 ‐ 30 min of aerobic and balance training 2 days per week. Group 2: current standard of care which included 20 ‐ 30 min of variable intensity aerobic training 5 days per week. |
| Outcomes | MST and multiple measures of peripheral muscle performance at admission and discharge. Adverse effects. |
| Notes | Study completed in 2008. |
CF: cystic fibrosis
CFQ‐R: cystic fibrosis questionnaire ‐ revised
FEF25‐75: mid forced expiratory flow
FEV1: forced expiratory volume
FVC: forced vital capacity
HRQoL: health‐related quality of life
MST: modified shuttle test
PT: physical therapy
RCT: randomised controlled trial
SD: standard deviation
VO2 max: maximum oxygen consumption
6MWT: 6‐minute walk test
Characteristics of ongoing studies [ordered by study ID]
| Trial name or title | Effect of exercise orientations in the posture and plantar pressure distribution in children and adolescents with cystic fibrosis. |
| Methods | RCT (open‐label). Design: parallel (2 arms). Duration: 3 months. |
| Participants | Target sample size: 34 Inclusion criteria: diagnosis of CF, clinically stable disease and regular follow‐up at the CF outpatient clinic. Exclusion criteria: children and adolescents with comprehension deficits and/or who present arms/legs problems that would make it impossible to perform the tests. Age minimum: 6 years. Age maximum: 20 years. |
| Interventions | Intervention group (n = 17): participants will receive a written manual with orientations regarding physical activity, including weekly frequency. The manual contains physical activities and stretching orientations and participants are advised to perform their favourite exercise modality with a minimal frequency of 3 times per week, during 40 minutes. The manual also contains a calendar where the participant will mark the days when activities were performed. Control group (n = 17): participants will keep with their regular routine care orientations. |
| Outcomes | Primary outcome General posture improvement: measured by the number of degrees obtained for kyphosis, lordosis, head position and chest size, using a specific software. Secondary outcomes Change in balance (measured using a baropodometer). Lung function using spirometry (FEV1). |
| Starting date | Date of first enrolment; 01 November 2013. Recruitment completed. |
| Contact information | Márcio Vinícius Fagundes Donadio ([email protected]) ‐ União Brasileira de Educação e Assistência ‐ Porto Alegre, RS, Brazil |
| Notes |
| Trial name or title | Effects of exercise intervention program on bone mineral accretion in children and adolescents with cystic fibrosis. |
| Methods | RCT (stratified block randomization, allocation concealed using sequentially numbered, sealed, opaque envelopes, open label). Design: parallel. Single centre. Duration: 1 year. |
| Participants | Total sample size: 30. Inclusion criteria: children with confirmed diagnosis of CF (sweat chloride ≥ 60 mEq/l on 2 or more occasions in a child with clinical features suggestive of CF), stable medical condition (not required IV antibiotics for last 1 month prior to enrolment), FEV1 ≥ 20%. Exclusion criteria: children unwilling to participate in the study; presence of any prior diagnosed musculoskeletal disorder such as rheumatoid arthritis, muscular dystrophy, chronic renal failure. Age minimum: 6 years. Age maximum: 18 years. Gender: both. |
| Interventions | Intervention group: exercise program ‐ resistance exercise and plyometric jumping exercise, 1x daily, 3x a week for 1 year. |
| Outcomes | Primary outcome Mean bone mineral density at 1 year. Secondary outcomes Lung function (FEV1 and FVC) at baseline, 3 months, 6 months, 9 months and at the end of 1 year. |
| Starting date | Date of first enrolment: 08 September 2012. |
| Contact information | Sumita Gupta (Physiotherapist) |
| Notes |
| Trial name or title | Effects of a Partially Supervised Conditioning Program in CF (ACTIVATE‐CF, NCT01744561) |
| Methods | Design: parallel RCT; duration 12 months; international, multicentre study. |
| Participants | A total of 292 participants will be recruited. Inclusion criteria: males and females aged 12 years and older with a confirmed diagnosis of CF; FEV1 ≥ 35% predicted and access to Internet. Exclusion criteria: participation in another clinical trial up to 4 weeks prior to the first baseline visit; pregnancy or breast feeding; inability to exercise; more than 4 hours of reported strenuous physical activities per week currently or up to 3 months prior to baseline measurements and not already planned within the coming 6 months; unstable condition precluding exercise (major haemoptysis or pneumothorax within the last 3 months, acute exacerbation and IV antibiotics during the last 4 weeks, planned surgery, listed for lung transplantation, major musculoskeletal injuries such as fractures or sprains during the last 2 months, others according to the impression of the doctor); cardiac arrhythmias with exercise; requiring additional oxygen with exercise; recent diagnosis of diabetes 3 months prior to screening or at screening; recent changes in medication 1 month or less prior to screening (systemic steroids, ibuprofen, inhaled antibiotics, mannitol, DNAse, hypertonic saline); at least one G551D mutation and not on ivacaftor (VX770) yet but planned start or planned stop of ivacaftor during the trial and colonization with Burkholderia cenocepacia. |
| Interventions | Intervention group: addition of 3 hours of intense physical activities per week to baseline activities. Weekly exercise should include at least 30 min of strength building activities and at least 2 hours of aerobic activities. Exercise bouts lasting 20 min or longer will be counted with respect to total weekly training time. Participants are given exercise counselling to boost motivation towards an active lifestyle, strategies include face‐to‐face information, motivational interviewing, clear goal settings, a written "activity contract" with specific information on which activities are scheduled for which day and for how long, a pedometer, a web‐based activity diary (www.activate‐cf.org) providing feedback on missing time in intense activities to reach the weekly goal, and repeated counselling via telephone contacts and during clinic visits. A full manual describing the intervention and all intervention materials including the website are available in four languages: Dutch, English, French, and German. Control group: the control group is requested to their keep activity level constant. |
| Outcomes | Primary outcome: FEV1 % predicted (change from baseline to 6 months) Secondary outcomes: VO2 peak (% predicted change from baseline to 6 months and baseline to 12 months); maximal aerobic power (% predicted change from baseline to 6 months and baseline to 12 months); steps per day (change from baseline to 6 months and baseline to 12 months); exercise steps per day (change from baseline to 6 months and baseline to 12 months); self‐reported physical activity (baseline to 6 months and baseline to 12 months); FEV1 (% predicted, change from 6 months to 12 months and baseline to 12 months); FVC (% predicted, change from baseline to 6 months and baseline to 12 months); residual volume in % of total lung capacity (change from baseline to 6 months and baseline to 12 months); time to first exacerbation (baseline to 6 months and baseline to 12 months); number of upper respiratory tract infections from diary (baseline to 6 months and baseline to 12 months); days on additional oral or IV antibiotics from questionnaire (baseline to 6 months and baseline to 12 months); body mass index (baseline to 6 months and baseline to 12 months); muscle mass (baseline to 6 estimated from skinfold thickness (baseline to 6 months and baseline to 12 months); body fat estimated from skinfold thickness (baseline to 6 months and baseline to 12 months); HRQoL (CFQ‐R, baseline to 6 months and baseline to 12 months); depression, anxiety and stress scores from Depression Anxiety Stress Scales (baseline to 6 months and baseline to 12 months); plasma glucose concentrations 1 and 2 hours after a standardised glucose load (standardised oral glucose tolerance test only for participants without CF‐related diabetes mellitus (baseline to 9 months); adverse events possibly or likely related to exercise (causality as judged by investigator, baseline to 6 months and baseline to 12 months); severe adverse events and serious adverse events (baseline to 6 months and baseline to 12 months). Other outcome measures: compliance with the exercise goal based on questionnaire and diary (baseline to 6 months and baseline to 12 months); lung clearance index based on nitrogen multiple breath washout, in selected centres only (baseline to 6 months and baseline to 12 months); time spent in moderate‐and‐vigorous physical activity based on accelerometry, in selected centres only (baseline to 6 months and baseline to 12 months); bone mineral density and body composition based on dual energy x‐ray absorptiometry, in selected centres only (baseline to 6 months and baseline to 12 months); mucociliary clearance with exercise based on nuclear medicine scans, US centres only (baseline to 6 months). |
| Starting date | July 2014 |
| Contact information | Prof. Dr. Helge U Hebestreit Telephone: +49 931 201 22 728 E‐mail: hebstreit@uni‐wuerzburg.de |
| Notes | ACTIVATE‐CF is an international, multicentre, randomised controlled trial to assess the effects of additional intense physical activity on a variety of outcomes. A combination of several strategies is used to boost motivation towards an active lifestyle. The primary objective of this study is to evaluate the effects of a 12‐months partially supervised exercise intervention along with regular motivation on FEV1 in a large international group of people with CF. |
| Trial name or title | Increase Tolerance for Exercise and Raise Activity Through Connectedness Trial (INTERACT) |
| Methods | Design: parallel RCT, single‐centre study at Boston Children’s Hospital, USA. |
| Participants | Enrolment goal: 80 participants with CF. Inclusion criteria: males and females aged 18 years and older with a confirmed diagnosis of CF; able to complete at least level 1 of the baseline exercise fitness test; participants must not have required IV antibiotics for a CF exacerbation within 30 days of starting the study. Exclusion criteria: pregnancy at enrolment; a history of CF exacerbation requiring IV antibiotics with the last month; use of a fitness tracker or similar product with 6 months of enrolment. |
| Interventions | Intervention group: given a Fitbit and followed for 1 year, completing surveys and exercise tests. Control group: usual care for 1 year, then offered a Fitbit in the 2nd year. Followed to assess use of Fitbit and health outcomes. |
| Outcomes | Included in this study were: Primary outcome: submaximal exercise capacity (graded exercise test: 2 years at enrolment, 6 months, 12 months, 24 months) Secondary outcomes: Fitbit activity data (2 years); self‐reported physical activity (Habitual Activity Estimation Scale, 2 years); FEV1 relative change (% predicted, 2 years); FEV1 from before study (baseline, to each data collection time point, and from one data collection time point to the next); FVC relative change (% predicted, 2 years); FVC from before study (baseline, to each data collection time point, and from one data collection time point to the next); FEF25‐75 relative change (% predicted, 2 years; FEF25‐75 from before study (baseline, to each data collection time point, and from one data collection time point to the next); incidence of exacerbations requiring IV antibiotics (2 years); body mass index (2 years); HRQoL (CFQ‐R, 2 years); overall qualitative assessment of participant’s satisfaction with the Fitbit (2 years; 6‐month time point); overall qualitative assessment of participant's potential barriers to Fitbit use (2 years, 6‐month time point); qualitative data obtained by open‐ended interview; depression (PHQ9, 2 years: enrolment, 6 months, 12 months, 18 months, 24 months); anxiety (GAD‐7, 2 years: enrolment, 6 months, 12 months, 18 months, 24 months). |
| Starting date | March 14, 2016 |
| Contact information | Ahmet Uluer, Director, Adult Cystic Fibrosis Program, Boston Children's Hospital. |
| Notes | The aim of this study is to evaluate whether the use of a Fitbit device and an exercise prescription is associated with increased daily activity and in turn increased exercise tolerance in young adult patients with cystic fibrosis (CF). The investigators hypothesize that use of the Fitbit and an exercise prescription will be associated with increased exercise tolerance compared to standard counselling and an exercise prescription alone. |
CES‐D scale: Centre for Epidemiological Studies ‐ Depression scale
CF: cystic fibrosis
CFQ‐R: Cystic Fibrosis Questionnaire‐Revised
FEV1: forced expiratory volume in 1 second
FVC: forced vital capacity
HADS: Hospital Anxiety and Depression Scale
HAES: Habitual Activity Estimation Scale
IV: intravenous
MST: modified shuttle test
PSQI: Pittsburgh Sleep Quality Index
RCT: randomised controlled trial
Data and analyses
| Outcome or subgroup title | No. of studies | No. of participants | Statistical method | Effect size |
| 1 Change in VO2 peak during maximal exercise (ml/min per kg BW) Show forest plot | 3 | Mean Difference (IV, Fixed, 95% CI) | Subtotals only | |
| Analysis 1.1  Comparison 1 Aerobic training versus no physical training, Outcome 1 Change in VO2 peak during maximal exercise (ml/min per kg BW). | ||||
| 1.1 At hospital discharge | 1 | 44 | Mean Difference (IV, Fixed, 95% CI) | 8.53 [4.85, 12.21] |
| 1.2 At 1 month after discharge | 1 | 44 | Mean Difference (IV, Fixed, 95% CI) | 4.91 [1.13, 8.69] |
| 1.3 At 3 months | 2 | 59 | Mean Difference (IV, Fixed, 95% CI) | 2.29 [‐2.71, 7.29] |
| 1.4 At 6 months | 1 | 25 | Mean Difference (IV, Fixed, 95% CI) | 18.33 [8.95, 27.71] |
| 1.5 At 6 months off training | 1 | 22 | Mean Difference (IV, Fixed, 95% CI) | 9.51 [‐1.32, 20.34] |
| 1.6 At 18 months off training | 1 | 18 | Mean Difference (IV, Fixed, 95% CI) | 2.86 [‐9.70, 15.42] |
| 2 Change in FEV1(% predicted) Show forest plot | 4 | Mean Difference (IV, Fixed, 95% CI) | Subtotals only | |
| Analysis 1.2  Comparison 1 Aerobic training versus no physical training, Outcome 2 Change in FEV1(% predicted). | ||||
| 2.1 At hospital discharge | 1 | 44 | Mean Difference (IV, Fixed, 95% CI) | 2.03 [‐2.31, 6.37] |
| 2.2 At 1 month after discharge | 1 | 44 | Mean Difference (IV, Fixed, 95% CI) | 1.53 [‐2.93, 5.99] |
| 2.3 At 3 months | 2 | 58 | Mean Difference (IV, Fixed, 95% CI) | 7.21 [2.49, 11.94] |
| 2.4 At 6 months | 1 | 25 | Mean Difference (IV, Fixed, 95% CI) | 17.17 [8.59, 25.75] |
| 2.5 At 6 months off training | 1 | 23 | Mean Difference (IV, Fixed, 95% CI) | 16.92 [6.07, 27.77] |
| 2.6 At 18 months off training | 1 | 20 | Mean Difference (IV, Fixed, 95% CI) | 12.45 [1.27, 23.63] |
| 2.7 Annual rate of change over 36 months | 1 | 65 | Mean Difference (IV, Fixed, 95% CI) | 2.01 [‐0.06, 4.08] |
| 3 Change in health‐related quality of life Show forest plot | 1 | Mean Difference (IV, Fixed, 95% CI) | Totals not selected | |
| Analysis 1.3  Comparison 1 Aerobic training versus no physical training, Outcome 3 Change in health‐related quality of life. | ||||
| 3.1 At 1 month after discharge | 1 | Mean Difference (IV, Fixed, 95% CI) | 0.0 [0.0, 0.0] | |
| 4 Change in mean power during WAnT (W per kg BW) Show forest plot | 1 | Mean Difference (IV, Fixed, 95% CI) | Totals not selected | |
| Analysis 1.4  Comparison 1 Aerobic training versus no physical training, Outcome 4 Change in mean power during WAnT (W per kg BW). | ||||
| 4.1 At 3 months | 1 | Mean Difference (IV, Fixed, 95% CI) | 0.0 [0.0, 0.0] | |
| 4.2 At 6 months | 1 | Mean Difference (IV, Fixed, 95% CI) | 0.0 [0.0, 0.0] | |
| 4.3 At 6 months off training | 1 | Mean Difference (IV, Fixed, 95% CI) | 0.0 [0.0, 0.0] | |
| 4.4 At 18 months off training | 1 | Mean Difference (IV, Fixed, 95% CI) | 0.0 [0.0, 0.0] | |
| 5 Change in strength (Newton metres) Show forest plot | 1 | Mean Difference (IV, Fixed, 95% CI) | Totals not selected | |
| Analysis 1.5  Comparison 1 Aerobic training versus no physical training, Outcome 5 Change in strength (Newton metres). | ||||
| 5.1 At hospital discharge | 1 | Mean Difference (IV, Fixed, 95% CI) | 0.0 [0.0, 0.0] | |
| 5.2 At 1 month after discharge | 1 | Mean Difference (IV, Fixed, 95% CI) | 0.0 [0.0, 0.0] | |
| 6 Change in peak work capacity during maximal exercise (W per kg BW) Show forest plot | 1 | Mean Difference (IV, Fixed, 95% CI) | Totals not selected | |
| Analysis 1.6  Comparison 1 Aerobic training versus no physical training, Outcome 6 Change in peak work capacity during maximal exercise (W per kg BW). | ||||
| 6.1 At 3 months | 1 | Mean Difference (IV, Fixed, 95% CI) | 0.0 [0.0, 0.0] | |
| 6.2 At 6 months | 1 | Mean Difference (IV, Fixed, 95% CI) | 0.0 [0.0, 0.0] | |
| 6.3 At 6 months off training | 1 | Mean Difference (IV, Fixed, 95% CI) | 0.0 [0.0, 0.0] | |
| 6.4 At 18 months off training | 1 | Mean Difference (IV, Fixed, 95% CI) | 0.0 [0.0, 0.0] | |
| 7 Annual rate of change in peak work capacity during maximal exercise over 36 month (%) Show forest plot | 1 | Mean Difference (IV, Fixed, 95% CI) | Totals not selected | |
| Analysis 1.7  Comparison 1 Aerobic training versus no physical training, Outcome 7 Annual rate of change in peak work capacity during maximal exercise over 36 month (%). | ||||
| 8 Change in treadmill speed (km/h) Show forest plot | 1 | Mean Difference (IV, Fixed, 95% CI) | Totals not selected | |
| Analysis 1.8 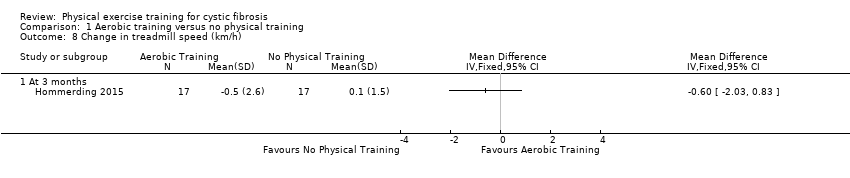 Comparison 1 Aerobic training versus no physical training, Outcome 8 Change in treadmill speed (km/h). | ||||
| 8.1 At 3 months | 1 | Mean Difference (IV, Fixed, 95% CI) | 0.0 [0.0, 0.0] | |
| 9 Change in treadmill exercise time (min) Show forest plot | 1 | Mean Difference (IV, Fixed, 95% CI) | Totals not selected | |
| Analysis 1.9  Comparison 1 Aerobic training versus no physical training, Outcome 9 Change in treadmill exercise time (min). | ||||
| 9.1 At 3 months | 1 | Mean Difference (IV, Fixed, 95% CI) | 0.0 [0.0, 0.0] | |
| 10 Change in heart rate (beats per min) Show forest plot | 2 | Mean Difference (IV, Fixed, 95% CI) | Totals not selected | |
| Analysis 1.10  Comparison 1 Aerobic training versus no physical training, Outcome 10 Change in heart rate (beats per min). | ||||
| 10.1 At rest at 3 months | 1 | Mean Difference (IV, Fixed, 95% CI) | 0.0 [0.0, 0.0] | |
| 10.2 At maximal exercise at 3 months | 1 | Mean Difference (IV, Fixed, 95% CI) | 0.0 [0.0, 0.0] | |
| 10.3 At maximal exercise ‐ annual rate of change over 36 months | 1 | Mean Difference (IV, Fixed, 95% CI) | 0.0 [0.0, 0.0] | |
| 11 Change in oxygen saturation (%) Show forest plot | 2 | Mean Difference (IV, Fixed, 95% CI) | Totals not selected | |
| Analysis 1.11  Comparison 1 Aerobic training versus no physical training, Outcome 11 Change in oxygen saturation (%). | ||||
| 11.1 During maximal exercise at hospital discharge | 1 | Mean Difference (IV, Fixed, 95% CI) | 0.0 [0.0, 0.0] | |
| 11.2 During maximal exercise at 3 months | 1 | Mean Difference (IV, Fixed, 95% CI) | 0.0 [0.0, 0.0] | |
| 11.3 At rest at 3 months | 1 | Mean Difference (IV, Fixed, 95% CI) | 0.0 [0.0, 0.0] | |
| 12 Annual rate of change in peak VE over 36 months (L/min) Show forest plot | 1 | Mean Difference (IV, Fixed, 95% CI) | Totals not selected | |
| Analysis 1.12 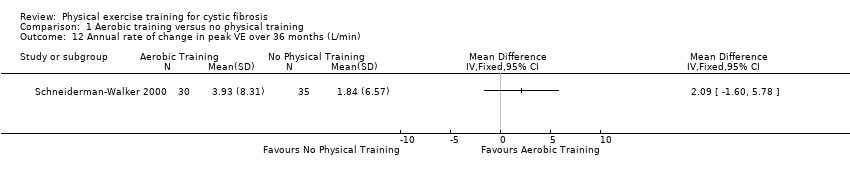 Comparison 1 Aerobic training versus no physical training, Outcome 12 Annual rate of change in peak VE over 36 months (L/min). | ||||
| 13 Change in FVC (% predicted) Show forest plot | 4 | Mean Difference (IV, Fixed, 95% CI) | Subtotals only | |
| Analysis 1.13 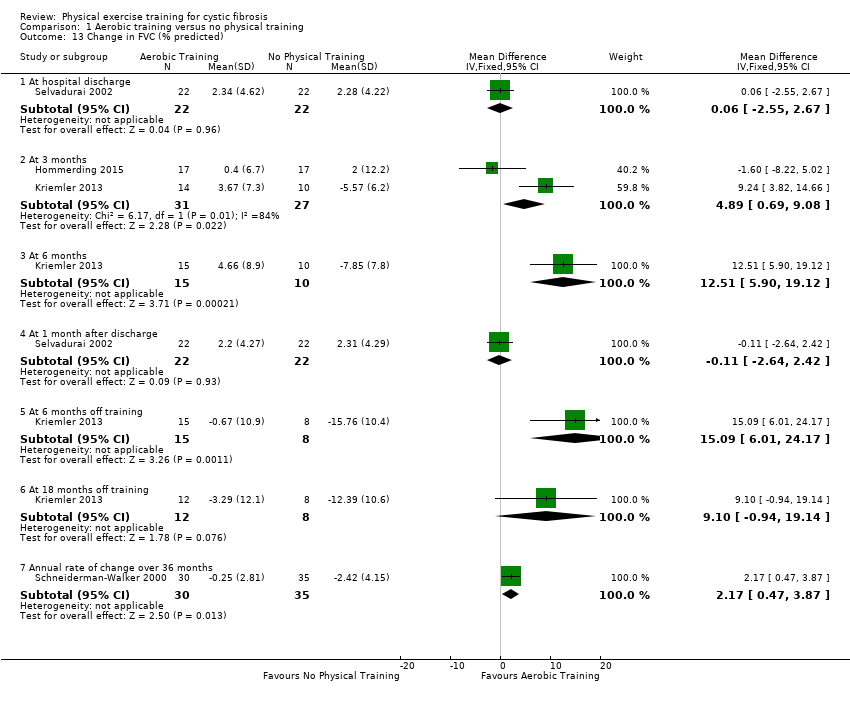 Comparison 1 Aerobic training versus no physical training, Outcome 13 Change in FVC (% predicted). | ||||
| 13.1 At hospital discharge | 1 | 44 | Mean Difference (IV, Fixed, 95% CI) | 0.06 [‐2.55, 2.67] |
| 13.2 At 3 months | 2 | 58 | Mean Difference (IV, Fixed, 95% CI) | 4.89 [0.69, 9.08] |
| 13.3 At 6 months | 1 | 25 | Mean Difference (IV, Fixed, 95% CI) | 12.51 [5.90, 19.12] |
| 13.4 At 1 month after discharge | 1 | 44 | Mean Difference (IV, Fixed, 95% CI) | ‐0.11 [‐2.64, 2.42] |
| 13.5 At 6 months off training | 1 | 23 | Mean Difference (IV, Fixed, 95% CI) | 15.09 [6.01, 24.17] |
| 13.6 At 18 months off training | 1 | 20 | Mean Difference (IV, Fixed, 95% CI) | 9.10 [‐0.94, 19.14] |
| 13.7 Annual rate of change over 36 months | 1 | 65 | Mean Difference (IV, Fixed, 95% CI) | 2.17 [0.47, 3.87] |
| 14 Change in FEF25‐75 (% predicted) Show forest plot | 2 | Mean Difference (IV, Fixed, 95% CI) | Totals not selected | |
| Analysis 1.14 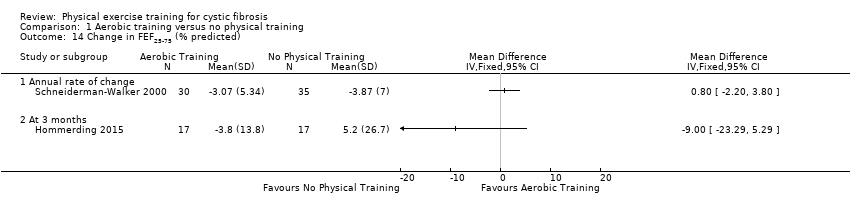 Comparison 1 Aerobic training versus no physical training, Outcome 14 Change in FEF25‐75 (% predicted). | ||||
| 14.1 Annual rate of change | 1 | Mean Difference (IV, Fixed, 95% CI) | 0.0 [0.0, 0.0] | |
| 14.2 At 3 months | 1 | Mean Difference (IV, Fixed, 95% CI) | 0.0 [0.0, 0.0] | |
| 15 Change in RV/TLC (%) Show forest plot | 1 | Mean Difference (IV, Fixed, 95% CI) | Totals not selected | |
| Analysis 1.15 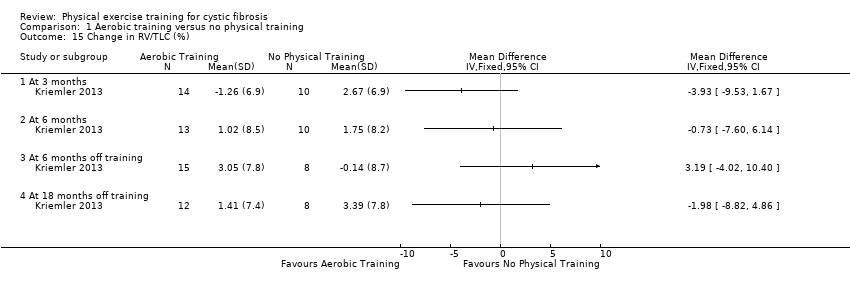 Comparison 1 Aerobic training versus no physical training, Outcome 15 Change in RV/TLC (%). | ||||
| 15.1 At 3 months | 1 | Mean Difference (IV, Fixed, 95% CI) | 0.0 [0.0, 0.0] | |
| 15.2 At 6 months | 1 | Mean Difference (IV, Fixed, 95% CI) | 0.0 [0.0, 0.0] | |
| 15.3 At 6 months off training | 1 | Mean Difference (IV, Fixed, 95% CI) | 0.0 [0.0, 0.0] | |
| 15.4 At 18 months off training | 1 | Mean Difference (IV, Fixed, 95% CI) | 0.0 [0.0, 0.0] | |
| 16 Change in FEV1/FVC (% predicted) Show forest plot | 1 | Mean Difference (IV, Fixed, 95% CI) | Totals not selected | |
| Analysis 1.16  Comparison 1 Aerobic training versus no physical training, Outcome 16 Change in FEV1/FVC (% predicted). | ||||
| 16.1 At 3 months | 1 | Mean Difference (IV, Fixed, 95% CI) | 0.0 [0.0, 0.0] | |
| 17 Change in total physical activity (counts per min) Show forest plot | 1 | Mean Difference (IV, Fixed, 95% CI) | Totals not selected | |
| Analysis 1.17  Comparison 1 Aerobic training versus no physical training, Outcome 17 Change in total physical activity (counts per min). | ||||
| 17.1 At 3 months | 1 | Mean Difference (IV, Fixed, 95% CI) | 0.0 [0.0, 0.0] | |
| 17.2 At 6 months | 1 | Mean Difference (IV, Fixed, 95% CI) | 0.0 [0.0, 0.0] | |
| 17.3 At 6 months off training | 1 | Mean Difference (IV, Fixed, 95% CI) | 0.0 [0.0, 0.0] | |
| 17.4 At 18 months off training | 1 | Mean Difference (IV, Fixed, 95% CI) | 0.0 [0.0, 0.0] | |
| 18 Change in moderate‐to‐vigorous physical activity (hours per week) Show forest plot | 1 | Mean Difference (IV, Fixed, 95% CI) | Totals not selected | |
| Analysis 1.18  Comparison 1 Aerobic training versus no physical training, Outcome 18 Change in moderate‐to‐vigorous physical activity (hours per week). | ||||
| 18.1 At 3 months | 1 | Mean Difference (IV, Fixed, 95% CI) | 0.0 [0.0, 0.0] | |
| 18.2 At 6 months | 1 | Mean Difference (IV, Fixed, 95% CI) | 0.0 [0.0, 0.0] | |
| 18.3 At 6 months off training | 1 | Mean Difference (IV, Fixed, 95% CI) | 0.0 [0.0, 0.0] | |
| 18.4 At 18 months off training | 1 | Mean Difference (IV, Fixed, 95% CI) | 0.0 [0.0, 0.0] | |
| 19 Change in total physical activity (MJ/day) Show forest plot | 1 | Mean Difference (IV, Fixed, 95% CI) | Totals not selected | |
| Analysis 1.19  Comparison 1 Aerobic training versus no physical training, Outcome 19 Change in total physical activity (MJ/day). | ||||
| 19.1 At hospital discharge | 1 | Mean Difference (IV, Fixed, 95% CI) | 0.0 [0.0, 0.0] | |
| 20 Change in body weight (kg) Show forest plot | 1 | Mean Difference (IV, Fixed, 95% CI) | Totals not selected | |
| Analysis 1.20  Comparison 1 Aerobic training versus no physical training, Outcome 20 Change in body weight (kg). | ||||
| 20.1 At hospital discharge | 1 | Mean Difference (IV, Fixed, 95% CI) | 0.0 [0.0, 0.0] | |
| 20.2 At 1 month after discharge | 1 | Mean Difference (IV, Fixed, 95% CI) | 0.0 [0.0, 0.0] | |
| 21 Change in BMI (kg/m2) Show forest plot | 1 | Mean Difference (IV, Fixed, 95% CI) | Totals not selected | |
| Analysis 1.21 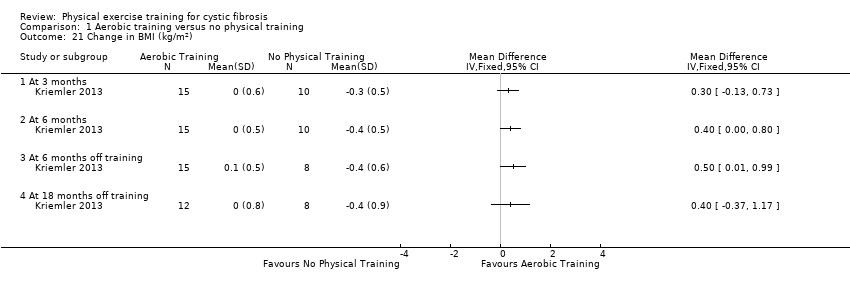 Comparison 1 Aerobic training versus no physical training, Outcome 21 Change in BMI (kg/m2). | ||||
| 21.1 At 3 months | 1 | Mean Difference (IV, Fixed, 95% CI) | 0.0 [0.0, 0.0] | |
| 21.2 At 6 months | 1 | Mean Difference (IV, Fixed, 95% CI) | 0.0 [0.0, 0.0] | |
| 21.3 At 6 months off training | 1 | Mean Difference (IV, Fixed, 95% CI) | 0.0 [0.0, 0.0] | |
| 21.4 At 18 months off training | 1 | Mean Difference (IV, Fixed, 95% CI) | 0.0 [0.0, 0.0] | |
| 22 Change in BMI z score Show forest plot | 1 | Mean Difference (IV, Fixed, 95% CI) | Totals not selected | |
| Analysis 1.22  Comparison 1 Aerobic training versus no physical training, Outcome 22 Change in BMI z score. | ||||
| 22.1 At 3 months | 1 | Mean Difference (IV, Fixed, 95% CI) | 0.0 [0.0, 0.0] | |
| 23 Change in fat‐free mass (kg) Show forest plot | 2 | Mean Difference (IV, Fixed, 95% CI) | Totals not selected | |
| Analysis 1.23  Comparison 1 Aerobic training versus no physical training, Outcome 23 Change in fat‐free mass (kg). | ||||
| 23.1 At hospital discharge | 1 | Mean Difference (IV, Fixed, 95% CI) | 0.0 [0.0, 0.0] | |
| 23.2 At 3 months | 1 | Mean Difference (IV, Fixed, 95% CI) | 0.0 [0.0, 0.0] | |
| 23.3 At 6 months | 1 | Mean Difference (IV, Fixed, 95% CI) | 0.0 [0.0, 0.0] | |
| 23.4 At 1 month after discharge | 1 | Mean Difference (IV, Fixed, 95% CI) | 0.0 [0.0, 0.0] | |
| 23.5 At 6 months off training | 1 | Mean Difference (IV, Fixed, 95% CI) | 0.0 [0.0, 0.0] | |
| 23.6 At 18 months off training | 1 | Mean Difference (IV, Fixed, 95% CI) | 0.0 [0.0, 0.0] | |
| 24 Change in body fat (%) Show forest plot | 1 | Mean Difference (IV, Fixed, 95% CI) | Totals not selected | |
| Analysis 1.24 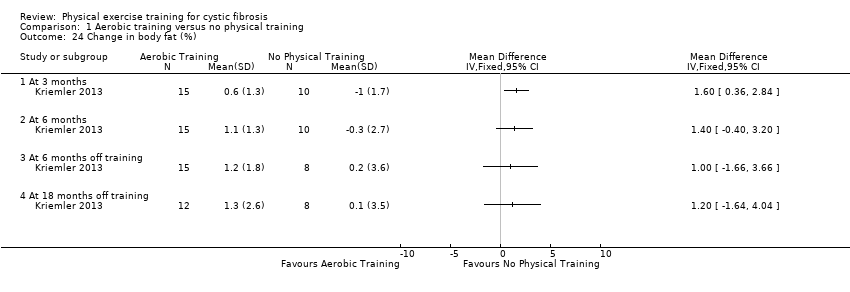 Comparison 1 Aerobic training versus no physical training, Outcome 24 Change in body fat (%). | ||||
| 24.1 At 3 months | 1 | Mean Difference (IV, Fixed, 95% CI) | 0.0 [0.0, 0.0] | |
| 24.2 At 6 months | 1 | Mean Difference (IV, Fixed, 95% CI) | 0.0 [0.0, 0.0] | |
| 24.3 At 6 months off training | 1 | Mean Difference (IV, Fixed, 95% CI) | 0.0 [0.0, 0.0] | |
| 24.4 At 18 months off training | 1 | Mean Difference (IV, Fixed, 95% CI) | 0.0 [0.0, 0.0] | |
| 25 Annual rate of change of ideal weight for height (%) Show forest plot | 1 | Mean Difference (IV, Fixed, 95% CI) | Totals not selected | |
| Analysis 1.25  Comparison 1 Aerobic training versus no physical training, Outcome 25 Annual rate of change of ideal weight for height (%). | ||||
| 26 Change in triceps skinfold thickness (mm) Show forest plot | 1 | Mean Difference (IV, Fixed, 95% CI) | Totals not selected | |
| Analysis 1.26  Comparison 1 Aerobic training versus no physical training, Outcome 26 Change in triceps skinfold thickness (mm). | ||||
| 26.1 At 3 months | 1 | Mean Difference (IV, Fixed, 95% CI) | 0.0 [0.0, 0.0] | |
| 27 Change in arm muscle circumference (cm) Show forest plot | 1 | Mean Difference (IV, Fixed, 95% CI) | Totals not selected | |
| Analysis 1.27 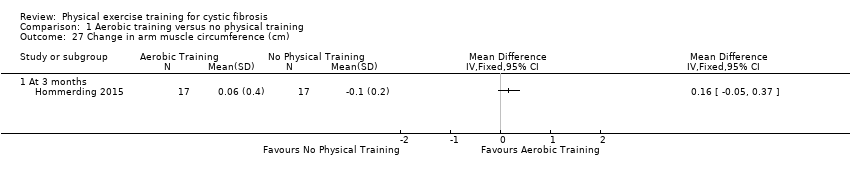 Comparison 1 Aerobic training versus no physical training, Outcome 27 Change in arm muscle circumference (cm). | ||||
| 27.1 At 3 months | 1 | Mean Difference (IV, Fixed, 95% CI) | 0.0 [0.0, 0.0] | |
| Outcome or subgroup title | No. of studies | No. of participants | Statistical method | Effect size |
| 1 Change in VO2 peak during maximal exercise (ml/min per kg BW) Show forest plot | 3 | Mean Difference (IV, Fixed, 95% CI) | Subtotals only | |
| Analysis 2.1  Comparison 2 Anaerobic training versus no physical training, Outcome 1 Change in VO2 peak during maximal exercise (ml/min per kg BW). | ||||
| 1.1 At hospital discharge | 1 | 44 | Mean Difference (IV, Fixed, 95% CI) | 1.95 [‐1.61, 5.51] |
| 1.2 At 1 month after discharge | 1 | 44 | Mean Difference (IV, Fixed, 95% CI) | ‐0.40 [‐4.03, 3.23] |
| 1.3 At 3 months | 2 | 41 | Mean Difference (IV, Fixed, 95% CI) | 5.54 [‐0.25, 11.34] |
| 1.4 At 6 months | 1 | 18 | Mean Difference (IV, Fixed, 95% CI) | 17.7 [5.98, 29.42] |
| 1.5 At 6 months off training | 1 | 16 | Mean Difference (IV, Fixed, 95% CI) | 11.59 [‐1.02, 24.20] |
| 1.6 At 18 months off training | 1 | 15 | Mean Difference (IV, Fixed, 95% CI) | 9.26 [‐4.26, 22.78] |
| 2 Change in FEV1 (% predicted) Show forest plot | 2 | Mean Difference (IV, Fixed, 95% CI) | Totals not selected | |
| Analysis 2.2  Comparison 2 Anaerobic training versus no physical training, Outcome 2 Change in FEV1 (% predicted). | ||||
| 2.1 At hospital discharge | 1 | Mean Difference (IV, Fixed, 95% CI) | 0.0 [0.0, 0.0] | |
| 2.2 At 1 month after discharge | 1 | Mean Difference (IV, Fixed, 95% CI) | 0.0 [0.0, 0.0] | |
| 2.3 At 3 months | 1 | Mean Difference (IV, Fixed, 95% CI) | 0.0 [0.0, 0.0] | |
| 2.4 At 6 months | 1 | Mean Difference (IV, Fixed, 95% CI) | 0.0 [0.0, 0.0] | |
| 2.5 At 6 months off training | 1 | Mean Difference (IV, Fixed, 95% CI) | 0.0 [0.0, 0.0] | |
| 2.6 At 18 months off training | 1 | Mean Difference (IV, Fixed, 95% CI) | 0.0 [0.0, 0.0] | |
| 3 Change in HRQoL Show forest plot | 1 | Mean Difference (IV, Fixed, 95% CI) | Totals not selected | |
| Analysis 2.3 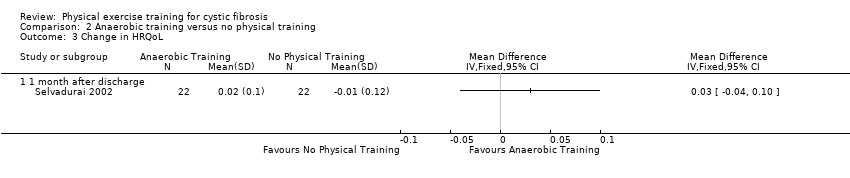 Comparison 2 Anaerobic training versus no physical training, Outcome 3 Change in HRQoL. | ||||
| 3.1 1 month after discharge | 1 | Mean Difference (IV, Fixed, 95% CI) | 0.0 [0.0, 0.0] | |
| 4 Change in HRQoL physical function (CF questionnaire) Show forest plot | 1 | Mean Difference (IV, Fixed, 95% CI) | Totals not selected | |
| Analysis 2.4  Comparison 2 Anaerobic training versus no physical training, Outcome 4 Change in HRQoL physical function (CF questionnaire). | ||||
| 4.1 At 3 months | 1 | Mean Difference (IV, Fixed, 95% CI) | 0.0 [0.0, 0.0] | |
| 5 Change in peak power during WAnT (W) Show forest plot | 1 | Mean Difference (IV, Fixed, 95% CI) | Totals not selected | |
| Analysis 2.5  Comparison 2 Anaerobic training versus no physical training, Outcome 5 Change in peak power during WAnT (W). | ||||
| 5.1 At 3 months | 1 | Mean Difference (IV, Fixed, 95% CI) | 0.0 [0.0, 0.0] | |
| 6 Change in mean power during WAnT (W) Show forest plot | 1 | Mean Difference (IV, Fixed, 95% CI) | Totals not selected | |
| Analysis 2.6 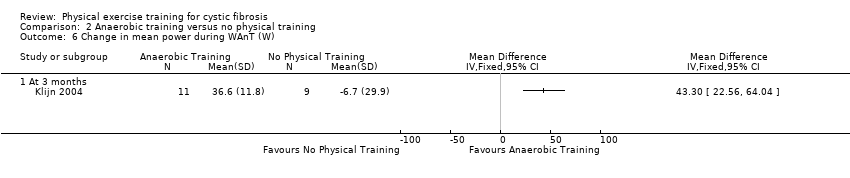 Comparison 2 Anaerobic training versus no physical training, Outcome 6 Change in mean power during WAnT (W). | ||||
| 6.1 At 3 months | 1 | Mean Difference (IV, Fixed, 95% CI) | 0.0 [0.0, 0.0] | |
| 7 Change in mean power during WAnT (W per kg BW) Show forest plot | 1 | Mean Difference (IV, Fixed, 95% CI) | Totals not selected | |
| Analysis 2.7 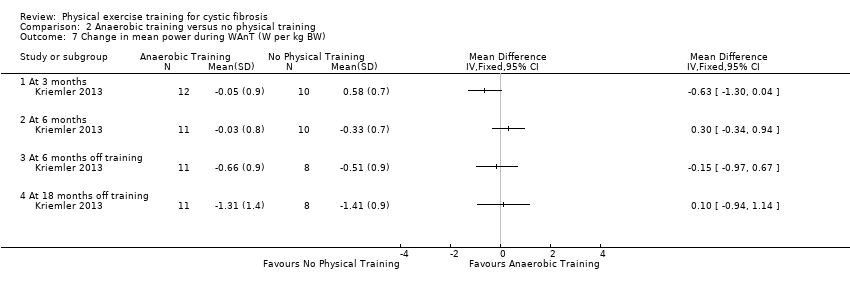 Comparison 2 Anaerobic training versus no physical training, Outcome 7 Change in mean power during WAnT (W per kg BW). | ||||
| 7.1 At 3 months | 1 | Mean Difference (IV, Fixed, 95% CI) | 0.0 [0.0, 0.0] | |
| 7.2 At 6 months | 1 | Mean Difference (IV, Fixed, 95% CI) | 0.0 [0.0, 0.0] | |
| 7.3 At 6 months off training | 1 | Mean Difference (IV, Fixed, 95% CI) | 0.0 [0.0, 0.0] | |
| 7.4 At 18 months off training | 1 | Mean Difference (IV, Fixed, 95% CI) | 0.0 [0.0, 0.0] | |
| 8 Change in lower limb strength (Newton metres) Show forest plot | 1 | Mean Difference (IV, Fixed, 95% CI) | Totals not selected | |
| Analysis 2.8  Comparison 2 Anaerobic training versus no physical training, Outcome 8 Change in lower limb strength (Newton metres). | ||||
| 8.1 At hospital discharge | 1 | Mean Difference (IV, Fixed, 95% CI) | 0.0 [0.0, 0.0] | |
| 8.2 At 1 month after discharge | 1 | Mean Difference (IV, Fixed, 95% CI) | 0.0 [0.0, 0.0] | |
| 9 Change in peak work capacity during maximal exercise (W) Show forest plot | 1 | Mean Difference (IV, Fixed, 95% CI) | Totals not selected | |
| Analysis 2.9  Comparison 2 Anaerobic training versus no physical training, Outcome 9 Change in peak work capacity during maximal exercise (W). | ||||
| 9.1 At 3 months | 1 | Mean Difference (IV, Fixed, 95% CI) | 0.0 [0.0, 0.0] | |
| 10 Change in peak work capacity during maximal exercise (W per kg body weight) Show forest plot | 1 | Mean Difference (IV, Fixed, 95% CI) | Totals not selected | |
| Analysis 2.10  Comparison 2 Anaerobic training versus no physical training, Outcome 10 Change in peak work capacity during maximal exercise (W per kg body weight). | ||||
| 10.1 At 3 months | 1 | Mean Difference (IV, Fixed, 95% CI) | 0.0 [0.0, 0.0] | |
| 10.2 At 6 months | 1 | Mean Difference (IV, Fixed, 95% CI) | 0.0 [0.0, 0.0] | |
| 10.3 At 6 months off training | 1 | Mean Difference (IV, Fixed, 95% CI) | 0.0 [0.0, 0.0] | |
| 10.4 At 18 months off training | 1 | Mean Difference (IV, Fixed, 95% CI) | 0.0 [0.0, 0.0] | |
| 11 Change in lactate during maximal exercise (mmol/L) Show forest plot | 1 | Mean Difference (IV, Fixed, 95% CI) | Totals not selected | |
| Analysis 2.11  Comparison 2 Anaerobic training versus no physical training, Outcome 11 Change in lactate during maximal exercise (mmol/L). | ||||
| 11.1 At 3 months | 1 | Mean Difference (IV, Fixed, 95% CI) | 0.0 [0.0, 0.0] | |
| 12 Change in peak oxygen saturation during maximal exercise (%) Show forest plot | 1 | Mean Difference (IV, Fixed, 95% CI) | Totals not selected | |
| Analysis 2.12  Comparison 2 Anaerobic training versus no physical training, Outcome 12 Change in peak oxygen saturation during maximal exercise (%). | ||||
| 12.1 At hospital discharge | 1 | Mean Difference (IV, Fixed, 95% CI) | 0.0 [0.0, 0.0] | |
| 13 Change in FVC (% predicted) Show forest plot | 2 | Mean Difference (IV, Fixed, 95% CI) | Totals not selected | |
| Analysis 2.13  Comparison 2 Anaerobic training versus no physical training, Outcome 13 Change in FVC (% predicted). | ||||
| 13.1 At hospital discharge | 1 | Mean Difference (IV, Fixed, 95% CI) | 0.0 [0.0, 0.0] | |
| 13.2 At 3 months | 1 | Mean Difference (IV, Fixed, 95% CI) | 0.0 [0.0, 0.0] | |
| 13.3 At 6 months | 1 | Mean Difference (IV, Fixed, 95% CI) | 0.0 [0.0, 0.0] | |
| 13.4 At 1 month after discharge | 1 | Mean Difference (IV, Fixed, 95% CI) | 0.0 [0.0, 0.0] | |
| 13.5 At 6 months off training | 1 | Mean Difference (IV, Fixed, 95% CI) | 0.0 [0.0, 0.0] | |
| 13.6 At 18 months off training | 1 | Mean Difference (IV, Fixed, 95% CI) | 0.0 [0.0, 0.0] | |
| 14 Change in RV/TLC (%) Show forest plot | 1 | Mean Difference (IV, Fixed, 95% CI) | Totals not selected | |
| Analysis 2.14  Comparison 2 Anaerobic training versus no physical training, Outcome 14 Change in RV/TLC (%). | ||||
| 14.1 At 3 months | 1 | Mean Difference (IV, Fixed, 95% CI) | 0.0 [0.0, 0.0] | |
| 14.2 At 6 months | 1 | Mean Difference (IV, Fixed, 95% CI) | 0.0 [0.0, 0.0] | |
| 14.3 At 6 months off training | 1 | Mean Difference (IV, Fixed, 95% CI) | 0.0 [0.0, 0.0] | |
| 14.4 At 18 months off training | 1 | Mean Difference (IV, Fixed, 95% CI) | 0.0 [0.0, 0.0] | |
| 15 Change in total physical activity (counts per min) Show forest plot | 1 | Mean Difference (IV, Fixed, 95% CI) | Totals not selected | |
| Analysis 2.15  Comparison 2 Anaerobic training versus no physical training, Outcome 15 Change in total physical activity (counts per min). | ||||
| 15.1 At 3 months | 1 | Mean Difference (IV, Fixed, 95% CI) | 0.0 [0.0, 0.0] | |
| 15.2 At 6 months | 1 | Mean Difference (IV, Fixed, 95% CI) | 0.0 [0.0, 0.0] | |
| 15.3 At 6 months off training | 1 | Mean Difference (IV, Fixed, 95% CI) | 0.0 [0.0, 0.0] | |
| 15.4 At 18 months off training | 1 | Mean Difference (IV, Fixed, 95% CI) | 0.0 [0.0, 0.0] | |
| 16 Change in moderate to vigorous physical activity (hours per week) Show forest plot | 1 | Mean Difference (IV, Fixed, 95% CI) | Totals not selected | |
| Analysis 2.16  Comparison 2 Anaerobic training versus no physical training, Outcome 16 Change in moderate to vigorous physical activity (hours per week). | ||||
| 16.1 At 3 months | 1 | Mean Difference (IV, Fixed, 95% CI) | 0.0 [0.0, 0.0] | |
| 16.2 At 6 months | 1 | Mean Difference (IV, Fixed, 95% CI) | 0.0 [0.0, 0.0] | |
| 16.3 At 6 months off training | 1 | Mean Difference (IV, Fixed, 95% CI) | 0.0 [0.0, 0.0] | |
| 16.4 At 18 months off training | 1 | Mean Difference (IV, Fixed, 95% CI) | 0.0 [0.0, 0.0] | |
| 17 Change in physical activity (MJ/day) Show forest plot | 1 | Mean Difference (IV, Fixed, 95% CI) | Totals not selected | |
| Analysis 2.17  Comparison 2 Anaerobic training versus no physical training, Outcome 17 Change in physical activity (MJ/day). | ||||
| 17.1 At hospital discharge | 1 | Mean Difference (IV, Fixed, 95% CI) | 0.0 [0.0, 0.0] | |
| 18 Change in weight (kg) Show forest plot | 1 | Mean Difference (IV, Fixed, 95% CI) | Totals not selected | |
| Analysis 2.18  Comparison 2 Anaerobic training versus no physical training, Outcome 18 Change in weight (kg). | ||||
| 18.1 At hospital discharge | 1 | Mean Difference (IV, Fixed, 95% CI) | 0.0 [0.0, 0.0] | |
| 18.2 At 1 month after discharge | 1 | Mean Difference (IV, Fixed, 95% CI) | 0.0 [0.0, 0.0] | |
| 19 Change in BMI (kg/m2) Show forest plot | 1 | Mean Difference (IV, Fixed, 95% CI) | Totals not selected | |
| Analysis 2.19 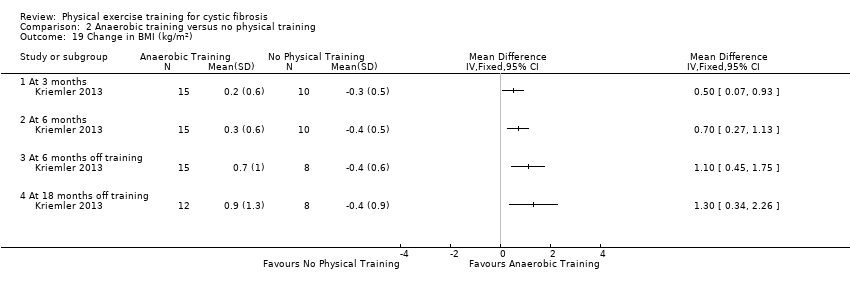 Comparison 2 Anaerobic training versus no physical training, Outcome 19 Change in BMI (kg/m2). | ||||
| 19.1 At 3 months | 1 | Mean Difference (IV, Fixed, 95% CI) | 0.0 [0.0, 0.0] | |
| 19.2 At 6 months | 1 | Mean Difference (IV, Fixed, 95% CI) | 0.0 [0.0, 0.0] | |
| 19.3 At 6 months off training | 1 | Mean Difference (IV, Fixed, 95% CI) | 0.0 [0.0, 0.0] | |
| 19.4 At 18 months off training | 1 | Mean Difference (IV, Fixed, 95% CI) | 0.0 [0.0, 0.0] | |
| 20 Change in fat‐free mass (kg) Show forest plot | 2 | Mean Difference (IV, Fixed, 95% CI) | Totals not selected | |
| Analysis 2.20  Comparison 2 Anaerobic training versus no physical training, Outcome 20 Change in fat‐free mass (kg). | ||||
| 20.1 At hospital discharge | 1 | Mean Difference (IV, Fixed, 95% CI) | 0.0 [0.0, 0.0] | |
| 20.2 At 3 months | 1 | Mean Difference (IV, Fixed, 95% CI) | 0.0 [0.0, 0.0] | |
| 20.3 At 6 months | 1 | Mean Difference (IV, Fixed, 95% CI) | 0.0 [0.0, 0.0] | |
| 20.4 At 1 month after discharge | 1 | Mean Difference (IV, Fixed, 95% CI) | 0.0 [0.0, 0.0] | |
| 20.5 At 6 months off training | 1 | Mean Difference (IV, Fixed, 95% CI) | 0.0 [0.0, 0.0] | |
| 20.6 At 18 months off training | 1 | Mean Difference (IV, Fixed, 95% CI) | 0.0 [0.0, 0.0] | |
| 21 Change in body fat (%) Show forest plot | 1 | Mean Difference (IV, Fixed, 95% CI) | Totals not selected | |
| Analysis 2.21  Comparison 2 Anaerobic training versus no physical training, Outcome 21 Change in body fat (%). | ||||
| 21.1 At 3 months | 1 | Mean Difference (IV, Fixed, 95% CI) | 0.0 [0.0, 0.0] | |
| 21.2 At 6 months | 1 | Mean Difference (IV, Fixed, 95% CI) | 0.0 [0.0, 0.0] | |
| 21.3 At 6 months off training | 1 | Mean Difference (IV, Fixed, 95% CI) | 0.0 [0.0, 0.0] | |
| 21.4 At 18 months off training | 1 | Mean Difference (IV, Fixed, 95% CI) | 0.0 [0.0, 0.0] | |
| Outcome or subgroup title | No. of studies | No. of participants | Statistical method | Effect size |
| 1 Change in VO2 peak during maximal exercise (ml/min per kg BW) Show forest plot | 2 | Mean Difference (Fixed, 95% CI) | Totals not selected | |
| Analysis 3.1  Comparison 3 Combined aerobic and anaerobic training versus no physical training, Outcome 1 Change in VO2 peak during maximal exercise (ml/min per kg BW). | ||||
| 1.1 At 12 weeks | 1 | Mean Difference (Fixed, 95% CI) | 0.0 [0.0, 0.0] | |
| 1.2 At 3 ‐ 6 months | 1 | Mean Difference (Fixed, 95% CI) | 0.0 [0.0, 0.0] | |
| 1.3 At 6 months off training | 1 | Mean Difference (Fixed, 95% CI) | 0.0 [0.0, 0.0] | |
| 1.4 At 12 ‐ 18 months off training | 1 | Mean Difference (Fixed, 95% CI) | 0.0 [0.0, 0.0] | |
| 2 Change in FEV1 (% predicted) Show forest plot | 3 | Mean Difference (IV, Fixed, 95% CI) | Totals not selected | |
| Analysis 3.2  Comparison 3 Combined aerobic and anaerobic training versus no physical training, Outcome 2 Change in FEV1 (% predicted). | ||||
| 2.1 At 12 weeks | 1 | Mean Difference (IV, Fixed, 95% CI) | 0.0 [0.0, 0.0] | |
| 2.2 At 3 months | 1 | Mean Difference (IV, Fixed, 95% CI) | 0.0 [0.0, 0.0] | |
| 2.3 At 3 ‐ 6 months | 1 | Mean Difference (IV, Fixed, 95% CI) | 0.0 [0.0, 0.0] | |
| 2.4 At 6 months off training | 1 | Mean Difference (IV, Fixed, 95% CI) | 0.0 [0.0, 0.0] | |
| 2.5 At 12 ‐ 18 months off training | 1 | Mean Difference (IV, Fixed, 95% CI) | 0.0 [0.0, 0.0] | |
| 3 Annual change in FEV1 (mL) Show forest plot | 1 | Mean Difference (Fixed, 95% CI) | Totals not selected | |
| Analysis 3.3  Comparison 3 Combined aerobic and anaerobic training versus no physical training, Outcome 3 Annual change in FEV1 (mL). | ||||
| 3.1 At 12 months | 1 | Mean Difference (Fixed, 95% CI) | 0.0 [0.0, 0.0] | |
| 4 Change in subjective health perception (CFQ‐R) Show forest plot | 1 | Mean Difference (Fixed, 95% CI) | Totals not selected | |
| Analysis 3.4 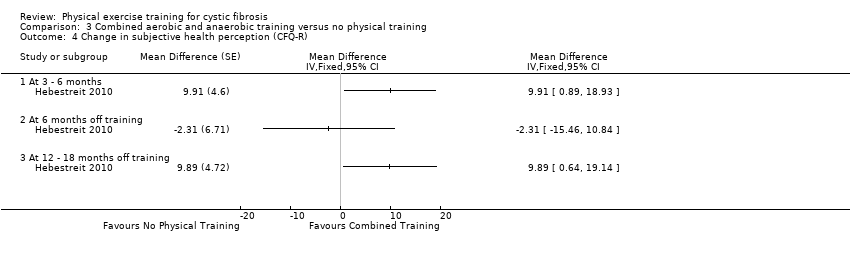 Comparison 3 Combined aerobic and anaerobic training versus no physical training, Outcome 4 Change in subjective health perception (CFQ‐R). | ||||
| 4.1 At 3 ‐ 6 months | 1 | Mean Difference (Fixed, 95% CI) | 0.0 [0.0, 0.0] | |
| 4.2 At 6 months off training | 1 | Mean Difference (Fixed, 95% CI) | 0.0 [0.0, 0.0] | |
| 4.3 At 12 ‐ 18 months off training | 1 | Mean Difference (Fixed, 95% CI) | 0.0 [0.0, 0.0] | |
| 5 Change in Quality of Life: CFQ‐R Show forest plot | 1 | Mean Difference (IV, Fixed, 95% CI) | Totals not selected | |
| Analysis 3.5  Comparison 3 Combined aerobic and anaerobic training versus no physical training, Outcome 5 Change in Quality of Life: CFQ‐R. | ||||
| 5.1 Physical Functioning at 12 weeks | 1 | Mean Difference (IV, Fixed, 95% CI) | 0.0 [0.0, 0.0] | |
| 5.2 Vitality at 12 weeks | 1 | Mean Difference (IV, Fixed, 95% CI) | 0.0 [0.0, 0.0] | |
| 5.3 Emotional state at 12 weeks | 1 | Mean Difference (IV, Fixed, 95% CI) | 0.0 [0.0, 0.0] | |
| 5.4 Eating disturbances at 12 weeks | 1 | Mean Difference (IV, Fixed, 95% CI) | 0.0 [0.0, 0.0] | |
| 5.5 Treatment burden at 12 weeks | 1 | Mean Difference (IV, Fixed, 95% CI) | 0.0 [0.0, 0.0] | |
| 5.6 Health perception at 12 weeks | 1 | Mean Difference (IV, Fixed, 95% CI) | 0.0 [0.0, 0.0] | |
| 5.7 Social limitations at 12 weeks | 1 | Mean Difference (IV, Fixed, 95% CI) | 0.0 [0.0, 0.0] | |
| 5.8 Body image at 12 weeks | 1 | Mean Difference (IV, Fixed, 95% CI) | 0.0 [0.0, 0.0] | |
| 5.9 Role limitations at 12 weeks | 1 | Mean Difference (IV, Fixed, 95% CI) | 0.0 [0.0, 0.0] | |
| 5.10 Weight problems at 12 weeks | 1 | Mean Difference (IV, Fixed, 95% CI) | 0.0 [0.0, 0.0] | |
| 5.11 Respiratory symptoms at 12 weeks | 1 | Mean Difference (IV, Fixed, 95% CI) | 0.0 [0.0, 0.0] | |
| 5.12 Digestion symptoms at 12 weeks | 1 | Mean Difference (IV, Fixed, 95% CI) | 0.0 [0.0, 0.0] | |
| 6 Change in peak power during WAnT (W per kg body weight) Show forest plot | 1 | Mean Difference (IV, Fixed, 95% CI) | Totals not selected | |
| Analysis 3.6  Comparison 3 Combined aerobic and anaerobic training versus no physical training, Outcome 6 Change in peak power during WAnT (W per kg body weight). | ||||
| 6.1 At 3 ‐ 6 months | 1 | Mean Difference (IV, Fixed, 95% CI) | 0.0 [0.0, 0.0] | |
| 6.2 At 6 months off training | 1 | Mean Difference (IV, Fixed, 95% CI) | 0.0 [0.0, 0.0] | |
| 6.3 At 12 ‐ 18 months off training | 1 | Mean Difference (IV, Fixed, 95% CI) | 0.0 [0.0, 0.0] | |
| 7 Change in mean power during WAnT (W per kg body weight) Show forest plot | 1 | Mean Difference (IV, Fixed, 95% CI) | Totals not selected | |
| Analysis 3.7  Comparison 3 Combined aerobic and anaerobic training versus no physical training, Outcome 7 Change in mean power during WAnT (W per kg body weight). | ||||
| 7.1 At 3 ‐ 6 months | 1 | Mean Difference (IV, Fixed, 95% CI) | 0.0 [0.0, 0.0] | |
| 7.2 At 6 months off training | 1 | Mean Difference (IV, Fixed, 95% CI) | 0.0 [0.0, 0.0] | |
| 7.3 At 12 ‐ 18 months off training | 1 | Mean Difference (IV, Fixed, 95% CI) | 0.0 [0.0, 0.0] | |
| 8 Change in muscle strength (all limbs) (1RM test) Show forest plot | 1 | Mean Difference (IV, Fixed, 95% CI) | Totals not selected | |
| Analysis 3.8  Comparison 3 Combined aerobic and anaerobic training versus no physical training, Outcome 8 Change in muscle strength (all limbs) (1RM test). | ||||
| 8.1 Right upper limb at 3 months | 1 | Mean Difference (IV, Fixed, 95% CI) | 0.0 [0.0, 0.0] | |
| 8.2 Left upper limb at 3 months | 1 | Mean Difference (IV, Fixed, 95% CI) | 0.0 [0.0, 0.0] | |
| 8.3 Right lower limb at 3 months | 1 | Mean Difference (IV, Fixed, 95% CI) | 0.0 [0.0, 0.0] | |
| 8.4 Left lower limb at 3 months | 1 | Mean Difference (IV, Fixed, 95% CI) | 0.0 [0.0, 0.0] | |
| 9 Change in muscular strength ‐ leg press (kg; 1 RM test) Show forest plot | 1 | Mean Difference (IV, Fixed, 95% CI) | Totals not selected | |
| Analysis 3.9  Comparison 3 Combined aerobic and anaerobic training versus no physical training, Outcome 9 Change in muscular strength ‐ leg press (kg; 1 RM test). | ||||
| 9.1 At 12 weeks | 1 | Mean Difference (IV, Fixed, 95% CI) | 0.0 [0.0, 0.0] | |
| 10 Change in Muscular Strength ‐ Chest press (kg; 1 RM test) Show forest plot | 1 | Mean Difference (IV, Fixed, 95% CI) | Totals not selected | |
| Analysis 3.10 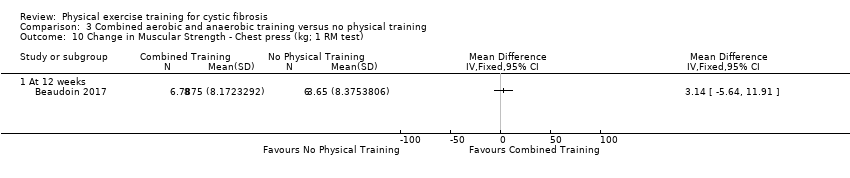 Comparison 3 Combined aerobic and anaerobic training versus no physical training, Outcome 10 Change in Muscular Strength ‐ Chest press (kg; 1 RM test). | ||||
| 10.1 At 12 weeks | 1 | Mean Difference (IV, Fixed, 95% CI) | 0.0 [0.0, 0.0] | |
| 11 Change in Muscular Strength ‐ Latpull down (kg; 1 RM test) Show forest plot | 1 | Mean Difference (IV, Fixed, 95% CI) | Totals not selected | |
| Analysis 3.11  Comparison 3 Combined aerobic and anaerobic training versus no physical training, Outcome 11 Change in Muscular Strength ‐ Latpull down (kg; 1 RM test). | ||||
| 11.1 At 12 weeks | 1 | Mean Difference (IV, Fixed, 95% CI) | 0.0 [0.0, 0.0] | |
| 12 Change in Muscular Strength ‐ Biceps curl (kg; RM test) Show forest plot | 1 | Mean Difference (IV, Fixed, 95% CI) | Totals not selected | |
| Analysis 3.12  Comparison 3 Combined aerobic and anaerobic training versus no physical training, Outcome 12 Change in Muscular Strength ‐ Biceps curl (kg; RM test). | ||||
| 12.1 At 12 weeks | 1 | Mean Difference (IV, Fixed, 95% CI) | 0.0 [0.0, 0.0] | |
| 13 Change in Muscular Endurance ‐ Number of push ups Show forest plot | 1 | Mean Difference (IV, Fixed, 95% CI) | Totals not selected | |
| Analysis 3.13  Comparison 3 Combined aerobic and anaerobic training versus no physical training, Outcome 13 Change in Muscular Endurance ‐ Number of push ups. | ||||
| 13.1 At 12 weeks | 1 | Mean Difference (IV, Fixed, 95% CI) | 0.0 [0.0, 0.0] | |
| 14 Change in Muscular Endurance ‐ Number of sit ups Show forest plot | 1 | Mean Difference (IV, Fixed, 95% CI) | Totals not selected | |
| Analysis 3.14  Comparison 3 Combined aerobic and anaerobic training versus no physical training, Outcome 14 Change in Muscular Endurance ‐ Number of sit ups. | ||||
| 14.1 At 12 weeks | 1 | Mean Difference (IV, Fixed, 95% CI) | 0.0 [0.0, 0.0] | |
| 15 Change in Muscular Endurance ‐ Flexibility (cm) Show forest plot | 1 | Mean Difference (IV, Fixed, 95% CI) | Totals not selected | |
| Analysis 3.15  Comparison 3 Combined aerobic and anaerobic training versus no physical training, Outcome 15 Change in Muscular Endurance ‐ Flexibility (cm). | ||||
| 15.1 At 12 weeks | 1 | Mean Difference (IV, Fixed, 95% CI) | 0.0 [0.0, 0.0] | |
| 16 Change in Muscular Endurance ‐ hand grip strength (kg) Show forest plot | 1 | Mean Difference (IV, Fixed, 95% CI) | Totals not selected | |
| Analysis 3.16  Comparison 3 Combined aerobic and anaerobic training versus no physical training, Outcome 16 Change in Muscular Endurance ‐ hand grip strength (kg). | ||||
| 16.1 At 12 weeks | 1 | Mean Difference (IV, Fixed, 95% CI) | 0.0 [0.0, 0.0] | |
| 17 Change in peak work capacity during maximal exercise (W per kg BW) Show forest plot | 1 | Mean Difference (Fixed, 95% CI) | Totals not selected | |
| Analysis 3.17  Comparison 3 Combined aerobic and anaerobic training versus no physical training, Outcome 17 Change in peak work capacity during maximal exercise (W per kg BW). | ||||
| 17.1 At 3 ‐ 6 months | 1 | Mean Difference (Fixed, 95% CI) | 0.0 [0.0, 0.0] | |
| 17.2 At 6 months off training | 1 | Mean Difference (Fixed, 95% CI) | 0.0 [0.0, 0.0] | |
| 17.3 At 12 ‐ 18 months off training | 1 | Mean Difference (Fixed, 95% CI) | 0.0 [0.0, 0.0] | |
| 18 Change in functional exercise capacity Show forest plot | 1 | Mean Difference (IV, Fixed, 95% CI) | Totals not selected | |
| Analysis 3.18  Comparison 3 Combined aerobic and anaerobic training versus no physical training, Outcome 18 Change in functional exercise capacity. | ||||
| 18.1 6MWT distance (m) at 3 months | 1 | Mean Difference (IV, Fixed, 95% CI) | 0.0 [0.0, 0.0] | |
| 18.2 6MWT distance (% predicted) at 3 months | 1 | Mean Difference (IV, Fixed, 95% CI) | 0.0 [0.0, 0.0] | |
| 19 Change in peak heart rate during 6MWT (beats/min) Show forest plot | 1 | Mean Difference (IV, Fixed, 95% CI) | Totals not selected | |
| Analysis 3.19 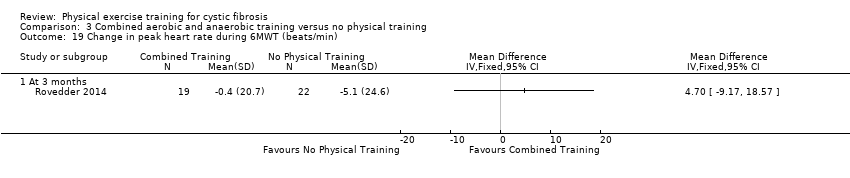 Comparison 3 Combined aerobic and anaerobic training versus no physical training, Outcome 19 Change in peak heart rate during 6MWT (beats/min). | ||||
| 19.1 At 3 months | 1 | Mean Difference (IV, Fixed, 95% CI) | 0.0 [0.0, 0.0] | |
| 20 Annual change in peak heart rate (beat/min) Show forest plot | 1 | Mean Difference (Fixed, 95% CI) | Totals not selected | |
| Analysis 3.20  Comparison 3 Combined aerobic and anaerobic training versus no physical training, Outcome 20 Annual change in peak heart rate (beat/min). | ||||
| 20.1 Constant load bicycle ergometry (at 1 year) | 1 | Mean Difference (Fixed, 95% CI) | 0.0 [0.0, 0.0] | |
| 20.2 Constant load arm ergometry (at 1 year) | 1 | Mean Difference (Fixed, 95% CI) | 0.0 [0.0, 0.0] | |
| 21 Annual change in VE (L/min) Show forest plot | 1 | Mean Difference (Fixed, 95% CI) | Totals not selected | |
| Analysis 3.21 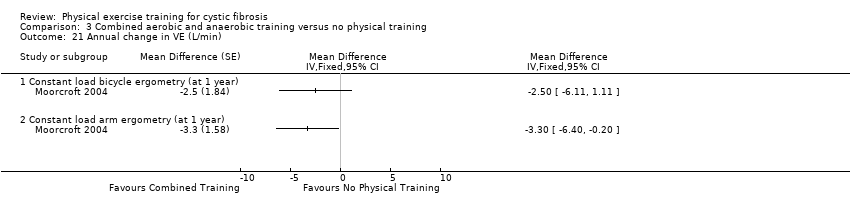 Comparison 3 Combined aerobic and anaerobic training versus no physical training, Outcome 21 Annual change in VE (L/min). | ||||
| 21.1 Constant load bicycle ergometry (at 1 year) | 1 | Mean Difference (Fixed, 95% CI) | 0.0 [0.0, 0.0] | |
| 21.2 Constant load arm ergometry (at 1 year) | 1 | Mean Difference (Fixed, 95% CI) | 0.0 [0.0, 0.0] | |
| 22 Change in peak ventilation (VE) during maximal exercise Show forest plot | 1 | Mean Difference (IV, Fixed, 95% CI) | Totals not selected | |
| Analysis 3.22  Comparison 3 Combined aerobic and anaerobic training versus no physical training, Outcome 22 Change in peak ventilation (VE) during maximal exercise. | ||||
| 22.1 At 12 weeks | 1 | Mean Difference (IV, Fixed, 95% CI) | 0.0 [0.0, 0.0] | |
| 23 Annual change in lactate (mmol/l) Show forest plot | 1 | Mean Difference (Fixed, 95% CI) | Totals not selected | |
| Analysis 3.23  Comparison 3 Combined aerobic and anaerobic training versus no physical training, Outcome 23 Annual change in lactate (mmol/l). | ||||
| 23.1 Constant load bicycle ergometry (at 1 year) | 1 | Mean Difference (Fixed, 95% CI) | 0.0 [0.0, 0.0] | |
| 23.2 Constant load arm ergometry (at 1 year) | 1 | Mean Difference (Fixed, 95% CI) | 0.0 [0.0, 0.0] | |
| 24 Change in RR during 6MWT (breaths/min) Show forest plot | 1 | Mean Difference (IV, Fixed, 95% CI) | Totals not selected | |
| Analysis 3.24  Comparison 3 Combined aerobic and anaerobic training versus no physical training, Outcome 24 Change in RR during 6MWT (breaths/min). | ||||
| 24.1 At 3 months | 1 | Mean Difference (IV, Fixed, 95% CI) | 0.0 [0.0, 0.0] | |
| 25 Annual change in RR (breaths/min) Show forest plot | 1 | Mean Difference (Fixed, 95% CI) | Totals not selected | |
| Analysis 3.25  Comparison 3 Combined aerobic and anaerobic training versus no physical training, Outcome 25 Annual change in RR (breaths/min). | ||||
| 25.1 Constant load bicycle ergometry (at 1 year) | 1 | Mean Difference (Fixed, 95% CI) | 0.0 [0.0, 0.0] | |
| 25.2 Constant load arm ergometry (at 1 year) | 1 | Mean Difference (Fixed, 95% CI) | 0.0 [0.0, 0.0] | |
| 26 Annual change in RER Show forest plot | 1 | Mean Difference (Fixed, 95% CI) | Totals not selected | |
| Analysis 3.26  Comparison 3 Combined aerobic and anaerobic training versus no physical training, Outcome 26 Annual change in RER. | ||||
| 26.1 Constant load bicycle ergometry (at 1 year) | 1 | Mean Difference (Fixed, 95% CI) | 0.0 [0.0, 0.0] | |
| 26.2 Constant load arm ergometry (at 1 year) | 1 | Mean Difference (Fixed, 95% CI) | 0.0 [0.0, 0.0] | |
| 27 Change in oxygen saturation (%) Show forest plot | 1 | Mean Difference (IV, Fixed, 95% CI) | Totals not selected | |
| Analysis 3.27 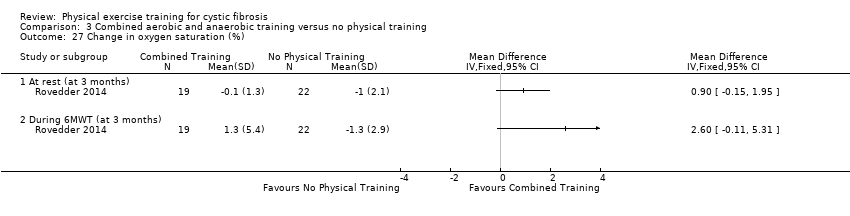 Comparison 3 Combined aerobic and anaerobic training versus no physical training, Outcome 27 Change in oxygen saturation (%). | ||||
| 27.1 At rest (at 3 months) | 1 | Mean Difference (IV, Fixed, 95% CI) | 0.0 [0.0, 0.0] | |
| 27.2 During 6MWT (at 3 months) | 1 | Mean Difference (IV, Fixed, 95% CI) | 0.0 [0.0, 0.0] | |
| 28 Change in Borg breathlessness score Show forest plot | 1 | Mean Difference (IV, Fixed, 95% CI) | Totals not selected | |
| Analysis 3.28  Comparison 3 Combined aerobic and anaerobic training versus no physical training, Outcome 28 Change in Borg breathlessness score. | ||||
| 28.1 At rest (at 3 months) | 1 | Mean Difference (IV, Fixed, 95% CI) | 0.0 [0.0, 0.0] | |
| 28.2 During 6MWT (at 3 months) | 1 | Mean Difference (IV, Fixed, 95% CI) | 0.0 [0.0, 0.0] | |
| 29 Annual change in Borg breathlessness score Show forest plot | 1 | Mean Difference (Fixed, 95% CI) | Totals not selected | |
| Analysis 3.29  Comparison 3 Combined aerobic and anaerobic training versus no physical training, Outcome 29 Annual change in Borg breathlessness score. | ||||
| 29.1 Constant load bicycle ergometry (at 1 year) | 1 | Mean Difference (Fixed, 95% CI) | 0.0 [0.0, 0.0] | |
| 29.2 Constant load arm ergometry (at 1 year) | 1 | Mean Difference (Fixed, 95% CI) | 0.0 [0.0, 0.0] | |
| 30 Change in Borg fatigue score Show forest plot | 1 | Mean Difference (IV, Fixed, 95% CI) | Totals not selected | |
| Analysis 3.30 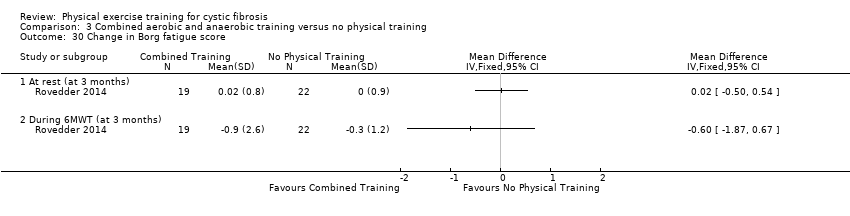 Comparison 3 Combined aerobic and anaerobic training versus no physical training, Outcome 30 Change in Borg fatigue score. | ||||
| 30.1 At rest (at 3 months) | 1 | Mean Difference (IV, Fixed, 95% CI) | 0.0 [0.0, 0.0] | |
| 30.2 During 6MWT (at 3 months) | 1 | Mean Difference (IV, Fixed, 95% CI) | 0.0 [0.0, 0.0] | |
| 31 Annual change in Borg muscle effort Show forest plot | 1 | Mean Difference (Fixed, 95% CI) | Totals not selected | |
| Analysis 3.31  Comparison 3 Combined aerobic and anaerobic training versus no physical training, Outcome 31 Annual change in Borg muscle effort. | ||||
| 31.1 Constant load bicycle ergometry (at 1 year) | 1 | Mean Difference (Fixed, 95% CI) | 0.0 [0.0, 0.0] | |
| 31.2 Constant load arm ergometry (at 1 year) | 1 | Mean Difference (Fixed, 95% CI) | 0.0 [0.0, 0.0] | |
| 32 Change in FVC (% predicted) Show forest plot | 3 | Mean Difference (Fixed, 95% CI) | Totals not selected | |
| Analysis 3.32  Comparison 3 Combined aerobic and anaerobic training versus no physical training, Outcome 32 Change in FVC (% predicted). | ||||
| 32.1 At 12 weeks | 1 | Mean Difference (Fixed, 95% CI) | 0.0 [0.0, 0.0] | |
| 32.2 At 3 months | 1 | Mean Difference (Fixed, 95% CI) | 0.0 [0.0, 0.0] | |
| 32.3 At 3 ‐ 6 months | 1 | Mean Difference (Fixed, 95% CI) | 0.0 [0.0, 0.0] | |
| 32.4 At 6 months off training | 1 | Mean Difference (Fixed, 95% CI) | 0.0 [0.0, 0.0] | |
| 32.5 At 12 ‐ 18 months off training | 1 | Mean Difference (Fixed, 95% CI) | 0.0 [0.0, 0.0] | |
| 33 Annual change in FVC (mL) Show forest plot | 1 | Mean Difference (Fixed, 95% CI) | Totals not selected | |
| Analysis 3.33  Comparison 3 Combined aerobic and anaerobic training versus no physical training, Outcome 33 Annual change in FVC (mL). | ||||
| 33.1 At 1 year | 1 | Mean Difference (Fixed, 95% CI) | 0.0 [0.0, 0.0] | |
| 34 Change in RV/TLC (%) Show forest plot | 1 | Mean Difference (IV, Fixed, 95% CI) | Totals not selected | |
| Analysis 3.34  Comparison 3 Combined aerobic and anaerobic training versus no physical training, Outcome 34 Change in RV/TLC (%). | ||||
| 34.1 At 3 ‐ 6 months | 1 | Mean Difference (IV, Fixed, 95% CI) | 0.0 [0.0, 0.0] | |
| 34.2 At 6 months off training | 1 | Mean Difference (IV, Fixed, 95% CI) | 0.0 [0.0, 0.0] | |
| 34.3 At 12 ‐ 18 months off training | 1 | Mean Difference (IV, Fixed, 95% CI) | 0.0 [0.0, 0.0] | |
| 35 Change in Total Energy Expenditure (k/cal) Show forest plot | 1 | Mean Difference (IV, Fixed, 95% CI) | Totals not selected | |
| Analysis 3.35  Comparison 3 Combined aerobic and anaerobic training versus no physical training, Outcome 35 Change in Total Energy Expenditure (k/cal). | ||||
| 35.1 At 12 weeks | 1 | Mean Difference (IV, Fixed, 95% CI) | 0.0 [0.0, 0.0] | |
| 36 Change in the Number of Steps Show forest plot | 1 | Mean Difference (IV, Fixed, 95% CI) | Totals not selected | |
| Analysis 3.36  Comparison 3 Combined aerobic and anaerobic training versus no physical training, Outcome 36 Change in the Number of Steps. | ||||
| 36.1 At 12 weeks | 1 | Mean Difference (IV, Fixed, 95% CI) | 0.0 [0.0, 0.0] | |
| 37 Change in Physical Activity (%) Show forest plot | 1 | Mean Difference (IV, Fixed, 95% CI) | Totals not selected | |
| Analysis 3.37  Comparison 3 Combined aerobic and anaerobic training versus no physical training, Outcome 37 Change in Physical Activity (%). | ||||
| 37.1 At 12 weeks | 1 | Mean Difference (IV, Fixed, 95% CI) | 0.0 [0.0, 0.0] | |
| 38 Change in vigorous physical activity (hours per week) Show forest plot | 1 | Mean Difference (Fixed, 95% CI) | Totals not selected | |
| Analysis 3.38  Comparison 3 Combined aerobic and anaerobic training versus no physical training, Outcome 38 Change in vigorous physical activity (hours per week). | ||||
| 38.1 At 3 ‐ 6 months | 1 | Mean Difference (Fixed, 95% CI) | 0.0 [0.0, 0.0] | |
| 38.2 At 6 months off training | 1 | Mean Difference (Fixed, 95% CI) | 0.0 [0.0, 0.0] | |
| 38.3 At 12 ‐ 18 months off training | 1 | Mean Difference (Fixed, 95% CI) | 0.0 [0.0, 0.0] | |
| 39 Change in body weight (kg) Show forest plot | 2 | Mean Difference (IV, Fixed, 95% CI) | Totals not selected | |
| Analysis 3.39  Comparison 3 Combined aerobic and anaerobic training versus no physical training, Outcome 39 Change in body weight (kg). | ||||
| 39.1 At 12 weeks | 1 | Mean Difference (IV, Fixed, 95% CI) | 0.0 [0.0, 0.0] | |
| 39.2 At 3 ‐ 6 months | 1 | Mean Difference (IV, Fixed, 95% CI) | 0.0 [0.0, 0.0] | |
| 39.3 At 6 months off training | 1 | Mean Difference (IV, Fixed, 95% CI) | 0.0 [0.0, 0.0] | |
| 39.4 At 12 ‐ 18 months off training | 1 | Mean Difference (IV, Fixed, 95% CI) | 0.0 [0.0, 0.0] | |
| 40 Change in BMI (kg/m2) Show forest plot | 3 | Mean Difference (Fixed, 95% CI) | Totals not selected | |
| Analysis 3.40  Comparison 3 Combined aerobic and anaerobic training versus no physical training, Outcome 40 Change in BMI (kg/m2). | ||||
| 40.1 At 12 weeks | 1 | Mean Difference (Fixed, 95% CI) | 0.0 [0.0, 0.0] | |
| 40.2 At 3 ‐ 6 months | 1 | Mean Difference (Fixed, 95% CI) | 0.0 [0.0, 0.0] | |
| 40.3 Annual change | 1 | Mean Difference (Fixed, 95% CI) | 0.0 [0.0, 0.0] | |
| 40.4 At 6 months off training | 1 | Mean Difference (Fixed, 95% CI) | 0.0 [0.0, 0.0] | |
| 40.5 At 12 ‐ 18 months off training | 1 | Mean Difference (Fixed, 95% CI) | 0.0 [0.0, 0.0] | |
| 41 Change in sum of four skinfolds (mm) Show forest plot | 1 | Mean Difference (Fixed, 95% CI) | Totals not selected | |
| Analysis 3.41 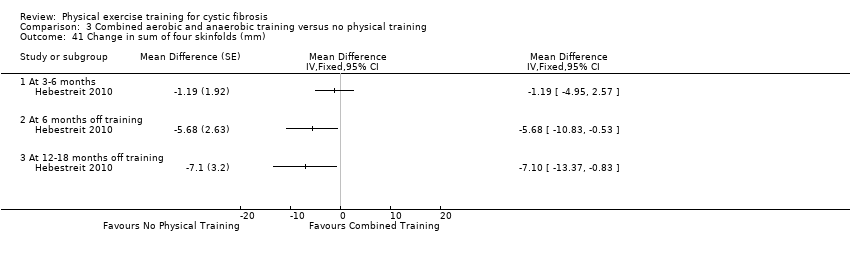 Comparison 3 Combined aerobic and anaerobic training versus no physical training, Outcome 41 Change in sum of four skinfolds (mm). | ||||
| 41.1 At 3‐6 months | 1 | Mean Difference (Fixed, 95% CI) | 0.0 [0.0, 0.0] | |
| 41.2 At 6 months off training | 1 | Mean Difference (Fixed, 95% CI) | 0.0 [0.0, 0.0] | |
| 41.3 At 12‐18 months off training | 1 | Mean Difference (Fixed, 95% CI) | 0.0 [0.0, 0.0] | |
| 42 Change in body fat (%) Show forest plot | 2 | Mean Difference (Fixed, 95% CI) | Totals not selected | |
| Analysis 3.42  Comparison 3 Combined aerobic and anaerobic training versus no physical training, Outcome 42 Change in body fat (%). | ||||
| 42.1 At 12 weeks | 1 | Mean Difference (Fixed, 95% CI) | 0.0 [0.0, 0.0] | |
| 42.2 At 3 ‐ 6 months | 1 | Mean Difference (Fixed, 95% CI) | 0.0 [0.0, 0.0] | |
| 42.3 At 6 months off training | 1 | Mean Difference (Fixed, 95% CI) | 0.0 [0.0, 0.0] | |
| 42.4 At 12 ‐ 18 months off training | 1 | Mean Difference (Fixed, 95% CI) | 0.0 [0.0, 0.0] | |
| 43 Change in fat‐mass (kg) Show forest plot | 1 | Mean Difference (IV, Fixed, 95% CI) | Totals not selected | |
| Analysis 3.43  Comparison 3 Combined aerobic and anaerobic training versus no physical training, Outcome 43 Change in fat‐mass (kg). | ||||
| 43.1 At 12 weeks | 1 | Mean Difference (IV, Fixed, 95% CI) | 0.0 [0.0, 0.0] | |
| 44 Change in fat‐free mass (kg) Show forest plot | 2 | Mean Difference (IV, Fixed, 95% CI) | Totals not selected | |
| Analysis 3.44  Comparison 3 Combined aerobic and anaerobic training versus no physical training, Outcome 44 Change in fat‐free mass (kg). | ||||
| 44.1 At 12 weeks | 1 | Mean Difference (IV, Fixed, 95% CI) | 0.0 [0.0, 0.0] | |
| 44.2 At 3 ‐ 6 months | 1 | Mean Difference (IV, Fixed, 95% CI) | 0.0 [0.0, 0.0] | |
| 44.3 At 6 months off training | 1 | Mean Difference (IV, Fixed, 95% CI) | 0.0 [0.0, 0.0] | |
| 44.4 At 12 ‐ 18 months off training | 1 | Mean Difference (IV, Fixed, 95% CI) | 0.0 [0.0, 0.0] | |
| 45 Change in metabolic parameters (HbA1c (%)) Show forest plot | 1 | Mean Difference (IV, Fixed, 95% CI) | Totals not selected | |
| Analysis 3.45  Comparison 3 Combined aerobic and anaerobic training versus no physical training, Outcome 45 Change in metabolic parameters (HbA1c (%)). | ||||
| 45.1 At 12 weeks | 1 | Mean Difference (IV, Fixed, 95% CI) | 0.0 [0.0, 0.0] | |
| 46 Change in metabolic parameters (Glucose AUC) Show forest plot | 1 | Mean Difference (IV, Fixed, 95% CI) | Totals not selected | |
| Analysis 3.46  Comparison 3 Combined aerobic and anaerobic training versus no physical training, Outcome 46 Change in metabolic parameters (Glucose AUC). | ||||
| 46.1 At 12 weeks | 1 | Mean Difference (IV, Fixed, 95% CI) | 0.0 [0.0, 0.0] | |
| 47 Change in metabolic parameters (Total Insulin AUC) Show forest plot | 1 | Mean Difference (IV, Fixed, 95% CI) | Totals not selected | |
| Analysis 3.47 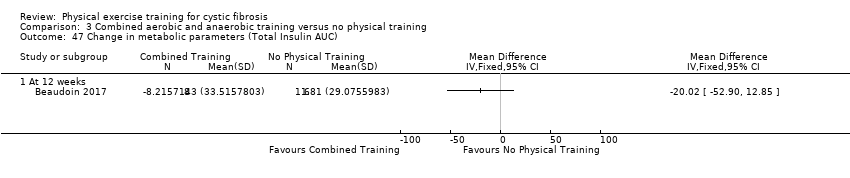 Comparison 3 Combined aerobic and anaerobic training versus no physical training, Outcome 47 Change in metabolic parameters (Total Insulin AUC). | ||||
| 47.1 At 12 weeks | 1 | Mean Difference (IV, Fixed, 95% CI) | 0.0 [0.0, 0.0] | |
| 48 Change in metabolic parameters (Insulin Sensitivity Index) Show forest plot | 1 | Mean Difference (IV, Fixed, 95% CI) | Totals not selected | |
| Analysis 3.48  Comparison 3 Combined aerobic and anaerobic training versus no physical training, Outcome 48 Change in metabolic parameters (Insulin Sensitivity Index). | ||||
| 48.1 At 12 weeks | 1 | Mean Difference (IV, Fixed, 95% CI) | 0.0 [0.0, 0.0] | |
| 49 Change in Plasma Glucose (mmol/L) Show forest plot | 1 | Mean Difference (IV, Fixed, 95% CI) | Totals not selected | |
| Analysis 3.49 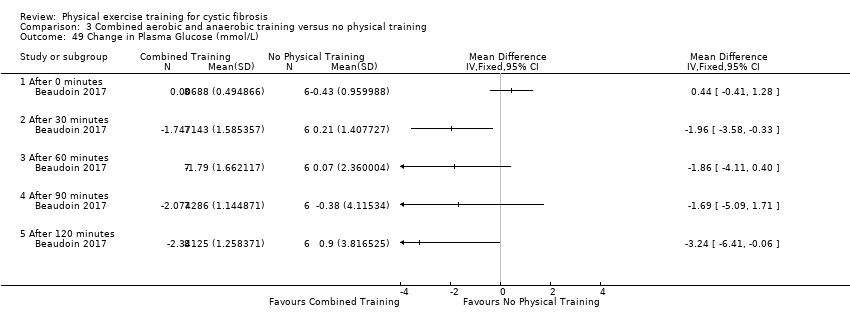 Comparison 3 Combined aerobic and anaerobic training versus no physical training, Outcome 49 Change in Plasma Glucose (mmol/L). | ||||
| 49.1 After 0 minutes | 1 | Mean Difference (IV, Fixed, 95% CI) | 0.0 [0.0, 0.0] | |
| 49.2 After 30 minutes | 1 | Mean Difference (IV, Fixed, 95% CI) | 0.0 [0.0, 0.0] | |
| 49.3 After 60 minutes | 1 | Mean Difference (IV, Fixed, 95% CI) | 0.0 [0.0, 0.0] | |
| 49.4 After 90 minutes | 1 | Mean Difference (IV, Fixed, 95% CI) | 0.0 [0.0, 0.0] | |
| 49.5 After 120 minutes | 1 | Mean Difference (IV, Fixed, 95% CI) | 0.0 [0.0, 0.0] | |
| 50 Change in Plasma Insulin (µU/mL) Show forest plot | 1 | Mean Difference (IV, Fixed, 95% CI) | Totals not selected | |
| Analysis 3.50  Comparison 3 Combined aerobic and anaerobic training versus no physical training, Outcome 50 Change in Plasma Insulin (µU/mL). | ||||
| 50.1 After 0 minutes | 1 | Mean Difference (IV, Fixed, 95% CI) | 0.0 [0.0, 0.0] | |
| 50.2 After 30 minutes | 1 | Mean Difference (IV, Fixed, 95% CI) | 0.0 [0.0, 0.0] | |
| 50.3 After 60 minutes | 1 | Mean Difference (IV, Fixed, 95% CI) | 0.0 [0.0, 0.0] | |
| 50.4 After 90 minutes | 1 | Mean Difference (IV, Fixed, 95% CI) | 0.0 [0.0, 0.0] | |
| 50.5 After 120 minutes | 1 | Mean Difference (IV, Fixed, 95% CI) | 0.0 [0.0, 0.0] | |
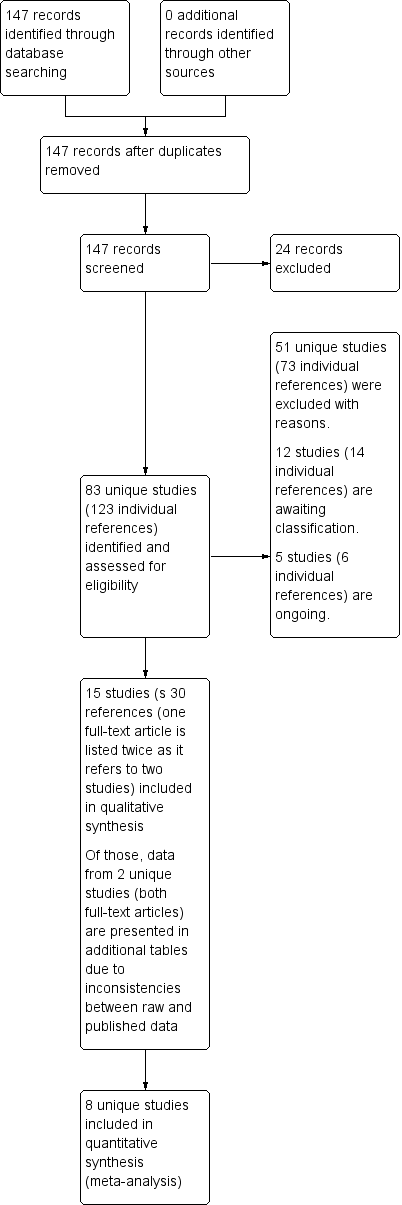
Study flow diagram.
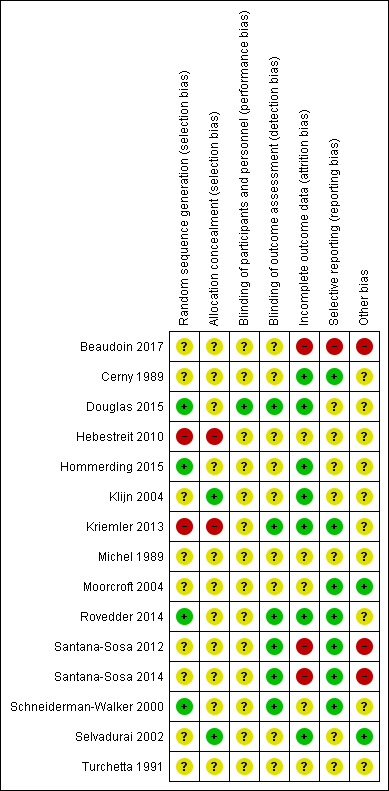
Methodological quality summary: review authors' judgments about each methodological quality item for each included study.

Methodological quality graph: review authors' judgments about each methodological quality item presented as percentages across all included studies.

Comparison 1 Aerobic training versus no physical training, Outcome 1 Change in VO2 peak during maximal exercise (ml/min per kg BW).

Comparison 1 Aerobic training versus no physical training, Outcome 2 Change in FEV1(% predicted).

Comparison 1 Aerobic training versus no physical training, Outcome 3 Change in health‐related quality of life.

Comparison 1 Aerobic training versus no physical training, Outcome 4 Change in mean power during WAnT (W per kg BW).

Comparison 1 Aerobic training versus no physical training, Outcome 5 Change in strength (Newton metres).
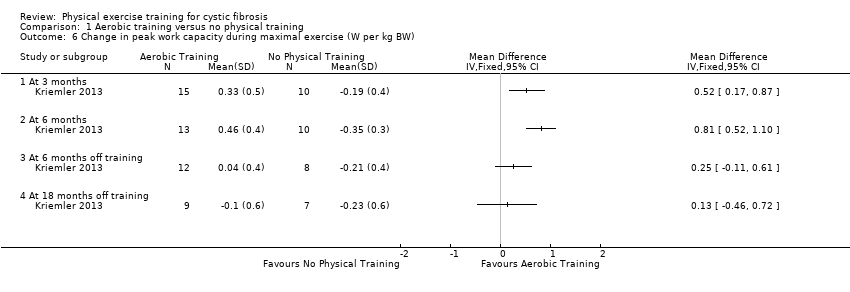
Comparison 1 Aerobic training versus no physical training, Outcome 6 Change in peak work capacity during maximal exercise (W per kg BW).
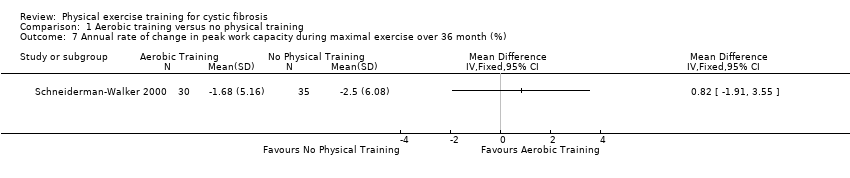
Comparison 1 Aerobic training versus no physical training, Outcome 7 Annual rate of change in peak work capacity during maximal exercise over 36 month (%).

Comparison 1 Aerobic training versus no physical training, Outcome 8 Change in treadmill speed (km/h).
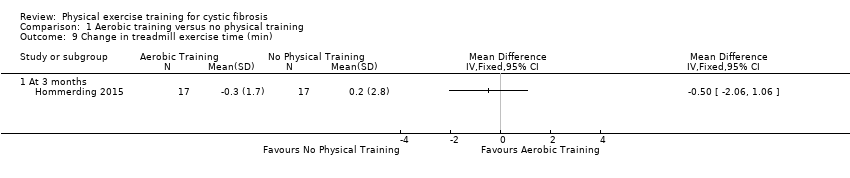
Comparison 1 Aerobic training versus no physical training, Outcome 9 Change in treadmill exercise time (min).

Comparison 1 Aerobic training versus no physical training, Outcome 10 Change in heart rate (beats per min).

Comparison 1 Aerobic training versus no physical training, Outcome 11 Change in oxygen saturation (%).

Comparison 1 Aerobic training versus no physical training, Outcome 12 Annual rate of change in peak VE over 36 months (L/min).

Comparison 1 Aerobic training versus no physical training, Outcome 13 Change in FVC (% predicted).

Comparison 1 Aerobic training versus no physical training, Outcome 14 Change in FEF25‐75 (% predicted).

Comparison 1 Aerobic training versus no physical training, Outcome 15 Change in RV/TLC (%).

Comparison 1 Aerobic training versus no physical training, Outcome 16 Change in FEV1/FVC (% predicted).

Comparison 1 Aerobic training versus no physical training, Outcome 17 Change in total physical activity (counts per min).
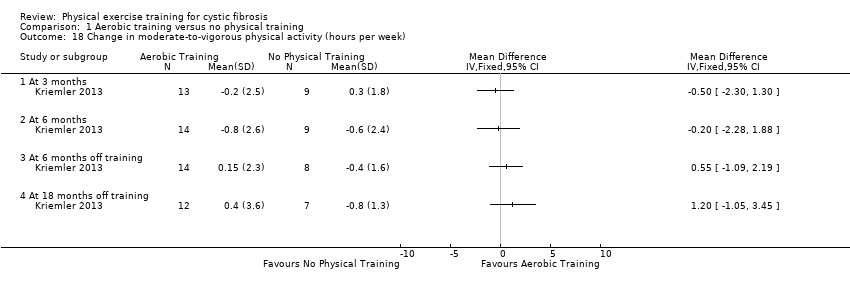
Comparison 1 Aerobic training versus no physical training, Outcome 18 Change in moderate‐to‐vigorous physical activity (hours per week).
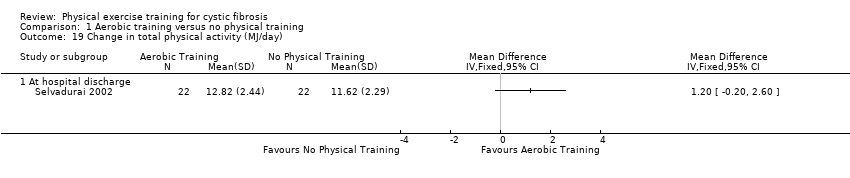
Comparison 1 Aerobic training versus no physical training, Outcome 19 Change in total physical activity (MJ/day).
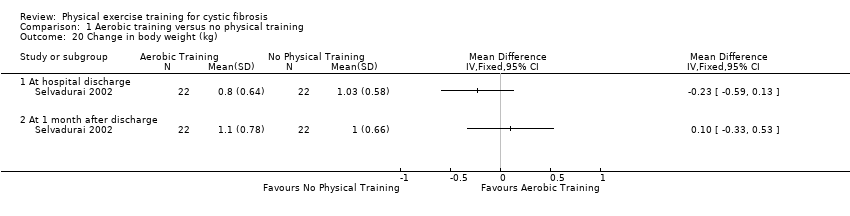
Comparison 1 Aerobic training versus no physical training, Outcome 20 Change in body weight (kg).

Comparison 1 Aerobic training versus no physical training, Outcome 21 Change in BMI (kg/m2).
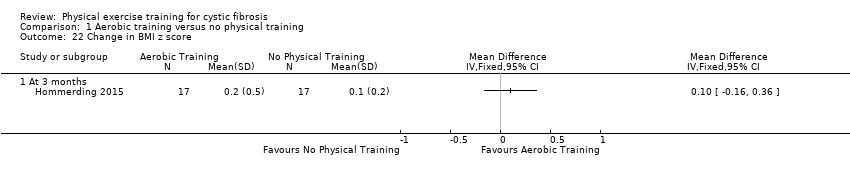
Comparison 1 Aerobic training versus no physical training, Outcome 22 Change in BMI z score.
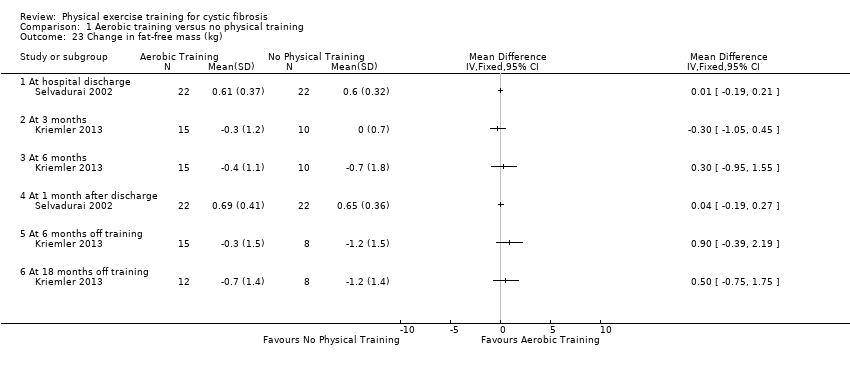
Comparison 1 Aerobic training versus no physical training, Outcome 23 Change in fat‐free mass (kg).

Comparison 1 Aerobic training versus no physical training, Outcome 24 Change in body fat (%).
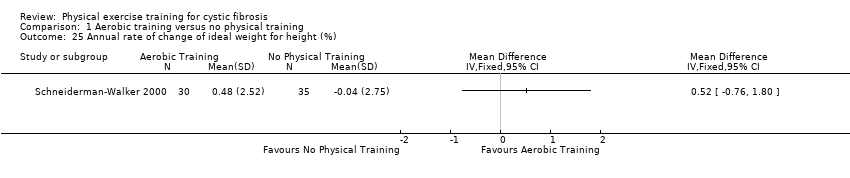
Comparison 1 Aerobic training versus no physical training, Outcome 25 Annual rate of change of ideal weight for height (%).
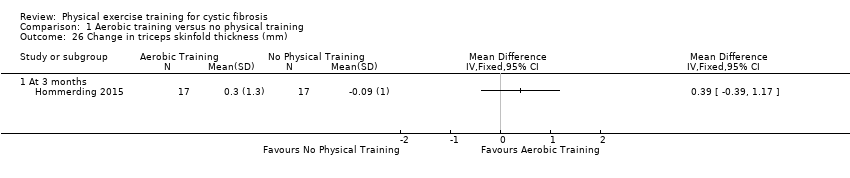
Comparison 1 Aerobic training versus no physical training, Outcome 26 Change in triceps skinfold thickness (mm).

Comparison 1 Aerobic training versus no physical training, Outcome 27 Change in arm muscle circumference (cm).
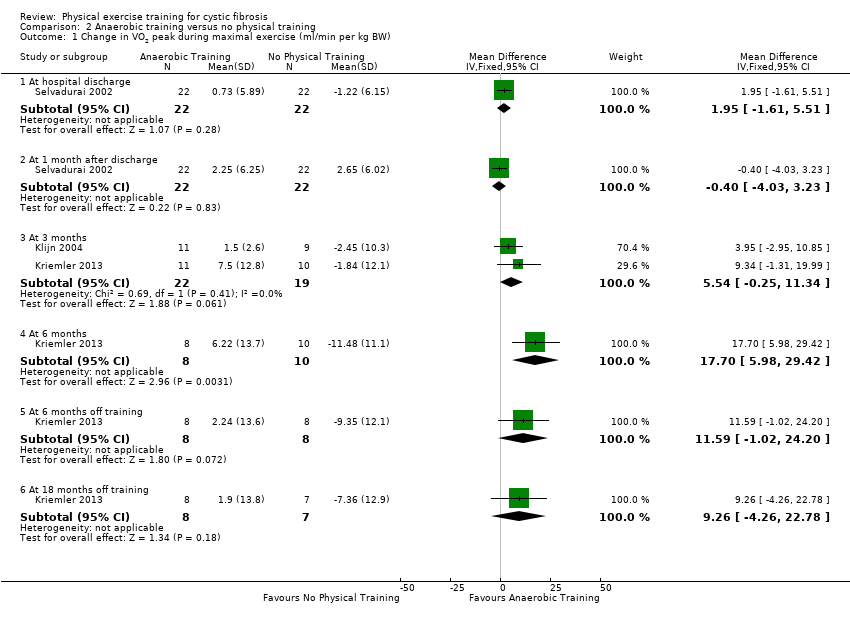
Comparison 2 Anaerobic training versus no physical training, Outcome 1 Change in VO2 peak during maximal exercise (ml/min per kg BW).
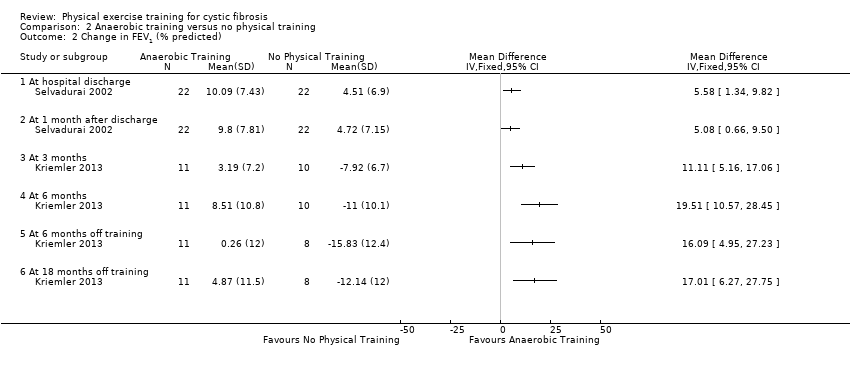
Comparison 2 Anaerobic training versus no physical training, Outcome 2 Change in FEV1 (% predicted).

Comparison 2 Anaerobic training versus no physical training, Outcome 3 Change in HRQoL.

Comparison 2 Anaerobic training versus no physical training, Outcome 4 Change in HRQoL physical function (CF questionnaire).
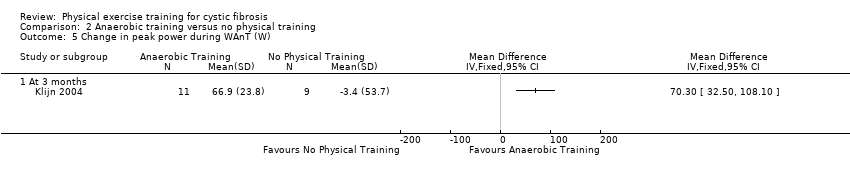
Comparison 2 Anaerobic training versus no physical training, Outcome 5 Change in peak power during WAnT (W).

Comparison 2 Anaerobic training versus no physical training, Outcome 6 Change in mean power during WAnT (W).

Comparison 2 Anaerobic training versus no physical training, Outcome 7 Change in mean power during WAnT (W per kg BW).
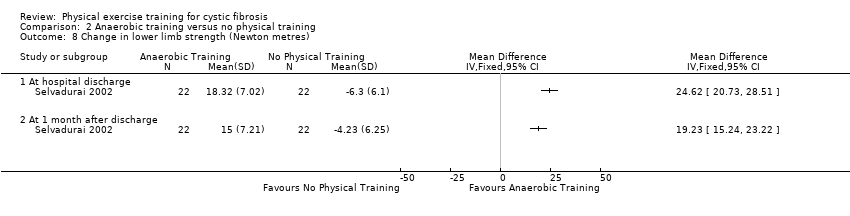
Comparison 2 Anaerobic training versus no physical training, Outcome 8 Change in lower limb strength (Newton metres).

Comparison 2 Anaerobic training versus no physical training, Outcome 9 Change in peak work capacity during maximal exercise (W).

Comparison 2 Anaerobic training versus no physical training, Outcome 10 Change in peak work capacity during maximal exercise (W per kg body weight).
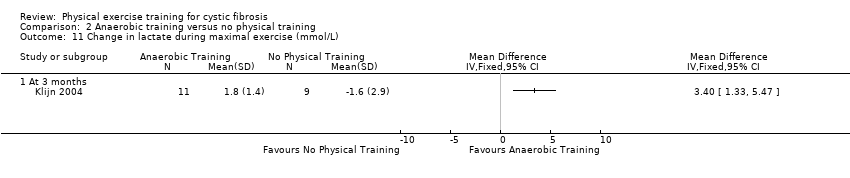
Comparison 2 Anaerobic training versus no physical training, Outcome 11 Change in lactate during maximal exercise (mmol/L).

Comparison 2 Anaerobic training versus no physical training, Outcome 12 Change in peak oxygen saturation during maximal exercise (%).

Comparison 2 Anaerobic training versus no physical training, Outcome 13 Change in FVC (% predicted).

Comparison 2 Anaerobic training versus no physical training, Outcome 14 Change in RV/TLC (%).

Comparison 2 Anaerobic training versus no physical training, Outcome 15 Change in total physical activity (counts per min).
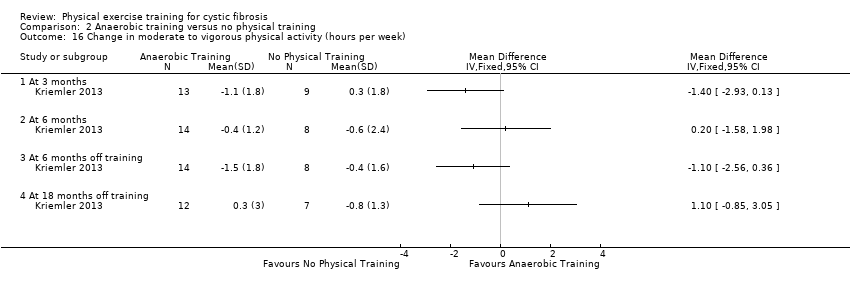
Comparison 2 Anaerobic training versus no physical training, Outcome 16 Change in moderate to vigorous physical activity (hours per week).

Comparison 2 Anaerobic training versus no physical training, Outcome 17 Change in physical activity (MJ/day).

Comparison 2 Anaerobic training versus no physical training, Outcome 18 Change in weight (kg).

Comparison 2 Anaerobic training versus no physical training, Outcome 19 Change in BMI (kg/m2).
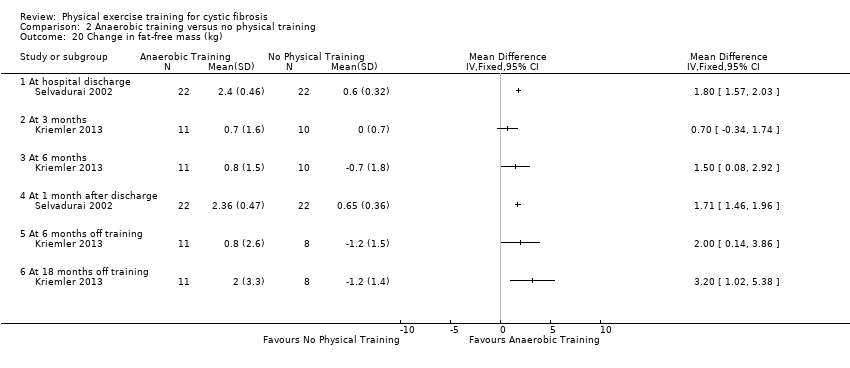
Comparison 2 Anaerobic training versus no physical training, Outcome 20 Change in fat‐free mass (kg).

Comparison 2 Anaerobic training versus no physical training, Outcome 21 Change in body fat (%).

Comparison 3 Combined aerobic and anaerobic training versus no physical training, Outcome 1 Change in VO2 peak during maximal exercise (ml/min per kg BW).
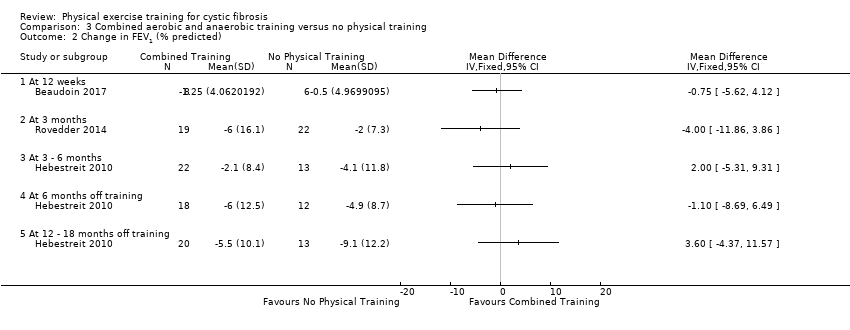
Comparison 3 Combined aerobic and anaerobic training versus no physical training, Outcome 2 Change in FEV1 (% predicted).
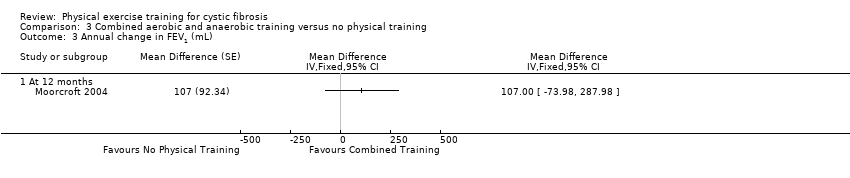
Comparison 3 Combined aerobic and anaerobic training versus no physical training, Outcome 3 Annual change in FEV1 (mL).

Comparison 3 Combined aerobic and anaerobic training versus no physical training, Outcome 4 Change in subjective health perception (CFQ‐R).
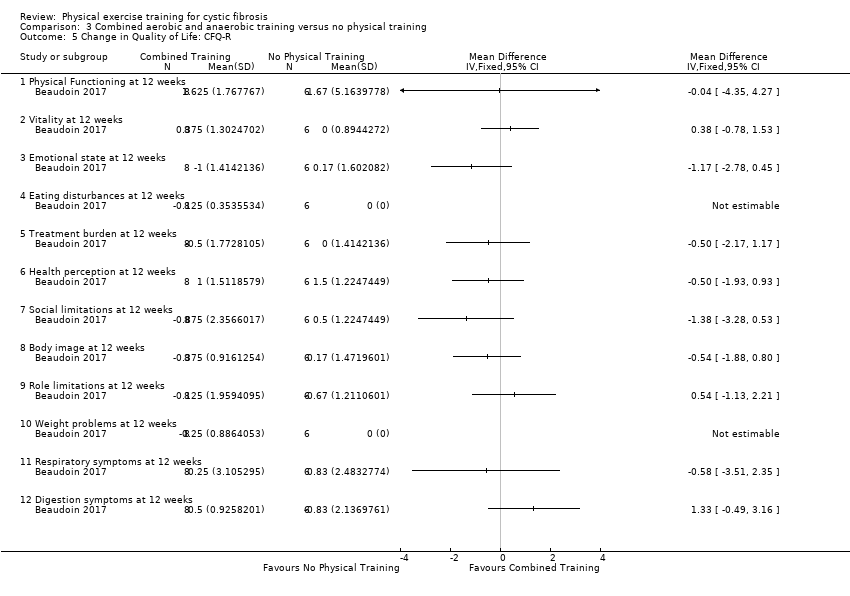
Comparison 3 Combined aerobic and anaerobic training versus no physical training, Outcome 5 Change in Quality of Life: CFQ‐R.
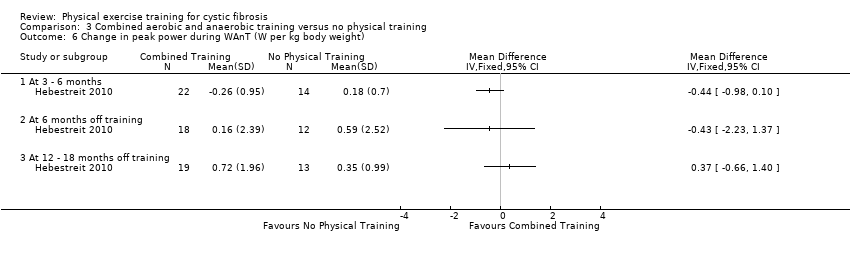
Comparison 3 Combined aerobic and anaerobic training versus no physical training, Outcome 6 Change in peak power during WAnT (W per kg body weight).

Comparison 3 Combined aerobic and anaerobic training versus no physical training, Outcome 7 Change in mean power during WAnT (W per kg body weight).

Comparison 3 Combined aerobic and anaerobic training versus no physical training, Outcome 8 Change in muscle strength (all limbs) (1RM test).
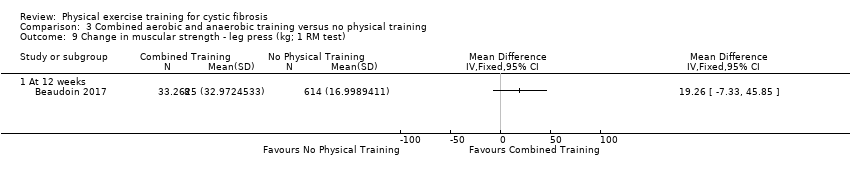
Comparison 3 Combined aerobic and anaerobic training versus no physical training, Outcome 9 Change in muscular strength ‐ leg press (kg; 1 RM test).

Comparison 3 Combined aerobic and anaerobic training versus no physical training, Outcome 10 Change in Muscular Strength ‐ Chest press (kg; 1 RM test).

Comparison 3 Combined aerobic and anaerobic training versus no physical training, Outcome 11 Change in Muscular Strength ‐ Latpull down (kg; 1 RM test).
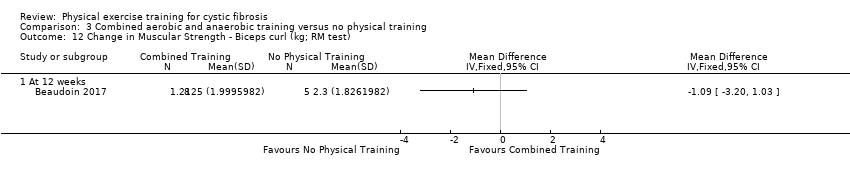
Comparison 3 Combined aerobic and anaerobic training versus no physical training, Outcome 12 Change in Muscular Strength ‐ Biceps curl (kg; RM test).

Comparison 3 Combined aerobic and anaerobic training versus no physical training, Outcome 13 Change in Muscular Endurance ‐ Number of push ups.

Comparison 3 Combined aerobic and anaerobic training versus no physical training, Outcome 14 Change in Muscular Endurance ‐ Number of sit ups.
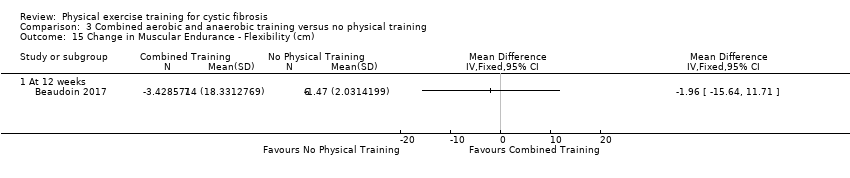
Comparison 3 Combined aerobic and anaerobic training versus no physical training, Outcome 15 Change in Muscular Endurance ‐ Flexibility (cm).

Comparison 3 Combined aerobic and anaerobic training versus no physical training, Outcome 16 Change in Muscular Endurance ‐ hand grip strength (kg).
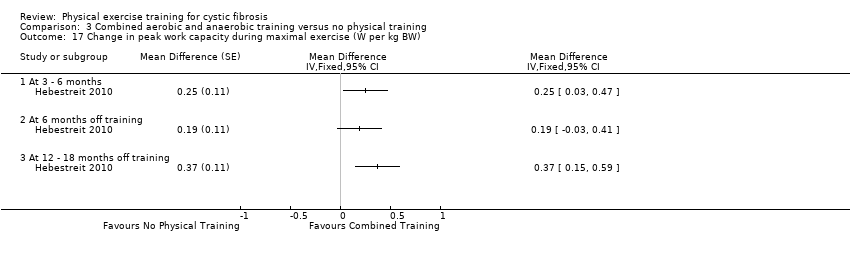
Comparison 3 Combined aerobic and anaerobic training versus no physical training, Outcome 17 Change in peak work capacity during maximal exercise (W per kg BW).

Comparison 3 Combined aerobic and anaerobic training versus no physical training, Outcome 18 Change in functional exercise capacity.

Comparison 3 Combined aerobic and anaerobic training versus no physical training, Outcome 19 Change in peak heart rate during 6MWT (beats/min).

Comparison 3 Combined aerobic and anaerobic training versus no physical training, Outcome 20 Annual change in peak heart rate (beat/min).

Comparison 3 Combined aerobic and anaerobic training versus no physical training, Outcome 21 Annual change in VE (L/min).
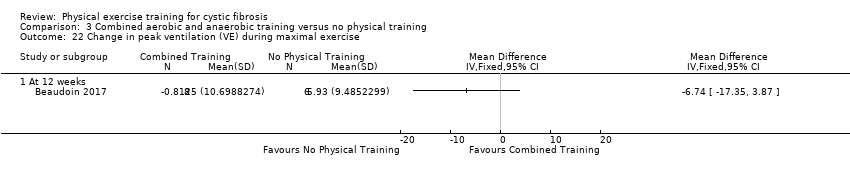
Comparison 3 Combined aerobic and anaerobic training versus no physical training, Outcome 22 Change in peak ventilation (VE) during maximal exercise.
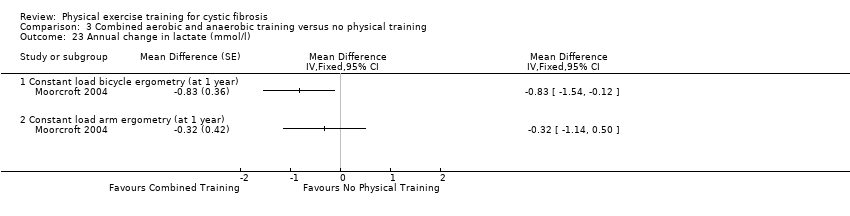
Comparison 3 Combined aerobic and anaerobic training versus no physical training, Outcome 23 Annual change in lactate (mmol/l).
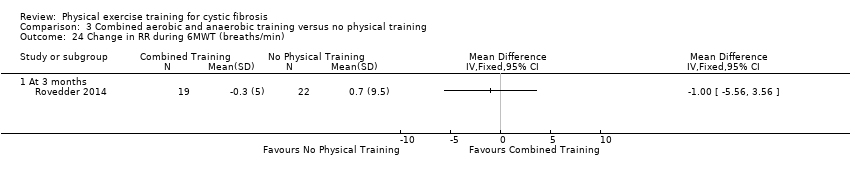
Comparison 3 Combined aerobic and anaerobic training versus no physical training, Outcome 24 Change in RR during 6MWT (breaths/min).

Comparison 3 Combined aerobic and anaerobic training versus no physical training, Outcome 25 Annual change in RR (breaths/min).
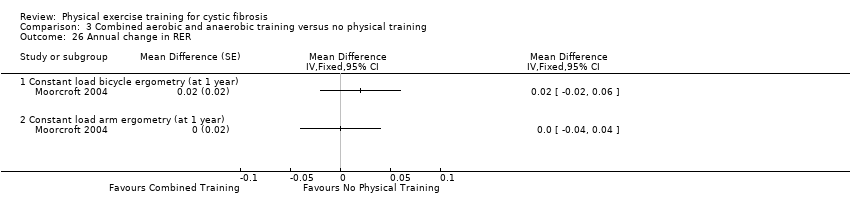
Comparison 3 Combined aerobic and anaerobic training versus no physical training, Outcome 26 Annual change in RER.

Comparison 3 Combined aerobic and anaerobic training versus no physical training, Outcome 27 Change in oxygen saturation (%).
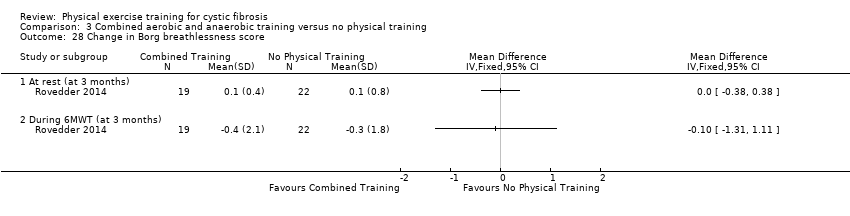
Comparison 3 Combined aerobic and anaerobic training versus no physical training, Outcome 28 Change in Borg breathlessness score.
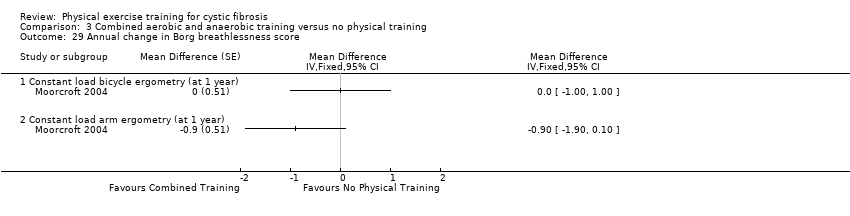
Comparison 3 Combined aerobic and anaerobic training versus no physical training, Outcome 29 Annual change in Borg breathlessness score.

Comparison 3 Combined aerobic and anaerobic training versus no physical training, Outcome 30 Change in Borg fatigue score.

Comparison 3 Combined aerobic and anaerobic training versus no physical training, Outcome 31 Annual change in Borg muscle effort.

Comparison 3 Combined aerobic and anaerobic training versus no physical training, Outcome 32 Change in FVC (% predicted).
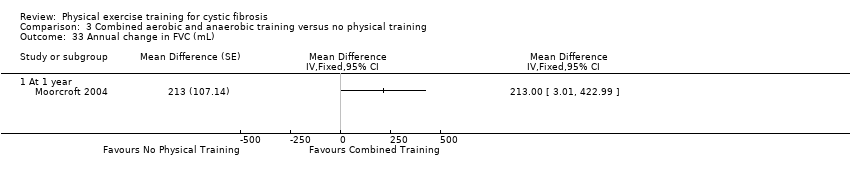
Comparison 3 Combined aerobic and anaerobic training versus no physical training, Outcome 33 Annual change in FVC (mL).

Comparison 3 Combined aerobic and anaerobic training versus no physical training, Outcome 34 Change in RV/TLC (%).

Comparison 3 Combined aerobic and anaerobic training versus no physical training, Outcome 35 Change in Total Energy Expenditure (k/cal).
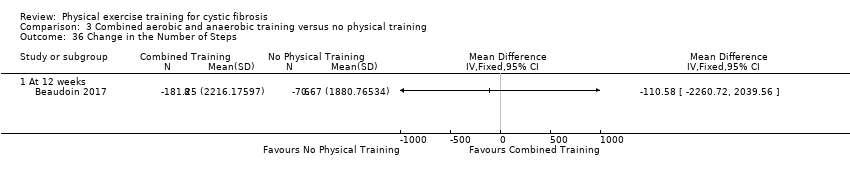
Comparison 3 Combined aerobic and anaerobic training versus no physical training, Outcome 36 Change in the Number of Steps.
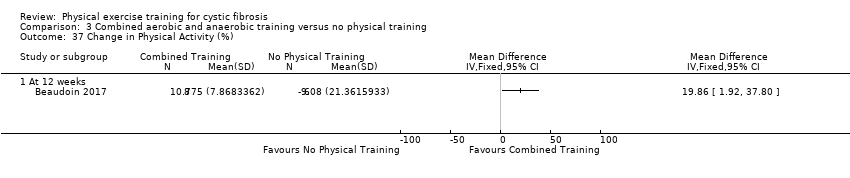
Comparison 3 Combined aerobic and anaerobic training versus no physical training, Outcome 37 Change in Physical Activity (%).
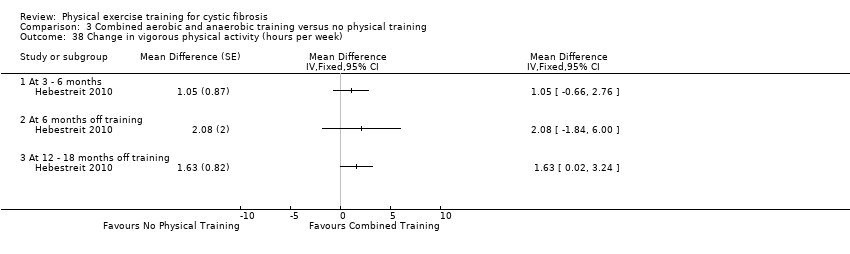
Comparison 3 Combined aerobic and anaerobic training versus no physical training, Outcome 38 Change in vigorous physical activity (hours per week).
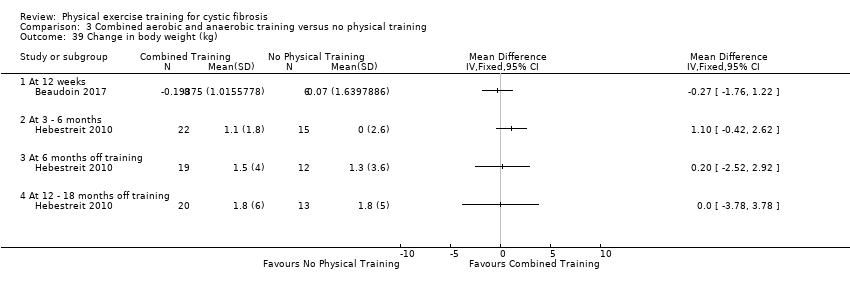
Comparison 3 Combined aerobic and anaerobic training versus no physical training, Outcome 39 Change in body weight (kg).

Comparison 3 Combined aerobic and anaerobic training versus no physical training, Outcome 40 Change in BMI (kg/m2).

Comparison 3 Combined aerobic and anaerobic training versus no physical training, Outcome 41 Change in sum of four skinfolds (mm).
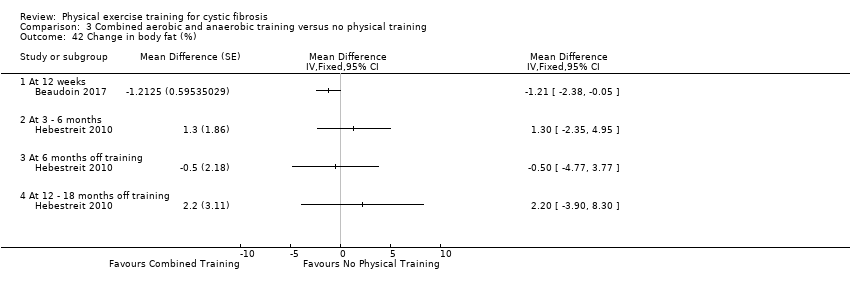
Comparison 3 Combined aerobic and anaerobic training versus no physical training, Outcome 42 Change in body fat (%).

Comparison 3 Combined aerobic and anaerobic training versus no physical training, Outcome 43 Change in fat‐mass (kg).
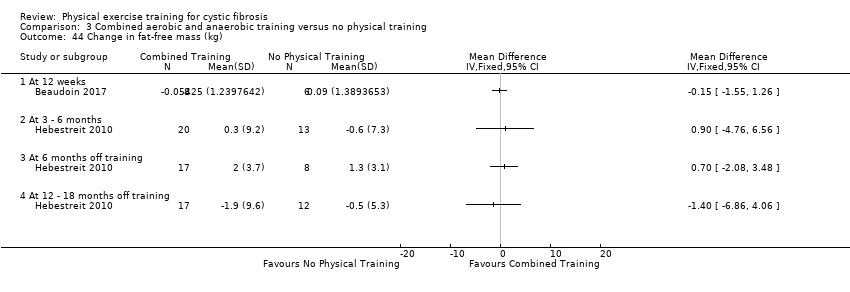
Comparison 3 Combined aerobic and anaerobic training versus no physical training, Outcome 44 Change in fat‐free mass (kg).

Comparison 3 Combined aerobic and anaerobic training versus no physical training, Outcome 45 Change in metabolic parameters (HbA1c (%)).
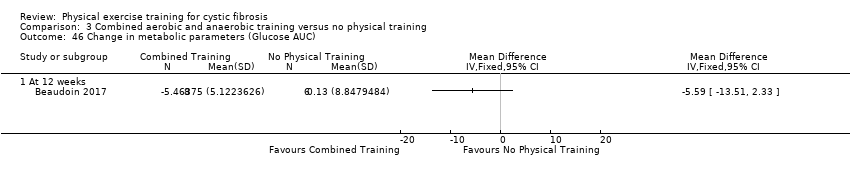
Comparison 3 Combined aerobic and anaerobic training versus no physical training, Outcome 46 Change in metabolic parameters (Glucose AUC).

Comparison 3 Combined aerobic and anaerobic training versus no physical training, Outcome 47 Change in metabolic parameters (Total Insulin AUC).

Comparison 3 Combined aerobic and anaerobic training versus no physical training, Outcome 48 Change in metabolic parameters (Insulin Sensitivity Index).

Comparison 3 Combined aerobic and anaerobic training versus no physical training, Outcome 49 Change in Plasma Glucose (mmol/L).
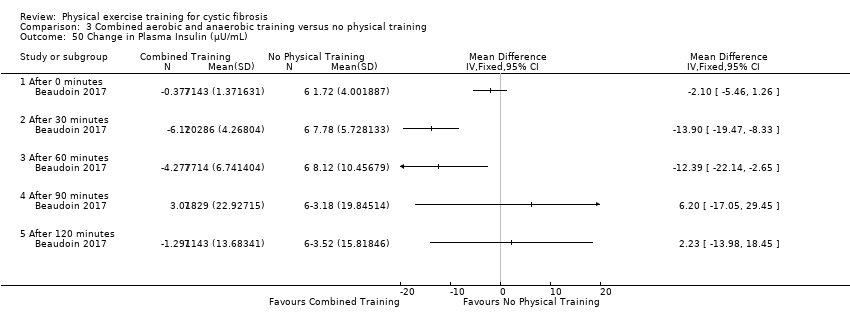
Comparison 3 Combined aerobic and anaerobic training versus no physical training, Outcome 50 Change in Plasma Insulin (µU/mL).
| Aerobic training compared with no physical training for cystic fibrosis | ||||||
| Patient or population: adults and children with cystic fibrosis Settings: Outpatients Intervention: Aerobic training Comparison: No physical training | ||||||
| Outcomes | Illustrative comparative risks* (95% CI) | Relative effect | No of participants | Quality of the evidence | Comments | |
| Assumed risk | Corresponding risk | |||||
| No physical training | Aerobic training | |||||
| Exercise capacity: change in VO2 peak during maximal exercise (mL/min per kg body weight) Follow‐up: from hospital discharge up to 3 years | Short‐term improvements in exercise tolerance during aerobic training were significantly greater than with no physical training at hospital discharge and 1 month after hospital discharge. One study showed no difference between groups at 3 months and 1 study showed a significant improvement in exercise tolerance following aerobic training at 6 months compared to no physical training. No significant longer‐term differences between groups were observed. | NA | 170 (4 studies) | ⊕⊝⊝⊝ | ||
| Pulmonary function: change in FEV1 (% predicted) Follow‐up: from hospital discharge up to 3 years | There were no short‐term differences between groups at hospital discharge or one month after hospital discharge. Two studies showed a significant improvement in pulmonary function during and following aerobic training at 3 months, 6 months and 18 months post‐training compared to no physical training. However, 1 study showed no significant differences in annual change of pulmonary function between groups were observed over 36 months. | NA | 187 (5 studies) | ⊕⊕⊝⊝ | ||
| HRQoL: CFQ Quality of Well‐being Scale and perceived 'positive effects.' Follow‐up: one month after hospital discharge up to three years | No significant differences between the groups were shown according to the CFQ. A significant improvement in HRQoL according to the Quality of Well‐being Scale was observed in the aerobic exercise group compared to the no physical training group at 1 month after hospital discharge, MD 0.10 (95% CI 0.03 to 0.17). Positive effects were reported by 43 out of 49 participants (not reported by treatment group). | NA | 143 (3 studies) | ⊕⊕⊝⊝ | ||
| CF‐related mortality Follow‐up: NA | Outcome not reported. | NA | ||||
| Pulmonary exacerbations: number of hospitalisations and number of days in hospital Follow‐up: up to three years | There were no between‐group differences reported for the mean number of hospitalisations or mean number of days in hospital at year 1, 2 and 3. | NA | 65 (1 study) | ⊕⊕⊝⊝ | ||
| Diabetic control Follow‐up:NA | Outcome not reported. | NA | ||||
| Adverse events Follow‐up: up to two years | One study reported that no adverse effects occurred. In the other study, 1 participant in the aerobic training group injured her ankle and missed 2 days of aerobic training. One participant from the control group developed haemoptysis and withdrew from the study. | NA | 71 (2 studies) | ⊕⊕⊕⊝ | ||
| *The basis for the assumed risk (e.g. the median control group risk across studies) is provided in footnotes. The corresponding risk (and its 95% confidence interval) is based on the assumed risk in the comparison group and the relative effect of the intervention (and its 95% CI). | ||||||
| GRADE Working Group grades of evidence | ||||||
| 1. Downgraded once due to risk of bias: Methodological details of the studies relating to randomisation and allocation concealment were unclear; one study used an inadequate method of randomisation and allocation concealment which may have introduced bias. | ||||||
| Anaerobic training compared with no physical training for cystic fibrosis | ||||||
| Patient or population: adults and children with cystic fibrosis Settings: outpatients Intervention: anaerobic training Comparison: no physical training | ||||||
| Outcomes | Illustrative comparative risks* (95% CI) | Relative effect | No of participants | Quality of the evidence | Comments | |
| Assumed risk | Corresponding risk | |||||
| No physical training | Anaerobic training | |||||
| Exercise capacity: change in VO2 peak during maximal exercise (mL/min per kg BW) Follow‐up: from hospital discharge up to 3 years | One study showed a significant improvement in exercise capacity following anaerobic training at 6 months compared to no physical training. No significant differences between groups were observed at any other time points. | NA | 86 (3 studies) | ⊕⊕⊝⊝ | ||
| Pulmonary function: change in FEV1 (% predicted) Follow‐up: from hospital discharge up to 3 years | Two studies showed a significant improvement in pulmonary function during and following anaerobic training at hospital discharge, 1 month after discharge, 3 months, 6 months and 18 months post‐training compared to no physical training. The second study showed no significant differences in lung function at any time point. | NA | 86 (3 studies) | ⊕⊕⊝⊝ | ||
| HRQoL: Quality of Well‐being Scale or HRQoL scale physical function Follow‐up: up to 2 years | No significant differences between groups were observed according to the Quality of Well‐being Scale or HRQoL scale physical function. | NA | 64 (2 studies) | ⊕⊕⊝⊝ | ||
| CF‐related mortality Follow‐up: NA | Outcome not reported. | NA | ||||
| Pulmonary exacerbations Follow‐up: NA | Outcome not reported. | NA | ||||
| Diabetic control Follow‐up: NA | Outcome not reported. | NA | ||||
| Adverse events Follow‐up: 2 years | One study reported that no adverse effects occurred. | NA | 22 (1 study) | ⊕⊕⊕⊝ | ||
| *The basis for the assumed risk (e.g. the median control group risk across studies) is provided in footnotes. The corresponding risk (and its 95% confidence interval) is based on the assumed risk in the comparison group and the relative effect of the intervention (and its 95% CI). | ||||||
| GRADE Working Group grades of evidence | ||||||
| 1. Downgraded once due to risk of bias: methodological details of the studies relating to randomisation and allocation concealment were unclear; one study used an inadequate method of randomisation and allocation concealment which may have introduced bias. | ||||||
| Combined aerobic and anaerobic training compared with no physical training for cystic fibrosis | ||||||
| Patient or population: adults and children with cystic fibrosis Settings: outpatients Intervention: combined aerobic and anaerobic training Comparison: no physical training | ||||||
| Outcomes | Illustrative comparative risks* (95% CI) | Relative effect | No of participants | Quality of the evidence | Comments | |
| Assumed risk | Corresponding risk | |||||
| No physical training | Combined aerobic and anaerobic training | |||||
| Exercise capacity: change in VO2 peak during maximal exercise (mL/min per kg body weight) Follow‐up: 12 weeks to two years | A significantly higher VO2 peak was found in the combined training compared to the no physical training group after 12 to 18 months in 1 study. No significant difference between groups was found at any other time point. | NA | 52 (2 studies) | ⊕⊕⊝⊝ | Two additional studies recruiting 42 participants showed significant group x time interactions for VO2 peak; however, these results are not included in this review due to concerns over inconsistencies in the data provided to us by the original trial authors. | |
| Pulmonary function: change in FEV1 (% predicted) or mL Follow‐up: 12 weeks to two years | No significant differences in pulmonary function were observed between treatment groups at any time point. | NA | 103 (3 studies) | ⊕⊕⊝⊝ | ||
| HRQoL: CFQ, Medical Outcomes Study‐36 Item Short‐Form Health Survey, SF‐36 Follow‐up: 12 weeks to 2 years | Two studies showed no significant differences in any HRQoL scale. One study showed a significant improvement in subjective health perception in the combined training group after 3 to 6 months and after 12 to 18 months (but not between 6 and 12 months). | NA | 93 (3 studies) | ⊕⊝⊝⊝ | ||
| CF‐related mortality Follow‐up: NA | Outcome not reported. | NA | ||||
| Pulmonary exacerbations Follow‐up: NA | Outcome not reported. | NA | ||||
| Diabetic control Follow‐up: 12 weeks | Significant differences in some of the parameters were observed in the no physical training group compared to the combined training group and vice versa. Also no significant differences were observed for some parameters. | NA | 14 (1 study) | ⊕⊝⊝⊝ | The study reported a range of metabolic parameters (HbA1c(%), Glucose AUC, Total Insulin AUC, Insulin Sensitivity Index) Plasma Glucose and Plasma Insulin. | |
| Adverse events Follow‐up: NA | Outcome not reported. | NA | ||||
| *The basis for the assumed risk (e.g. the median control group risk across studies) is provided in footnotes. The corresponding risk (and its 95% confidence interval) is based on the assumed risk in the comparison group and the relative effect of the intervention (and its 95% CI). | ||||||
| GRADE Working Group grades of evidence | ||||||
| 1. Downgraded once due to risk of bias: methodological details of the studies relating to randomisation and allocation concealment were unclear; one study used an inadequate method of randomisation and allocation concealment which may have introduced bias. | ||||||
| Variable | Group | Pre‐training | Post‐training | Detraining | P value (group x time) | Comments |
| Age (mean (SE)) years | Intervention | 11 (3) | ‐ | ‐ | ‐ | |
| Control | 10 (2) | ‐ | ‐ | ‐ | ||
| Sex (% boys) | Intervention | 55 | ‐ | ‐ | ‐ | |
| Control | 64 | ‐ | ‐ | ‐ | ||
| VO2 peak (mean (95% CI)) ml/min per kg body weight | Intervention | n.a. | 3.9 (1.8 to 6.1) | ‐3.4 (‐5.7 to 1.7) | 0.036 | Significantly higher in controls at baseline (P = 0.023). Data were presented in a figure in the original publication. |
| Control | n.a. | ‐2.2 (‐5.3 to 0.1) | ‐0.7 (‐4.4 to 5.9) | |||
| Leg press (mean (95% CI)) kg | Intervention | n.a. | 24.9 (14.3 to 34.4) | ‐1.0 (‐4.1 to 3.3) | < 0.001 | Data are reported in a figure in the original publication. Significantly higher in controls at baseline (P = 0.014). |
| Control | n.a. | n.a. | n.a. | |||
| Bench press (mean (95% CI)) kg | Intervention | n.a. | 10.5 (7.0 to 14.0) | ‐1.2 (‐3.6 to 3.0) | < 0.001 | Significantly higher in controls at baseline (P = 0.007). Data presented in a figure in the original publication. |
| Control | n.a. | n.a. | n.a. | |||
| Seated row (mean (95% CI)) kg | Intervention | n.a. | 12.7 (9.2 to 16.0) | ‐0.2 (‐3.6 to 3.2) | < 0.001 | Significantly higher in controls at baseline (P = 0.009). Data presented in a figure in the original publication. |
| Control | n.a. | n.a. | n.a. | |||
| Oxygen saturation at peak exercise (mean (SE)) | Intervention | 94.9 (0.9)% | 95.6 (0.8)% | 94.5 (1.2)% | n.a. | |
| Control | 95.7 (0.5)% | 96.4 (0.4)% | 96.1 (0.5)% | |||
| FEV1 (mean (SE)) litres | Intervention | 1.87 (0.24) | 1.94 (0.23) | 1.90 (0.25) | 0.769 | |
| Control | 1.77 (0.17) | 1.87 (0.15) | 1.79 (0.19) | |||
| FVC (mean (SE)) litres | Intervention | 2.41 (0.24) | 2.49 (0.25) | 2.56 (0.29) | 0.920 | |
| Control | 2.29 (0.19) | 2.36 (0.20) | 2.40 (0.24) | |||
| PImax (mean (SE)) cm H2O | Intervention | 64.0 (5.5) | 69.8 (6.8) | 75.2 (6.2) | 0.797 | |
| Control | 61.5 (6.9) | 72.2 (7.2) | 76.4 (7.5) | |||
| HRQoL score ‐ children's report (median (range)) | Intervention | 696 (495 ‐ 741) | 719 (550 ‐ 734) | ‐ | 0.257 | HRQoL was assessed before and after the intervention. P value for comparison pre versus post‐training. |
| Control | 649 (578 ‐ 768) | 638 (461 ‐ 791) | ‐ | |||
| HRQoL score ‐ parents' report (median (range)) | Intervention | 896 (688‐1011) | 889 (811 ‐ 973) | ‐ | 0.143 | HRQoL was assessed before and after the intervention. |
| Control | 911 (842 ‐ 1028) | 978 (684 ‐ 1059) | ‐ | |||
| Weight (mean (SE)) kg | Intervention | 39.9 (3.5) | 40.5 (3.4) | 41.4 (3.4) | 0.723 | |
| Control | 34.0 (2.6) | 35.1 (2.8) | 36.2 (3.0) | |||
| BMI (mean (SE)) kg/m² | Intervention | 18.4 (1.0) | 18.3 (0.7) | 18.5 (0.7) | 0.959 | |
| Control | 17.2 (0.8) | 17.1 (0.8) | 17.4 (0.9) | |||
| Fat‐free mass (mean (SE)) % | Intervention | 78.1 (2.7) | 79.4 (2.8) | 78.8 (2.9) | 0.115 | |
| Control | 81.1 (2.5) | 80.9 (2.1) | 81.1 (2.2) | |||
| Body fat (mean (SE)) % | Intervention | 21.9 (2.7) | 20.6 (2.8) | 21.2 (2.9) | 0.115 | |
| Control | 18.9 (2.5) | 19.1 (2.1) | 18.9 (2.2) | |||
| Compliance with physical training (mean (SE)) % | Intervention | ‐ | 95.1 (7.4) | ‐ | ‐ ‐ | 73% of children completed all training sessions. |
| Control | ‐ | ‐ | ‐ | |||
| Adverse effects | Intervention | ‐ | ‐ | ‐ | ‐ | No adverse effects occurred during training or maximal exercise testing. |
| Control | ‐ | ‐ | ‐ | |||
| BMI: body mass index | ||||||
| Variable | Group | Pre‐training | Post‐training | Detraining | P value (group x time) | Comments |
| Age (mean (SE)) years | Intervention | 11 (1) | ‐ | ‐ | ‐ | |
| Control | 10 (1) | ‐ | ‐ | ‐ | ||
| Sex (% boys) | Intervention | 60 | ‐ | ‐ | ‐ | |
| Control | 60 | ‐ | ‐ | ‐ | ||
| VO2 peak (mean (95% CI) ml/min per kg body weight | Intervention | n.a. | 6.9 (3.4 to 10.5) | ‐1.5 (‐2.7 to ‐0.4) | < 0.001 | Significantly higher in controls at baseline (P = 0.034). |
| Control | n.a. | n.a. | n.a. | |||
| Leg press (mean (SE)) kg | Intervention | 62.5 (6.5) | 89.5 (9.3) | 88.6 (9.2) | < 0.001 | Significantly higher in controls at baseline (P = 0.046). |
| Control | 45.2 (4.7) | 43.9 (5.1) | 43.9 (5.4) | |||
| Bench press (mean (SE)) kg | Intervention | 26.4 (2.7) | 38.4 (3.2) | 35.9 (2.9) | < 0.001 | |
| Control | 23.2 (2.9) | 21.6 (3.2) | 21.7 (3.6) | |||
| Lateral row (mean (SE)) kg | Intervention | 30.5 (3.6) | 43.0 (4.2) | 35.9 (2.9) | < 0.001 | |
| Control | 23.2 (3.0) | 22.0 (3.1) | 21.7 (3.6) | |||
| Oxygen saturation at peak exercise (mean (SE)) % | Intervention | 94.7 (0.7) | 94.5 (0.7) | 93.1 (0.8) | n.a. | |
| Control | 96.4 (0.4) | 96.2 (0.5) | 96.1 (0.6) | |||
| FEV1 (mean (SE)) L | Intervention | 1.65 (0.19) | 1.74 (0.23) | 1.69 (0.24) | 0.486 | |
| Control | 1.57 (0.26) | 1.55 (0.26) | 1.59 (0.26) | |||
| FVC (mean (SE)) L | Intervention | 2.23 (0.27) | 2.34 (0.29) | 2.28 (0.28) | 0.156 | |
| Control | 1.90 (0.33) | 1.85 (0.32) | 1.92 (0.32) | |||
| PImax (mean (SE)) cm H2O | Intervention | 68.3 (6.3) | 107.6 (8.4) | 103.2 (8.1) | < 0.001 | |
| Control | 69.5 (9.7) | 71.8 (10.0) | 66.7 (9.4) | |||
| HRQoL score (median (min ‐ max)) | Intervention | 629 (505 ‐ 701) | 688 (609 ‐ 791) | ‐ | 0.071 | HRQoL was assessed before and after the intervention. |
| Control | 636 (626 ‐ 745) | 638 (626 ‐ 737) | ‐ | |||
| Weight (mean (SE)) kg | Intervention | 36.4 (3.1) | 37.8 (3.2) | 38.3 (3.1) | 0.342 | |
| Control | 31.5 (4.6) | 32.4 (4.7) | 32.7 (4.5) | |||
| Fat‐free mass (mean (SE)) % of total | Intervention | 81.6 (1.3) | 82.6 (1.0) | 82.5 (1.0) | 0.001 | |
| Control | 82.9 (1.8) | 82.8 (1.8) | 82.5 (1.9) | |||
| Body fat (mean (SE)) % of total | Intervention | 18.4 (1.3) | 17.4 (1.2) | 17.5 (1.1) | 0.023 | |
| Control | 17.1 (1.8) | 17.2 (1.8) | 17.5 (1.9) | |||
| Compliance with physical training (mean (SE)) % | Intervention | ‐ | 97.5 (1.7) | ‐ | 70% of children completed all training sessions. | |
| Control | ‐ | ‐ | ‐ | |||
| Adverse effects | Intervention | ‐ | ‐ | ‐ | No adverse effects occurred during training or exercise testing. | |
| Control | ‐ | ‐ | ‐ | |||
| CI: confidence interval | ||||||
| Health‐related quality of life | Exercise group (n = 19) | Control group (n = 22) | P value |
| HRQoL scale ‐ physical (median (interquartile range)) | 6.1 (‐4 to 8) | 2.4 (‐10 to 13) | 0.742 |
| HRQoL scale ‐ body image (median (interquartile range)) | 3.3 (‐11 to 22) | 3.0 (‐2 to 11) | 0.915 |
| HRQoL scale ‐ digestive (median (interquartile range)) | ‐1.0 (‐4 to 0) | ‐0.5 (0 to 0) | 0.953 |
| HRQoL scale ‐ respiratory (median (interquartile range)) | 3.8 (0 to 11) | ‐4.7 (‐1 to 7) | 0.925 |
| HRQoL scale ‐ emotional (median (interquartile range)) | 1.2 (‐6 to 6) | ‐4.3 (‐13 to 6) | 0.458 |
| HRQoL scale ‐ social (median (interquartile range)) | ‐1.1 (‐11 to 5) | ‐1.7 (‐5 to 11) | 0.822 |
| HRQoL scale ‐ food (median (interquartile range)) | ‐0.3 (‐11 to 6) | ‐2.0 (‐11 to 0) | 0.913 |
| HRQoL scale ‐ treatment (median (interquartile range)) | ‐2.0 (‐11 to 0) | ‐2.5 (‐11 to 11) | 0.850 |
| HRQoL scale ‐ vitality (median (interquartile range)) | ‐1.2 (‐16 to 8) | 2.6 (‐8 to 10) | 0.579 |
| HRQoL scale ‐ health (median (interquartile range)) | 1.7 (‐11 to 16) | ‐3.0 (‐11 to 0) | 0.382 |
| HRQoL scale ‐ weight (median (interquartile range)) | 4.6 (0 to 33) | 12.1 (0 to 11) | 0.410 |
| HRQoL scale ‐ social role (median (interquartile range)) | 0.8 (‐8 to 8) | 1.8 (‐2 to 0) | 0.935 |
| SF‐36 ‐ functional capacity (median (interquartile range)) | 2.8 (‐10 to 15) | 2.0 (‐11 to 10) | 0.916 |
| SF‐36 ‐ physical aspects (median (interquartile range)) | 11.8 (‐25 to 50) | 6.8 (‐6 to 31) | 0.705 |
| SF‐36 ‐ pain (mean (median (interquartile range)) | ‐7.2 (‐28 to 11) | 8.0 (7 to 17) | 0.100 |
| SF‐36 ‐ general health (median (interquartile range)) | 3.7 (‐5 to 10) | ‐3.5 (‐11 to 5) | 0.197 |
| SF‐36 ‐ vitality (median (interquartile range)) | 1.2 (‐15 to 20) | 7.5 (‐1 to 21) | 0.416 |
| SF‐36 ‐ social aspects (median (interquartile range)) | 15.2 (0 to 33) | 21.2 (0 to 66) | 0.989 |
| SF‐36 ‐ emotional aspects (median (interquartile range)) | 4.7 (‐12 to 37) | 4.5 (‐12 to 25) | 0.914 |
| SF‐36 ‐ mental health (median (interquartile range)) | ‐0.8 (‐12 to 12) | 0.9 (‐9 to 13) | 0.752 |
| Pre‐post changes in HRQoL measured by the CFQ and the SF‐36 CFQ: Cystic Fibrosis Questionnaire | |||
| Outcome or subgroup title | No. of studies | No. of participants | Statistical method | Effect size |
| 1 Change in VO2 peak during maximal exercise (ml/min per kg BW) Show forest plot | 3 | Mean Difference (IV, Fixed, 95% CI) | Subtotals only | |
| 1.1 At hospital discharge | 1 | 44 | Mean Difference (IV, Fixed, 95% CI) | 8.53 [4.85, 12.21] |
| 1.2 At 1 month after discharge | 1 | 44 | Mean Difference (IV, Fixed, 95% CI) | 4.91 [1.13, 8.69] |
| 1.3 At 3 months | 2 | 59 | Mean Difference (IV, Fixed, 95% CI) | 2.29 [‐2.71, 7.29] |
| 1.4 At 6 months | 1 | 25 | Mean Difference (IV, Fixed, 95% CI) | 18.33 [8.95, 27.71] |
| 1.5 At 6 months off training | 1 | 22 | Mean Difference (IV, Fixed, 95% CI) | 9.51 [‐1.32, 20.34] |
| 1.6 At 18 months off training | 1 | 18 | Mean Difference (IV, Fixed, 95% CI) | 2.86 [‐9.70, 15.42] |
| 2 Change in FEV1(% predicted) Show forest plot | 4 | Mean Difference (IV, Fixed, 95% CI) | Subtotals only | |
| 2.1 At hospital discharge | 1 | 44 | Mean Difference (IV, Fixed, 95% CI) | 2.03 [‐2.31, 6.37] |
| 2.2 At 1 month after discharge | 1 | 44 | Mean Difference (IV, Fixed, 95% CI) | 1.53 [‐2.93, 5.99] |
| 2.3 At 3 months | 2 | 58 | Mean Difference (IV, Fixed, 95% CI) | 7.21 [2.49, 11.94] |
| 2.4 At 6 months | 1 | 25 | Mean Difference (IV, Fixed, 95% CI) | 17.17 [8.59, 25.75] |
| 2.5 At 6 months off training | 1 | 23 | Mean Difference (IV, Fixed, 95% CI) | 16.92 [6.07, 27.77] |
| 2.6 At 18 months off training | 1 | 20 | Mean Difference (IV, Fixed, 95% CI) | 12.45 [1.27, 23.63] |
| 2.7 Annual rate of change over 36 months | 1 | 65 | Mean Difference (IV, Fixed, 95% CI) | 2.01 [‐0.06, 4.08] |
| 3 Change in health‐related quality of life Show forest plot | 1 | Mean Difference (IV, Fixed, 95% CI) | Totals not selected | |
| 3.1 At 1 month after discharge | 1 | Mean Difference (IV, Fixed, 95% CI) | 0.0 [0.0, 0.0] | |
| 4 Change in mean power during WAnT (W per kg BW) Show forest plot | 1 | Mean Difference (IV, Fixed, 95% CI) | Totals not selected | |
| 4.1 At 3 months | 1 | Mean Difference (IV, Fixed, 95% CI) | 0.0 [0.0, 0.0] | |
| 4.2 At 6 months | 1 | Mean Difference (IV, Fixed, 95% CI) | 0.0 [0.0, 0.0] | |
| 4.3 At 6 months off training | 1 | Mean Difference (IV, Fixed, 95% CI) | 0.0 [0.0, 0.0] | |
| 4.4 At 18 months off training | 1 | Mean Difference (IV, Fixed, 95% CI) | 0.0 [0.0, 0.0] | |
| 5 Change in strength (Newton metres) Show forest plot | 1 | Mean Difference (IV, Fixed, 95% CI) | Totals not selected | |
| 5.1 At hospital discharge | 1 | Mean Difference (IV, Fixed, 95% CI) | 0.0 [0.0, 0.0] | |
| 5.2 At 1 month after discharge | 1 | Mean Difference (IV, Fixed, 95% CI) | 0.0 [0.0, 0.0] | |
| 6 Change in peak work capacity during maximal exercise (W per kg BW) Show forest plot | 1 | Mean Difference (IV, Fixed, 95% CI) | Totals not selected | |
| 6.1 At 3 months | 1 | Mean Difference (IV, Fixed, 95% CI) | 0.0 [0.0, 0.0] | |
| 6.2 At 6 months | 1 | Mean Difference (IV, Fixed, 95% CI) | 0.0 [0.0, 0.0] | |
| 6.3 At 6 months off training | 1 | Mean Difference (IV, Fixed, 95% CI) | 0.0 [0.0, 0.0] | |
| 6.4 At 18 months off training | 1 | Mean Difference (IV, Fixed, 95% CI) | 0.0 [0.0, 0.0] | |
| 7 Annual rate of change in peak work capacity during maximal exercise over 36 month (%) Show forest plot | 1 | Mean Difference (IV, Fixed, 95% CI) | Totals not selected | |
| 8 Change in treadmill speed (km/h) Show forest plot | 1 | Mean Difference (IV, Fixed, 95% CI) | Totals not selected | |
| 8.1 At 3 months | 1 | Mean Difference (IV, Fixed, 95% CI) | 0.0 [0.0, 0.0] | |
| 9 Change in treadmill exercise time (min) Show forest plot | 1 | Mean Difference (IV, Fixed, 95% CI) | Totals not selected | |
| 9.1 At 3 months | 1 | Mean Difference (IV, Fixed, 95% CI) | 0.0 [0.0, 0.0] | |
| 10 Change in heart rate (beats per min) Show forest plot | 2 | Mean Difference (IV, Fixed, 95% CI) | Totals not selected | |
| 10.1 At rest at 3 months | 1 | Mean Difference (IV, Fixed, 95% CI) | 0.0 [0.0, 0.0] | |
| 10.2 At maximal exercise at 3 months | 1 | Mean Difference (IV, Fixed, 95% CI) | 0.0 [0.0, 0.0] | |
| 10.3 At maximal exercise ‐ annual rate of change over 36 months | 1 | Mean Difference (IV, Fixed, 95% CI) | 0.0 [0.0, 0.0] | |
| 11 Change in oxygen saturation (%) Show forest plot | 2 | Mean Difference (IV, Fixed, 95% CI) | Totals not selected | |
| 11.1 During maximal exercise at hospital discharge | 1 | Mean Difference (IV, Fixed, 95% CI) | 0.0 [0.0, 0.0] | |
| 11.2 During maximal exercise at 3 months | 1 | Mean Difference (IV, Fixed, 95% CI) | 0.0 [0.0, 0.0] | |
| 11.3 At rest at 3 months | 1 | Mean Difference (IV, Fixed, 95% CI) | 0.0 [0.0, 0.0] | |
| 12 Annual rate of change in peak VE over 36 months (L/min) Show forest plot | 1 | Mean Difference (IV, Fixed, 95% CI) | Totals not selected | |
| 13 Change in FVC (% predicted) Show forest plot | 4 | Mean Difference (IV, Fixed, 95% CI) | Subtotals only | |
| 13.1 At hospital discharge | 1 | 44 | Mean Difference (IV, Fixed, 95% CI) | 0.06 [‐2.55, 2.67] |
| 13.2 At 3 months | 2 | 58 | Mean Difference (IV, Fixed, 95% CI) | 4.89 [0.69, 9.08] |
| 13.3 At 6 months | 1 | 25 | Mean Difference (IV, Fixed, 95% CI) | 12.51 [5.90, 19.12] |
| 13.4 At 1 month after discharge | 1 | 44 | Mean Difference (IV, Fixed, 95% CI) | ‐0.11 [‐2.64, 2.42] |
| 13.5 At 6 months off training | 1 | 23 | Mean Difference (IV, Fixed, 95% CI) | 15.09 [6.01, 24.17] |
| 13.6 At 18 months off training | 1 | 20 | Mean Difference (IV, Fixed, 95% CI) | 9.10 [‐0.94, 19.14] |
| 13.7 Annual rate of change over 36 months | 1 | 65 | Mean Difference (IV, Fixed, 95% CI) | 2.17 [0.47, 3.87] |
| 14 Change in FEF25‐75 (% predicted) Show forest plot | 2 | Mean Difference (IV, Fixed, 95% CI) | Totals not selected | |
| 14.1 Annual rate of change | 1 | Mean Difference (IV, Fixed, 95% CI) | 0.0 [0.0, 0.0] | |
| 14.2 At 3 months | 1 | Mean Difference (IV, Fixed, 95% CI) | 0.0 [0.0, 0.0] | |
| 15 Change in RV/TLC (%) Show forest plot | 1 | Mean Difference (IV, Fixed, 95% CI) | Totals not selected | |
| 15.1 At 3 months | 1 | Mean Difference (IV, Fixed, 95% CI) | 0.0 [0.0, 0.0] | |
| 15.2 At 6 months | 1 | Mean Difference (IV, Fixed, 95% CI) | 0.0 [0.0, 0.0] | |
| 15.3 At 6 months off training | 1 | Mean Difference (IV, Fixed, 95% CI) | 0.0 [0.0, 0.0] | |
| 15.4 At 18 months off training | 1 | Mean Difference (IV, Fixed, 95% CI) | 0.0 [0.0, 0.0] | |
| 16 Change in FEV1/FVC (% predicted) Show forest plot | 1 | Mean Difference (IV, Fixed, 95% CI) | Totals not selected | |
| 16.1 At 3 months | 1 | Mean Difference (IV, Fixed, 95% CI) | 0.0 [0.0, 0.0] | |
| 17 Change in total physical activity (counts per min) Show forest plot | 1 | Mean Difference (IV, Fixed, 95% CI) | Totals not selected | |
| 17.1 At 3 months | 1 | Mean Difference (IV, Fixed, 95% CI) | 0.0 [0.0, 0.0] | |
| 17.2 At 6 months | 1 | Mean Difference (IV, Fixed, 95% CI) | 0.0 [0.0, 0.0] | |
| 17.3 At 6 months off training | 1 | Mean Difference (IV, Fixed, 95% CI) | 0.0 [0.0, 0.0] | |
| 17.4 At 18 months off training | 1 | Mean Difference (IV, Fixed, 95% CI) | 0.0 [0.0, 0.0] | |
| 18 Change in moderate‐to‐vigorous physical activity (hours per week) Show forest plot | 1 | Mean Difference (IV, Fixed, 95% CI) | Totals not selected | |
| 18.1 At 3 months | 1 | Mean Difference (IV, Fixed, 95% CI) | 0.0 [0.0, 0.0] | |
| 18.2 At 6 months | 1 | Mean Difference (IV, Fixed, 95% CI) | 0.0 [0.0, 0.0] | |
| 18.3 At 6 months off training | 1 | Mean Difference (IV, Fixed, 95% CI) | 0.0 [0.0, 0.0] | |
| 18.4 At 18 months off training | 1 | Mean Difference (IV, Fixed, 95% CI) | 0.0 [0.0, 0.0] | |
| 19 Change in total physical activity (MJ/day) Show forest plot | 1 | Mean Difference (IV, Fixed, 95% CI) | Totals not selected | |
| 19.1 At hospital discharge | 1 | Mean Difference (IV, Fixed, 95% CI) | 0.0 [0.0, 0.0] | |
| 20 Change in body weight (kg) Show forest plot | 1 | Mean Difference (IV, Fixed, 95% CI) | Totals not selected | |
| 20.1 At hospital discharge | 1 | Mean Difference (IV, Fixed, 95% CI) | 0.0 [0.0, 0.0] | |
| 20.2 At 1 month after discharge | 1 | Mean Difference (IV, Fixed, 95% CI) | 0.0 [0.0, 0.0] | |
| 21 Change in BMI (kg/m2) Show forest plot | 1 | Mean Difference (IV, Fixed, 95% CI) | Totals not selected | |
| 21.1 At 3 months | 1 | Mean Difference (IV, Fixed, 95% CI) | 0.0 [0.0, 0.0] | |
| 21.2 At 6 months | 1 | Mean Difference (IV, Fixed, 95% CI) | 0.0 [0.0, 0.0] | |
| 21.3 At 6 months off training | 1 | Mean Difference (IV, Fixed, 95% CI) | 0.0 [0.0, 0.0] | |
| 21.4 At 18 months off training | 1 | Mean Difference (IV, Fixed, 95% CI) | 0.0 [0.0, 0.0] | |
| 22 Change in BMI z score Show forest plot | 1 | Mean Difference (IV, Fixed, 95% CI) | Totals not selected | |
| 22.1 At 3 months | 1 | Mean Difference (IV, Fixed, 95% CI) | 0.0 [0.0, 0.0] | |
| 23 Change in fat‐free mass (kg) Show forest plot | 2 | Mean Difference (IV, Fixed, 95% CI) | Totals not selected | |
| 23.1 At hospital discharge | 1 | Mean Difference (IV, Fixed, 95% CI) | 0.0 [0.0, 0.0] | |
| 23.2 At 3 months | 1 | Mean Difference (IV, Fixed, 95% CI) | 0.0 [0.0, 0.0] | |
| 23.3 At 6 months | 1 | Mean Difference (IV, Fixed, 95% CI) | 0.0 [0.0, 0.0] | |
| 23.4 At 1 month after discharge | 1 | Mean Difference (IV, Fixed, 95% CI) | 0.0 [0.0, 0.0] | |
| 23.5 At 6 months off training | 1 | Mean Difference (IV, Fixed, 95% CI) | 0.0 [0.0, 0.0] | |
| 23.6 At 18 months off training | 1 | Mean Difference (IV, Fixed, 95% CI) | 0.0 [0.0, 0.0] | |
| 24 Change in body fat (%) Show forest plot | 1 | Mean Difference (IV, Fixed, 95% CI) | Totals not selected | |
| 24.1 At 3 months | 1 | Mean Difference (IV, Fixed, 95% CI) | 0.0 [0.0, 0.0] | |
| 24.2 At 6 months | 1 | Mean Difference (IV, Fixed, 95% CI) | 0.0 [0.0, 0.0] | |
| 24.3 At 6 months off training | 1 | Mean Difference (IV, Fixed, 95% CI) | 0.0 [0.0, 0.0] | |
| 24.4 At 18 months off training | 1 | Mean Difference (IV, Fixed, 95% CI) | 0.0 [0.0, 0.0] | |
| 25 Annual rate of change of ideal weight for height (%) Show forest plot | 1 | Mean Difference (IV, Fixed, 95% CI) | Totals not selected | |
| 26 Change in triceps skinfold thickness (mm) Show forest plot | 1 | Mean Difference (IV, Fixed, 95% CI) | Totals not selected | |
| 26.1 At 3 months | 1 | Mean Difference (IV, Fixed, 95% CI) | 0.0 [0.0, 0.0] | |
| 27 Change in arm muscle circumference (cm) Show forest plot | 1 | Mean Difference (IV, Fixed, 95% CI) | Totals not selected | |
| 27.1 At 3 months | 1 | Mean Difference (IV, Fixed, 95% CI) | 0.0 [0.0, 0.0] | |
| Outcome or subgroup title | No. of studies | No. of participants | Statistical method | Effect size |
| 1 Change in VO2 peak during maximal exercise (ml/min per kg BW) Show forest plot | 3 | Mean Difference (IV, Fixed, 95% CI) | Subtotals only | |
| 1.1 At hospital discharge | 1 | 44 | Mean Difference (IV, Fixed, 95% CI) | 1.95 [‐1.61, 5.51] |
| 1.2 At 1 month after discharge | 1 | 44 | Mean Difference (IV, Fixed, 95% CI) | ‐0.40 [‐4.03, 3.23] |
| 1.3 At 3 months | 2 | 41 | Mean Difference (IV, Fixed, 95% CI) | 5.54 [‐0.25, 11.34] |
| 1.4 At 6 months | 1 | 18 | Mean Difference (IV, Fixed, 95% CI) | 17.7 [5.98, 29.42] |
| 1.5 At 6 months off training | 1 | 16 | Mean Difference (IV, Fixed, 95% CI) | 11.59 [‐1.02, 24.20] |
| 1.6 At 18 months off training | 1 | 15 | Mean Difference (IV, Fixed, 95% CI) | 9.26 [‐4.26, 22.78] |
| 2 Change in FEV1 (% predicted) Show forest plot | 2 | Mean Difference (IV, Fixed, 95% CI) | Totals not selected | |
| 2.1 At hospital discharge | 1 | Mean Difference (IV, Fixed, 95% CI) | 0.0 [0.0, 0.0] | |
| 2.2 At 1 month after discharge | 1 | Mean Difference (IV, Fixed, 95% CI) | 0.0 [0.0, 0.0] | |
| 2.3 At 3 months | 1 | Mean Difference (IV, Fixed, 95% CI) | 0.0 [0.0, 0.0] | |
| 2.4 At 6 months | 1 | Mean Difference (IV, Fixed, 95% CI) | 0.0 [0.0, 0.0] | |
| 2.5 At 6 months off training | 1 | Mean Difference (IV, Fixed, 95% CI) | 0.0 [0.0, 0.0] | |
| 2.6 At 18 months off training | 1 | Mean Difference (IV, Fixed, 95% CI) | 0.0 [0.0, 0.0] | |
| 3 Change in HRQoL Show forest plot | 1 | Mean Difference (IV, Fixed, 95% CI) | Totals not selected | |
| 3.1 1 month after discharge | 1 | Mean Difference (IV, Fixed, 95% CI) | 0.0 [0.0, 0.0] | |
| 4 Change in HRQoL physical function (CF questionnaire) Show forest plot | 1 | Mean Difference (IV, Fixed, 95% CI) | Totals not selected | |
| 4.1 At 3 months | 1 | Mean Difference (IV, Fixed, 95% CI) | 0.0 [0.0, 0.0] | |
| 5 Change in peak power during WAnT (W) Show forest plot | 1 | Mean Difference (IV, Fixed, 95% CI) | Totals not selected | |
| 5.1 At 3 months | 1 | Mean Difference (IV, Fixed, 95% CI) | 0.0 [0.0, 0.0] | |
| 6 Change in mean power during WAnT (W) Show forest plot | 1 | Mean Difference (IV, Fixed, 95% CI) | Totals not selected | |
| 6.1 At 3 months | 1 | Mean Difference (IV, Fixed, 95% CI) | 0.0 [0.0, 0.0] | |
| 7 Change in mean power during WAnT (W per kg BW) Show forest plot | 1 | Mean Difference (IV, Fixed, 95% CI) | Totals not selected | |
| 7.1 At 3 months | 1 | Mean Difference (IV, Fixed, 95% CI) | 0.0 [0.0, 0.0] | |
| 7.2 At 6 months | 1 | Mean Difference (IV, Fixed, 95% CI) | 0.0 [0.0, 0.0] | |
| 7.3 At 6 months off training | 1 | Mean Difference (IV, Fixed, 95% CI) | 0.0 [0.0, 0.0] | |
| 7.4 At 18 months off training | 1 | Mean Difference (IV, Fixed, 95% CI) | 0.0 [0.0, 0.0] | |
| 8 Change in lower limb strength (Newton metres) Show forest plot | 1 | Mean Difference (IV, Fixed, 95% CI) | Totals not selected | |
| 8.1 At hospital discharge | 1 | Mean Difference (IV, Fixed, 95% CI) | 0.0 [0.0, 0.0] | |
| 8.2 At 1 month after discharge | 1 | Mean Difference (IV, Fixed, 95% CI) | 0.0 [0.0, 0.0] | |
| 9 Change in peak work capacity during maximal exercise (W) Show forest plot | 1 | Mean Difference (IV, Fixed, 95% CI) | Totals not selected | |
| 9.1 At 3 months | 1 | Mean Difference (IV, Fixed, 95% CI) | 0.0 [0.0, 0.0] | |
| 10 Change in peak work capacity during maximal exercise (W per kg body weight) Show forest plot | 1 | Mean Difference (IV, Fixed, 95% CI) | Totals not selected | |
| 10.1 At 3 months | 1 | Mean Difference (IV, Fixed, 95% CI) | 0.0 [0.0, 0.0] | |
| 10.2 At 6 months | 1 | Mean Difference (IV, Fixed, 95% CI) | 0.0 [0.0, 0.0] | |
| 10.3 At 6 months off training | 1 | Mean Difference (IV, Fixed, 95% CI) | 0.0 [0.0, 0.0] | |
| 10.4 At 18 months off training | 1 | Mean Difference (IV, Fixed, 95% CI) | 0.0 [0.0, 0.0] | |
| 11 Change in lactate during maximal exercise (mmol/L) Show forest plot | 1 | Mean Difference (IV, Fixed, 95% CI) | Totals not selected | |
| 11.1 At 3 months | 1 | Mean Difference (IV, Fixed, 95% CI) | 0.0 [0.0, 0.0] | |
| 12 Change in peak oxygen saturation during maximal exercise (%) Show forest plot | 1 | Mean Difference (IV, Fixed, 95% CI) | Totals not selected | |
| 12.1 At hospital discharge | 1 | Mean Difference (IV, Fixed, 95% CI) | 0.0 [0.0, 0.0] | |
| 13 Change in FVC (% predicted) Show forest plot | 2 | Mean Difference (IV, Fixed, 95% CI) | Totals not selected | |
| 13.1 At hospital discharge | 1 | Mean Difference (IV, Fixed, 95% CI) | 0.0 [0.0, 0.0] | |
| 13.2 At 3 months | 1 | Mean Difference (IV, Fixed, 95% CI) | 0.0 [0.0, 0.0] | |
| 13.3 At 6 months | 1 | Mean Difference (IV, Fixed, 95% CI) | 0.0 [0.0, 0.0] | |
| 13.4 At 1 month after discharge | 1 | Mean Difference (IV, Fixed, 95% CI) | 0.0 [0.0, 0.0] | |
| 13.5 At 6 months off training | 1 | Mean Difference (IV, Fixed, 95% CI) | 0.0 [0.0, 0.0] | |
| 13.6 At 18 months off training | 1 | Mean Difference (IV, Fixed, 95% CI) | 0.0 [0.0, 0.0] | |
| 14 Change in RV/TLC (%) Show forest plot | 1 | Mean Difference (IV, Fixed, 95% CI) | Totals not selected | |
| 14.1 At 3 months | 1 | Mean Difference (IV, Fixed, 95% CI) | 0.0 [0.0, 0.0] | |
| 14.2 At 6 months | 1 | Mean Difference (IV, Fixed, 95% CI) | 0.0 [0.0, 0.0] | |
| 14.3 At 6 months off training | 1 | Mean Difference (IV, Fixed, 95% CI) | 0.0 [0.0, 0.0] | |
| 14.4 At 18 months off training | 1 | Mean Difference (IV, Fixed, 95% CI) | 0.0 [0.0, 0.0] | |
| 15 Change in total physical activity (counts per min) Show forest plot | 1 | Mean Difference (IV, Fixed, 95% CI) | Totals not selected | |
| 15.1 At 3 months | 1 | Mean Difference (IV, Fixed, 95% CI) | 0.0 [0.0, 0.0] | |
| 15.2 At 6 months | 1 | Mean Difference (IV, Fixed, 95% CI) | 0.0 [0.0, 0.0] | |
| 15.3 At 6 months off training | 1 | Mean Difference (IV, Fixed, 95% CI) | 0.0 [0.0, 0.0] | |
| 15.4 At 18 months off training | 1 | Mean Difference (IV, Fixed, 95% CI) | 0.0 [0.0, 0.0] | |
| 16 Change in moderate to vigorous physical activity (hours per week) Show forest plot | 1 | Mean Difference (IV, Fixed, 95% CI) | Totals not selected | |
| 16.1 At 3 months | 1 | Mean Difference (IV, Fixed, 95% CI) | 0.0 [0.0, 0.0] | |
| 16.2 At 6 months | 1 | Mean Difference (IV, Fixed, 95% CI) | 0.0 [0.0, 0.0] | |
| 16.3 At 6 months off training | 1 | Mean Difference (IV, Fixed, 95% CI) | 0.0 [0.0, 0.0] | |
| 16.4 At 18 months off training | 1 | Mean Difference (IV, Fixed, 95% CI) | 0.0 [0.0, 0.0] | |
| 17 Change in physical activity (MJ/day) Show forest plot | 1 | Mean Difference (IV, Fixed, 95% CI) | Totals not selected | |
| 17.1 At hospital discharge | 1 | Mean Difference (IV, Fixed, 95% CI) | 0.0 [0.0, 0.0] | |
| 18 Change in weight (kg) Show forest plot | 1 | Mean Difference (IV, Fixed, 95% CI) | Totals not selected | |
| 18.1 At hospital discharge | 1 | Mean Difference (IV, Fixed, 95% CI) | 0.0 [0.0, 0.0] | |
| 18.2 At 1 month after discharge | 1 | Mean Difference (IV, Fixed, 95% CI) | 0.0 [0.0, 0.0] | |
| 19 Change in BMI (kg/m2) Show forest plot | 1 | Mean Difference (IV, Fixed, 95% CI) | Totals not selected | |
| 19.1 At 3 months | 1 | Mean Difference (IV, Fixed, 95% CI) | 0.0 [0.0, 0.0] | |
| 19.2 At 6 months | 1 | Mean Difference (IV, Fixed, 95% CI) | 0.0 [0.0, 0.0] | |
| 19.3 At 6 months off training | 1 | Mean Difference (IV, Fixed, 95% CI) | 0.0 [0.0, 0.0] | |
| 19.4 At 18 months off training | 1 | Mean Difference (IV, Fixed, 95% CI) | 0.0 [0.0, 0.0] | |
| 20 Change in fat‐free mass (kg) Show forest plot | 2 | Mean Difference (IV, Fixed, 95% CI) | Totals not selected | |
| 20.1 At hospital discharge | 1 | Mean Difference (IV, Fixed, 95% CI) | 0.0 [0.0, 0.0] | |
| 20.2 At 3 months | 1 | Mean Difference (IV, Fixed, 95% CI) | 0.0 [0.0, 0.0] | |
| 20.3 At 6 months | 1 | Mean Difference (IV, Fixed, 95% CI) | 0.0 [0.0, 0.0] | |
| 20.4 At 1 month after discharge | 1 | Mean Difference (IV, Fixed, 95% CI) | 0.0 [0.0, 0.0] | |
| 20.5 At 6 months off training | 1 | Mean Difference (IV, Fixed, 95% CI) | 0.0 [0.0, 0.0] | |
| 20.6 At 18 months off training | 1 | Mean Difference (IV, Fixed, 95% CI) | 0.0 [0.0, 0.0] | |
| 21 Change in body fat (%) Show forest plot | 1 | Mean Difference (IV, Fixed, 95% CI) | Totals not selected | |
| 21.1 At 3 months | 1 | Mean Difference (IV, Fixed, 95% CI) | 0.0 [0.0, 0.0] | |
| 21.2 At 6 months | 1 | Mean Difference (IV, Fixed, 95% CI) | 0.0 [0.0, 0.0] | |
| 21.3 At 6 months off training | 1 | Mean Difference (IV, Fixed, 95% CI) | 0.0 [0.0, 0.0] | |
| 21.4 At 18 months off training | 1 | Mean Difference (IV, Fixed, 95% CI) | 0.0 [0.0, 0.0] | |
| Outcome or subgroup title | No. of studies | No. of participants | Statistical method | Effect size |
| 1 Change in VO2 peak during maximal exercise (ml/min per kg BW) Show forest plot | 2 | Mean Difference (Fixed, 95% CI) | Totals not selected | |
| 1.1 At 12 weeks | 1 | Mean Difference (Fixed, 95% CI) | 0.0 [0.0, 0.0] | |
| 1.2 At 3 ‐ 6 months | 1 | Mean Difference (Fixed, 95% CI) | 0.0 [0.0, 0.0] | |
| 1.3 At 6 months off training | 1 | Mean Difference (Fixed, 95% CI) | 0.0 [0.0, 0.0] | |
| 1.4 At 12 ‐ 18 months off training | 1 | Mean Difference (Fixed, 95% CI) | 0.0 [0.0, 0.0] | |
| 2 Change in FEV1 (% predicted) Show forest plot | 3 | Mean Difference (IV, Fixed, 95% CI) | Totals not selected | |
| 2.1 At 12 weeks | 1 | Mean Difference (IV, Fixed, 95% CI) | 0.0 [0.0, 0.0] | |
| 2.2 At 3 months | 1 | Mean Difference (IV, Fixed, 95% CI) | 0.0 [0.0, 0.0] | |
| 2.3 At 3 ‐ 6 months | 1 | Mean Difference (IV, Fixed, 95% CI) | 0.0 [0.0, 0.0] | |
| 2.4 At 6 months off training | 1 | Mean Difference (IV, Fixed, 95% CI) | 0.0 [0.0, 0.0] | |
| 2.5 At 12 ‐ 18 months off training | 1 | Mean Difference (IV, Fixed, 95% CI) | 0.0 [0.0, 0.0] | |
| 3 Annual change in FEV1 (mL) Show forest plot | 1 | Mean Difference (Fixed, 95% CI) | Totals not selected | |
| 3.1 At 12 months | 1 | Mean Difference (Fixed, 95% CI) | 0.0 [0.0, 0.0] | |
| 4 Change in subjective health perception (CFQ‐R) Show forest plot | 1 | Mean Difference (Fixed, 95% CI) | Totals not selected | |
| 4.1 At 3 ‐ 6 months | 1 | Mean Difference (Fixed, 95% CI) | 0.0 [0.0, 0.0] | |
| 4.2 At 6 months off training | 1 | Mean Difference (Fixed, 95% CI) | 0.0 [0.0, 0.0] | |
| 4.3 At 12 ‐ 18 months off training | 1 | Mean Difference (Fixed, 95% CI) | 0.0 [0.0, 0.0] | |
| 5 Change in Quality of Life: CFQ‐R Show forest plot | 1 | Mean Difference (IV, Fixed, 95% CI) | Totals not selected | |
| 5.1 Physical Functioning at 12 weeks | 1 | Mean Difference (IV, Fixed, 95% CI) | 0.0 [0.0, 0.0] | |
| 5.2 Vitality at 12 weeks | 1 | Mean Difference (IV, Fixed, 95% CI) | 0.0 [0.0, 0.0] | |
| 5.3 Emotional state at 12 weeks | 1 | Mean Difference (IV, Fixed, 95% CI) | 0.0 [0.0, 0.0] | |
| 5.4 Eating disturbances at 12 weeks | 1 | Mean Difference (IV, Fixed, 95% CI) | 0.0 [0.0, 0.0] | |
| 5.5 Treatment burden at 12 weeks | 1 | Mean Difference (IV, Fixed, 95% CI) | 0.0 [0.0, 0.0] | |
| 5.6 Health perception at 12 weeks | 1 | Mean Difference (IV, Fixed, 95% CI) | 0.0 [0.0, 0.0] | |
| 5.7 Social limitations at 12 weeks | 1 | Mean Difference (IV, Fixed, 95% CI) | 0.0 [0.0, 0.0] | |
| 5.8 Body image at 12 weeks | 1 | Mean Difference (IV, Fixed, 95% CI) | 0.0 [0.0, 0.0] | |
| 5.9 Role limitations at 12 weeks | 1 | Mean Difference (IV, Fixed, 95% CI) | 0.0 [0.0, 0.0] | |
| 5.10 Weight problems at 12 weeks | 1 | Mean Difference (IV, Fixed, 95% CI) | 0.0 [0.0, 0.0] | |
| 5.11 Respiratory symptoms at 12 weeks | 1 | Mean Difference (IV, Fixed, 95% CI) | 0.0 [0.0, 0.0] | |
| 5.12 Digestion symptoms at 12 weeks | 1 | Mean Difference (IV, Fixed, 95% CI) | 0.0 [0.0, 0.0] | |
| 6 Change in peak power during WAnT (W per kg body weight) Show forest plot | 1 | Mean Difference (IV, Fixed, 95% CI) | Totals not selected | |
| 6.1 At 3 ‐ 6 months | 1 | Mean Difference (IV, Fixed, 95% CI) | 0.0 [0.0, 0.0] | |
| 6.2 At 6 months off training | 1 | Mean Difference (IV, Fixed, 95% CI) | 0.0 [0.0, 0.0] | |
| 6.3 At 12 ‐ 18 months off training | 1 | Mean Difference (IV, Fixed, 95% CI) | 0.0 [0.0, 0.0] | |
| 7 Change in mean power during WAnT (W per kg body weight) Show forest plot | 1 | Mean Difference (IV, Fixed, 95% CI) | Totals not selected | |
| 7.1 At 3 ‐ 6 months | 1 | Mean Difference (IV, Fixed, 95% CI) | 0.0 [0.0, 0.0] | |
| 7.2 At 6 months off training | 1 | Mean Difference (IV, Fixed, 95% CI) | 0.0 [0.0, 0.0] | |
| 7.3 At 12 ‐ 18 months off training | 1 | Mean Difference (IV, Fixed, 95% CI) | 0.0 [0.0, 0.0] | |
| 8 Change in muscle strength (all limbs) (1RM test) Show forest plot | 1 | Mean Difference (IV, Fixed, 95% CI) | Totals not selected | |
| 8.1 Right upper limb at 3 months | 1 | Mean Difference (IV, Fixed, 95% CI) | 0.0 [0.0, 0.0] | |
| 8.2 Left upper limb at 3 months | 1 | Mean Difference (IV, Fixed, 95% CI) | 0.0 [0.0, 0.0] | |
| 8.3 Right lower limb at 3 months | 1 | Mean Difference (IV, Fixed, 95% CI) | 0.0 [0.0, 0.0] | |
| 8.4 Left lower limb at 3 months | 1 | Mean Difference (IV, Fixed, 95% CI) | 0.0 [0.0, 0.0] | |
| 9 Change in muscular strength ‐ leg press (kg; 1 RM test) Show forest plot | 1 | Mean Difference (IV, Fixed, 95% CI) | Totals not selected | |
| 9.1 At 12 weeks | 1 | Mean Difference (IV, Fixed, 95% CI) | 0.0 [0.0, 0.0] | |
| 10 Change in Muscular Strength ‐ Chest press (kg; 1 RM test) Show forest plot | 1 | Mean Difference (IV, Fixed, 95% CI) | Totals not selected | |
| 10.1 At 12 weeks | 1 | Mean Difference (IV, Fixed, 95% CI) | 0.0 [0.0, 0.0] | |
| 11 Change in Muscular Strength ‐ Latpull down (kg; 1 RM test) Show forest plot | 1 | Mean Difference (IV, Fixed, 95% CI) | Totals not selected | |
| 11.1 At 12 weeks | 1 | Mean Difference (IV, Fixed, 95% CI) | 0.0 [0.0, 0.0] | |
| 12 Change in Muscular Strength ‐ Biceps curl (kg; RM test) Show forest plot | 1 | Mean Difference (IV, Fixed, 95% CI) | Totals not selected | |
| 12.1 At 12 weeks | 1 | Mean Difference (IV, Fixed, 95% CI) | 0.0 [0.0, 0.0] | |
| 13 Change in Muscular Endurance ‐ Number of push ups Show forest plot | 1 | Mean Difference (IV, Fixed, 95% CI) | Totals not selected | |
| 13.1 At 12 weeks | 1 | Mean Difference (IV, Fixed, 95% CI) | 0.0 [0.0, 0.0] | |
| 14 Change in Muscular Endurance ‐ Number of sit ups Show forest plot | 1 | Mean Difference (IV, Fixed, 95% CI) | Totals not selected | |
| 14.1 At 12 weeks | 1 | Mean Difference (IV, Fixed, 95% CI) | 0.0 [0.0, 0.0] | |
| 15 Change in Muscular Endurance ‐ Flexibility (cm) Show forest plot | 1 | Mean Difference (IV, Fixed, 95% CI) | Totals not selected | |
| 15.1 At 12 weeks | 1 | Mean Difference (IV, Fixed, 95% CI) | 0.0 [0.0, 0.0] | |
| 16 Change in Muscular Endurance ‐ hand grip strength (kg) Show forest plot | 1 | Mean Difference (IV, Fixed, 95% CI) | Totals not selected | |
| 16.1 At 12 weeks | 1 | Mean Difference (IV, Fixed, 95% CI) | 0.0 [0.0, 0.0] | |
| 17 Change in peak work capacity during maximal exercise (W per kg BW) Show forest plot | 1 | Mean Difference (Fixed, 95% CI) | Totals not selected | |
| 17.1 At 3 ‐ 6 months | 1 | Mean Difference (Fixed, 95% CI) | 0.0 [0.0, 0.0] | |
| 17.2 At 6 months off training | 1 | Mean Difference (Fixed, 95% CI) | 0.0 [0.0, 0.0] | |
| 17.3 At 12 ‐ 18 months off training | 1 | Mean Difference (Fixed, 95% CI) | 0.0 [0.0, 0.0] | |
| 18 Change in functional exercise capacity Show forest plot | 1 | Mean Difference (IV, Fixed, 95% CI) | Totals not selected | |
| 18.1 6MWT distance (m) at 3 months | 1 | Mean Difference (IV, Fixed, 95% CI) | 0.0 [0.0, 0.0] | |
| 18.2 6MWT distance (% predicted) at 3 months | 1 | Mean Difference (IV, Fixed, 95% CI) | 0.0 [0.0, 0.0] | |
| 19 Change in peak heart rate during 6MWT (beats/min) Show forest plot | 1 | Mean Difference (IV, Fixed, 95% CI) | Totals not selected | |
| 19.1 At 3 months | 1 | Mean Difference (IV, Fixed, 95% CI) | 0.0 [0.0, 0.0] | |
| 20 Annual change in peak heart rate (beat/min) Show forest plot | 1 | Mean Difference (Fixed, 95% CI) | Totals not selected | |
| 20.1 Constant load bicycle ergometry (at 1 year) | 1 | Mean Difference (Fixed, 95% CI) | 0.0 [0.0, 0.0] | |
| 20.2 Constant load arm ergometry (at 1 year) | 1 | Mean Difference (Fixed, 95% CI) | 0.0 [0.0, 0.0] | |
| 21 Annual change in VE (L/min) Show forest plot | 1 | Mean Difference (Fixed, 95% CI) | Totals not selected | |
| 21.1 Constant load bicycle ergometry (at 1 year) | 1 | Mean Difference (Fixed, 95% CI) | 0.0 [0.0, 0.0] | |
| 21.2 Constant load arm ergometry (at 1 year) | 1 | Mean Difference (Fixed, 95% CI) | 0.0 [0.0, 0.0] | |
| 22 Change in peak ventilation (VE) during maximal exercise Show forest plot | 1 | Mean Difference (IV, Fixed, 95% CI) | Totals not selected | |
| 22.1 At 12 weeks | 1 | Mean Difference (IV, Fixed, 95% CI) | 0.0 [0.0, 0.0] | |
| 23 Annual change in lactate (mmol/l) Show forest plot | 1 | Mean Difference (Fixed, 95% CI) | Totals not selected | |
| 23.1 Constant load bicycle ergometry (at 1 year) | 1 | Mean Difference (Fixed, 95% CI) | 0.0 [0.0, 0.0] | |
| 23.2 Constant load arm ergometry (at 1 year) | 1 | Mean Difference (Fixed, 95% CI) | 0.0 [0.0, 0.0] | |
| 24 Change in RR during 6MWT (breaths/min) Show forest plot | 1 | Mean Difference (IV, Fixed, 95% CI) | Totals not selected | |
| 24.1 At 3 months | 1 | Mean Difference (IV, Fixed, 95% CI) | 0.0 [0.0, 0.0] | |
| 25 Annual change in RR (breaths/min) Show forest plot | 1 | Mean Difference (Fixed, 95% CI) | Totals not selected | |
| 25.1 Constant load bicycle ergometry (at 1 year) | 1 | Mean Difference (Fixed, 95% CI) | 0.0 [0.0, 0.0] | |
| 25.2 Constant load arm ergometry (at 1 year) | 1 | Mean Difference (Fixed, 95% CI) | 0.0 [0.0, 0.0] | |
| 26 Annual change in RER Show forest plot | 1 | Mean Difference (Fixed, 95% CI) | Totals not selected | |
| 26.1 Constant load bicycle ergometry (at 1 year) | 1 | Mean Difference (Fixed, 95% CI) | 0.0 [0.0, 0.0] | |
| 26.2 Constant load arm ergometry (at 1 year) | 1 | Mean Difference (Fixed, 95% CI) | 0.0 [0.0, 0.0] | |
| 27 Change in oxygen saturation (%) Show forest plot | 1 | Mean Difference (IV, Fixed, 95% CI) | Totals not selected | |
| 27.1 At rest (at 3 months) | 1 | Mean Difference (IV, Fixed, 95% CI) | 0.0 [0.0, 0.0] | |
| 27.2 During 6MWT (at 3 months) | 1 | Mean Difference (IV, Fixed, 95% CI) | 0.0 [0.0, 0.0] | |
| 28 Change in Borg breathlessness score Show forest plot | 1 | Mean Difference (IV, Fixed, 95% CI) | Totals not selected | |
| 28.1 At rest (at 3 months) | 1 | Mean Difference (IV, Fixed, 95% CI) | 0.0 [0.0, 0.0] | |
| 28.2 During 6MWT (at 3 months) | 1 | Mean Difference (IV, Fixed, 95% CI) | 0.0 [0.0, 0.0] | |
| 29 Annual change in Borg breathlessness score Show forest plot | 1 | Mean Difference (Fixed, 95% CI) | Totals not selected | |
| 29.1 Constant load bicycle ergometry (at 1 year) | 1 | Mean Difference (Fixed, 95% CI) | 0.0 [0.0, 0.0] | |
| 29.2 Constant load arm ergometry (at 1 year) | 1 | Mean Difference (Fixed, 95% CI) | 0.0 [0.0, 0.0] | |
| 30 Change in Borg fatigue score Show forest plot | 1 | Mean Difference (IV, Fixed, 95% CI) | Totals not selected | |
| 30.1 At rest (at 3 months) | 1 | Mean Difference (IV, Fixed, 95% CI) | 0.0 [0.0, 0.0] | |
| 30.2 During 6MWT (at 3 months) | 1 | Mean Difference (IV, Fixed, 95% CI) | 0.0 [0.0, 0.0] | |
| 31 Annual change in Borg muscle effort Show forest plot | 1 | Mean Difference (Fixed, 95% CI) | Totals not selected | |
| 31.1 Constant load bicycle ergometry (at 1 year) | 1 | Mean Difference (Fixed, 95% CI) | 0.0 [0.0, 0.0] | |
| 31.2 Constant load arm ergometry (at 1 year) | 1 | Mean Difference (Fixed, 95% CI) | 0.0 [0.0, 0.0] | |
| 32 Change in FVC (% predicted) Show forest plot | 3 | Mean Difference (Fixed, 95% CI) | Totals not selected | |
| 32.1 At 12 weeks | 1 | Mean Difference (Fixed, 95% CI) | 0.0 [0.0, 0.0] | |
| 32.2 At 3 months | 1 | Mean Difference (Fixed, 95% CI) | 0.0 [0.0, 0.0] | |
| 32.3 At 3 ‐ 6 months | 1 | Mean Difference (Fixed, 95% CI) | 0.0 [0.0, 0.0] | |
| 32.4 At 6 months off training | 1 | Mean Difference (Fixed, 95% CI) | 0.0 [0.0, 0.0] | |
| 32.5 At 12 ‐ 18 months off training | 1 | Mean Difference (Fixed, 95% CI) | 0.0 [0.0, 0.0] | |
| 33 Annual change in FVC (mL) Show forest plot | 1 | Mean Difference (Fixed, 95% CI) | Totals not selected | |
| 33.1 At 1 year | 1 | Mean Difference (Fixed, 95% CI) | 0.0 [0.0, 0.0] | |
| 34 Change in RV/TLC (%) Show forest plot | 1 | Mean Difference (IV, Fixed, 95% CI) | Totals not selected | |
| 34.1 At 3 ‐ 6 months | 1 | Mean Difference (IV, Fixed, 95% CI) | 0.0 [0.0, 0.0] | |
| 34.2 At 6 months off training | 1 | Mean Difference (IV, Fixed, 95% CI) | 0.0 [0.0, 0.0] | |
| 34.3 At 12 ‐ 18 months off training | 1 | Mean Difference (IV, Fixed, 95% CI) | 0.0 [0.0, 0.0] | |
| 35 Change in Total Energy Expenditure (k/cal) Show forest plot | 1 | Mean Difference (IV, Fixed, 95% CI) | Totals not selected | |
| 35.1 At 12 weeks | 1 | Mean Difference (IV, Fixed, 95% CI) | 0.0 [0.0, 0.0] | |
| 36 Change in the Number of Steps Show forest plot | 1 | Mean Difference (IV, Fixed, 95% CI) | Totals not selected | |
| 36.1 At 12 weeks | 1 | Mean Difference (IV, Fixed, 95% CI) | 0.0 [0.0, 0.0] | |
| 37 Change in Physical Activity (%) Show forest plot | 1 | Mean Difference (IV, Fixed, 95% CI) | Totals not selected | |
| 37.1 At 12 weeks | 1 | Mean Difference (IV, Fixed, 95% CI) | 0.0 [0.0, 0.0] | |
| 38 Change in vigorous physical activity (hours per week) Show forest plot | 1 | Mean Difference (Fixed, 95% CI) | Totals not selected | |
| 38.1 At 3 ‐ 6 months | 1 | Mean Difference (Fixed, 95% CI) | 0.0 [0.0, 0.0] | |
| 38.2 At 6 months off training | 1 | Mean Difference (Fixed, 95% CI) | 0.0 [0.0, 0.0] | |
| 38.3 At 12 ‐ 18 months off training | 1 | Mean Difference (Fixed, 95% CI) | 0.0 [0.0, 0.0] | |
| 39 Change in body weight (kg) Show forest plot | 2 | Mean Difference (IV, Fixed, 95% CI) | Totals not selected | |
| 39.1 At 12 weeks | 1 | Mean Difference (IV, Fixed, 95% CI) | 0.0 [0.0, 0.0] | |
| 39.2 At 3 ‐ 6 months | 1 | Mean Difference (IV, Fixed, 95% CI) | 0.0 [0.0, 0.0] | |
| 39.3 At 6 months off training | 1 | Mean Difference (IV, Fixed, 95% CI) | 0.0 [0.0, 0.0] | |
| 39.4 At 12 ‐ 18 months off training | 1 | Mean Difference (IV, Fixed, 95% CI) | 0.0 [0.0, 0.0] | |
| 40 Change in BMI (kg/m2) Show forest plot | 3 | Mean Difference (Fixed, 95% CI) | Totals not selected | |
| 40.1 At 12 weeks | 1 | Mean Difference (Fixed, 95% CI) | 0.0 [0.0, 0.0] | |
| 40.2 At 3 ‐ 6 months | 1 | Mean Difference (Fixed, 95% CI) | 0.0 [0.0, 0.0] | |
| 40.3 Annual change | 1 | Mean Difference (Fixed, 95% CI) | 0.0 [0.0, 0.0] | |
| 40.4 At 6 months off training | 1 | Mean Difference (Fixed, 95% CI) | 0.0 [0.0, 0.0] | |
| 40.5 At 12 ‐ 18 months off training | 1 | Mean Difference (Fixed, 95% CI) | 0.0 [0.0, 0.0] | |
| 41 Change in sum of four skinfolds (mm) Show forest plot | 1 | Mean Difference (Fixed, 95% CI) | Totals not selected | |
| 41.1 At 3‐6 months | 1 | Mean Difference (Fixed, 95% CI) | 0.0 [0.0, 0.0] | |
| 41.2 At 6 months off training | 1 | Mean Difference (Fixed, 95% CI) | 0.0 [0.0, 0.0] | |
| 41.3 At 12‐18 months off training | 1 | Mean Difference (Fixed, 95% CI) | 0.0 [0.0, 0.0] | |
| 42 Change in body fat (%) Show forest plot | 2 | Mean Difference (Fixed, 95% CI) | Totals not selected | |
| 42.1 At 12 weeks | 1 | Mean Difference (Fixed, 95% CI) | 0.0 [0.0, 0.0] | |
| 42.2 At 3 ‐ 6 months | 1 | Mean Difference (Fixed, 95% CI) | 0.0 [0.0, 0.0] | |
| 42.3 At 6 months off training | 1 | Mean Difference (Fixed, 95% CI) | 0.0 [0.0, 0.0] | |
| 42.4 At 12 ‐ 18 months off training | 1 | Mean Difference (Fixed, 95% CI) | 0.0 [0.0, 0.0] | |
| 43 Change in fat‐mass (kg) Show forest plot | 1 | Mean Difference (IV, Fixed, 95% CI) | Totals not selected | |
| 43.1 At 12 weeks | 1 | Mean Difference (IV, Fixed, 95% CI) | 0.0 [0.0, 0.0] | |
| 44 Change in fat‐free mass (kg) Show forest plot | 2 | Mean Difference (IV, Fixed, 95% CI) | Totals not selected | |
| 44.1 At 12 weeks | 1 | Mean Difference (IV, Fixed, 95% CI) | 0.0 [0.0, 0.0] | |
| 44.2 At 3 ‐ 6 months | 1 | Mean Difference (IV, Fixed, 95% CI) | 0.0 [0.0, 0.0] | |
| 44.3 At 6 months off training | 1 | Mean Difference (IV, Fixed, 95% CI) | 0.0 [0.0, 0.0] | |
| 44.4 At 12 ‐ 18 months off training | 1 | Mean Difference (IV, Fixed, 95% CI) | 0.0 [0.0, 0.0] | |
| 45 Change in metabolic parameters (HbA1c (%)) Show forest plot | 1 | Mean Difference (IV, Fixed, 95% CI) | Totals not selected | |
| 45.1 At 12 weeks | 1 | Mean Difference (IV, Fixed, 95% CI) | 0.0 [0.0, 0.0] | |
| 46 Change in metabolic parameters (Glucose AUC) Show forest plot | 1 | Mean Difference (IV, Fixed, 95% CI) | Totals not selected | |
| 46.1 At 12 weeks | 1 | Mean Difference (IV, Fixed, 95% CI) | 0.0 [0.0, 0.0] | |
| 47 Change in metabolic parameters (Total Insulin AUC) Show forest plot | 1 | Mean Difference (IV, Fixed, 95% CI) | Totals not selected | |
| 47.1 At 12 weeks | 1 | Mean Difference (IV, Fixed, 95% CI) | 0.0 [0.0, 0.0] | |
| 48 Change in metabolic parameters (Insulin Sensitivity Index) Show forest plot | 1 | Mean Difference (IV, Fixed, 95% CI) | Totals not selected | |
| 48.1 At 12 weeks | 1 | Mean Difference (IV, Fixed, 95% CI) | 0.0 [0.0, 0.0] | |
| 49 Change in Plasma Glucose (mmol/L) Show forest plot | 1 | Mean Difference (IV, Fixed, 95% CI) | Totals not selected | |
| 49.1 After 0 minutes | 1 | Mean Difference (IV, Fixed, 95% CI) | 0.0 [0.0, 0.0] | |
| 49.2 After 30 minutes | 1 | Mean Difference (IV, Fixed, 95% CI) | 0.0 [0.0, 0.0] | |
| 49.3 After 60 minutes | 1 | Mean Difference (IV, Fixed, 95% CI) | 0.0 [0.0, 0.0] | |
| 49.4 After 90 minutes | 1 | Mean Difference (IV, Fixed, 95% CI) | 0.0 [0.0, 0.0] | |
| 49.5 After 120 minutes | 1 | Mean Difference (IV, Fixed, 95% CI) | 0.0 [0.0, 0.0] | |
| 50 Change in Plasma Insulin (µU/mL) Show forest plot | 1 | Mean Difference (IV, Fixed, 95% CI) | Totals not selected | |
| 50.1 After 0 minutes | 1 | Mean Difference (IV, Fixed, 95% CI) | 0.0 [0.0, 0.0] | |
| 50.2 After 30 minutes | 1 | Mean Difference (IV, Fixed, 95% CI) | 0.0 [0.0, 0.0] | |
| 50.3 After 60 minutes | 1 | Mean Difference (IV, Fixed, 95% CI) | 0.0 [0.0, 0.0] | |
| 50.4 After 90 minutes | 1 | Mean Difference (IV, Fixed, 95% CI) | 0.0 [0.0, 0.0] | |
| 50.5 After 120 minutes | 1 | Mean Difference (IV, Fixed, 95% CI) | 0.0 [0.0, 0.0] | |