Entrenamiento físico para la fibrosis quística
Información
- DOI:
- https://doi.org/10.1002/14651858.CD002768.pub4Copiar DOI

- Base de datos:
-
- Cochrane Database of Systematic Reviews
- Versión publicada:
-
- 01 noviembre 2017see what's new
- Tipo:
-
- Intervention
- Etapa:
-
- Review
- Grupo Editorial Cochrane:
-
Grupo Cochrane de Fibrosis quística y enfermedades genéticas
- Copyright:
-
- Copyright © 2017 The Cochrane Collaboration. Published by John Wiley & Sons, Ltd.
Cifras del artículo
Altmetric:
Citado por:
Autores
Contributions of authors
The title for the protocol was conceived by the Cochrane Cystic Fibrosis and Genetic Disorders Group.
Both Judy Bradley and Fidelma Moran designed and assisted in writing the protocol and produced the earlier versions of the full review. For updates from 2015, Thomas Radtke and Susi Kriemler were responsible for acquisition of data, analysis and interpretation of data, drafting and critical revision of the manuscript. Sarah Nolan provided statistical support for the 2015 update. All authors provided intellectual input, critically reviewed the manuscript and approved the final version of this updated review.
Thomas Radtke acts as guarantor for this review.
Sources of support
Internal sources
-
No sources of support supplied
External sources
-
National Institute for Health Research, UK.
This systematic review was supported by the National Institute for Health Research, via Cochrane infrastructure funding to the Cochrane Cystic Fibrosis and Genetic Disorders Group.
Declarations of interest
HH has received financial compensation for travel and accomodation or free meeting participation (or both) at the European Cystic Fibrosis Society conference and the North American Cystic Fibrosis Conference for chairing or presenting at sessions focusing on exercise in cystic fibrosis. For writing an educational booklet on exercise in cystic fibrosis, HH has received money from Novartis. HH is also the lead investigator on one of the studies included in the review (Hebestreit 2010). As he is the lead investigator of the international multicentre trial ACTIVATE‐CF (Hebestreit 2016), his institution has received grants from the Mukoviszidose e.V. and a Vertex Innovation Award.
TR belongs to the core study team of the ACTIVATE‐CF trial (Hebestreit 2016). TR has also received financial compensation for chairing and presenting at exercise sessions at the European Cystic Fibrosis Society conference. He has also received financial support (travel, accomodation) from Vifor Pharma Switzerland to participate at the European Cystic Fibrosis Society and European Respiratory Society conference.
SK is the lead investigator on one of the studies included in the review (Kriemler 2013) and also belongs to the core study team of the ACTIVATE‐CF trial (Hebestreit 2016)
SJN declares no known potential conflicts of interest.
Acknowledgements
We would like to thank Dr Judy Bradley and Dr Fidelma Moran, who have stepped down at the 2015 update, for their previous contributions to the review which are detailed below.
We would like to kindly thank Nikki Jahnke from the Cochrane Cystic Fibrosis and Genetics Disorders Group for her guidance and support during the process of writing this review.
This project was supported by the National Institute for Health Research, via Cochrane Infrastructure funding to the Cochrane Cystic Fibrosis and Genetic Disorders Group. The views and opinions expressed therein are those of the authors and do not necessarily reflect those of the Systematic Reviews Programme, NIHR, NHS or the Department of Health.
Version history
| Published | Title | Stage | Authors | Version |
| 2022 Aug 09 | Physical activity and exercise training in cystic fibrosis | Review | Thomas Radtke, Sherie Smith, Sarah J Nevitt, Helge Hebestreit, Susi Kriemler | |
| 2017 Nov 01 | Physical exercise training for cystic fibrosis | Review | Thomas Radtke, Sarah J Nevitt, Helge Hebestreit, Susi Kriemler | |
| 2015 Jun 28 | Physical exercise training for cystic fibrosis | Review | Thomas Radtke, Sarah J Nolan, Helge Hebestreit, Susi Kriemler | |
| 2008 Jan 23 | Physical training for cystic fibrosis | Review | Judy M Bradley, Fidelma Moran | |
| 2002 Apr 22 | Physical training for cystic fibrosis | Review | Judy M Bradley, Fidelma Moran | |
Differences between protocol and review
Post hoc changes for the 2017 update
Summary of findings tables have been added in line with Cochrane guidance.
It was stipulated that the duration of each included study duration should be at least two weeks, which is the typical length of (drug) treatment for pulmonary exacerbations where people with CF may also take part in in‐hospital exercise training. Moreover, from an exercise physiology perspective, less than two weeks of structured exercise are unlikely to elicit meaningful changes in the chosen outcomes measures.
We added the lung clearance index (LCI) derived from multiple‐breath washout to secondary outcomes "4. Additional indices of pulmonary function and respiratory muscle strength". The LCI is a relatively new and much examined pulmonary function outcome measure and included in many clinical studies including exercise training interventions.
We also added the diffusing capacity for carbon monoxide (DLCO) and the diffusing capacity for nitric oxide (DLNO) to secondary outcomes "4. Additional indices of pulmonary function and respiratory muscle strength". Non‐invasive measurement of the pulmonary diffusing capacity can provide novel physiological insights into the exercise training effects on pulmonary function beyond the much examined FEV1, derived from spirometry.
Post hoc changes for the 2015 update
The title of the review has been changed from 'Physical training for cystic fibrosis' to 'Physical exercise training for cystic fibrosis' as the new team felt this better reflected the content of the review.
The fourth primary outcome 'mortality' was moved to secondary outcomes in line with Cochrane guidance to limit the number of primary outcomes to three. For this update, primary and secondary outcome measures were changed as follows:
Primary outcomes
We limited the primary outcome measures to:
-
Exercise capacity by peak oxygen uptake (VO2 peak)
-
Pulmonary function by forced expiratory volume in one second (FEV1)
-
Health‐related quality of life (HRQoL).
In CF, VO2 peak and FEV1 are strong predictors of mortality, objectively measurable and are often used as primary outcomes in studies of physical exercise training. The outcome measure HRQoL is important participant‐reported outcome measure and is related to physical fitness in people with CF. None of the other primary outcomes from previous reviews has been shown to be of predictive value in CF and they should be considered explorative endpoints. All previous primary outcomes for pulmonary function are now integrated under the secondary outcome number 4 "Additional indices of pulmonary function and respiratory muscle strength" and exercise capacity variables including effort, oxygenation and fatigue are integrated into the secondary outcome number 3 " Additional indices of exercise capacity".
Secondary outcomes
We removed the secondary outcomes "Symptom scores", "Compliance with other treatment, such as chest physiotherapy, nutritional regimens" and "Cost evaluation". These outcomes are of unclear relevance, difficult to measure reliably and are rarely reported in physical training studies. We added the secondary outcome "Physical activity" because it is an important outcome in exercise training studies. The outcome "Measures of bone mineral density and diabetic control" was separated into "Bone health" and "Diabetic control" because these outcomes are unrelated and should be studied and reported separately. The outcome "Weight" was removed as a separate outcome and is now integrated within the outcome "Body composition" which comprises all measures of nutrition including body weight, body fat and fat‐free mass. The secondary outcome "Number of acute exacerbations, intravenous antibiotic courses and time off work or school" was separated as "Acute exacerbations (a) number of exacerbations; (b) time to first exacerbation" and "Antibiotic use (including oral, intravenous or inhaled antibiotics)".
Keywords
MeSH
Medical Subject Headings (MeSH) Keywords
Medical Subject Headings Check Words
Humans;
PICO
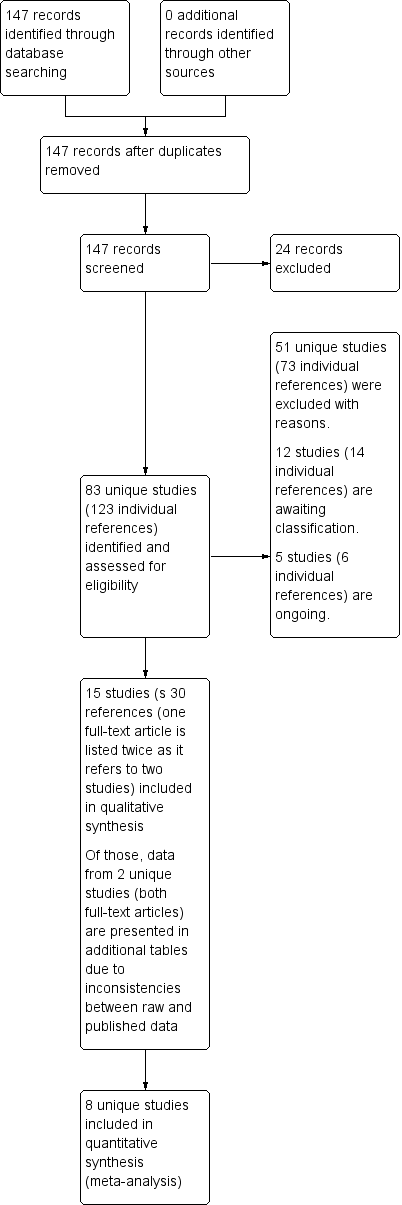
Study flow diagram.
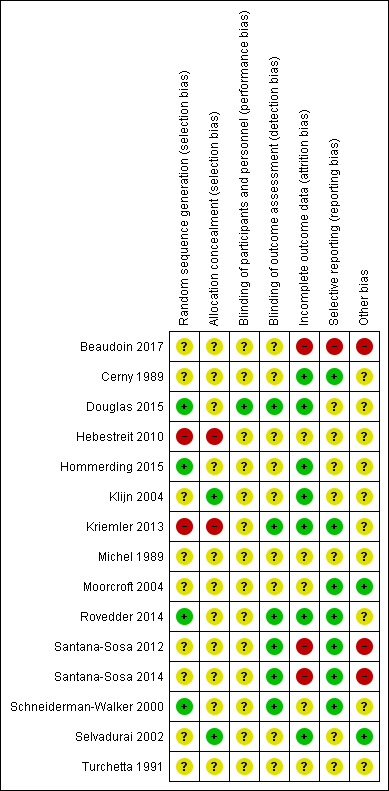
Methodological quality summary: review authors' judgments about each methodological quality item for each included study.

Methodological quality graph: review authors' judgments about each methodological quality item presented as percentages across all included studies.

Comparison 1 Aerobic training versus no physical training, Outcome 1 Change in VO2 peak during maximal exercise (ml/min per kg BW).

Comparison 1 Aerobic training versus no physical training, Outcome 2 Change in FEV1(% predicted).

Comparison 1 Aerobic training versus no physical training, Outcome 3 Change in health‐related quality of life.

Comparison 1 Aerobic training versus no physical training, Outcome 4 Change in mean power during WAnT (W per kg BW).

Comparison 1 Aerobic training versus no physical training, Outcome 5 Change in strength (Newton metres).
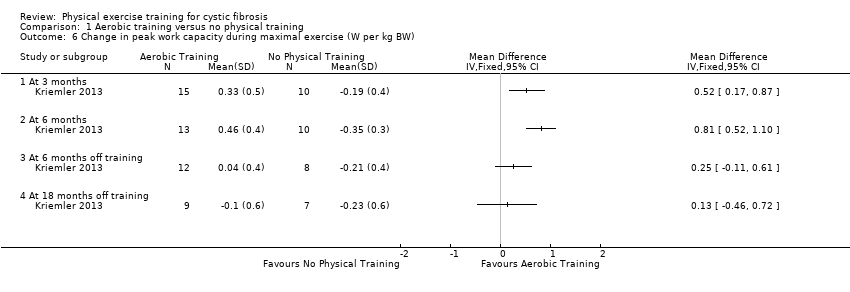
Comparison 1 Aerobic training versus no physical training, Outcome 6 Change in peak work capacity during maximal exercise (W per kg BW).
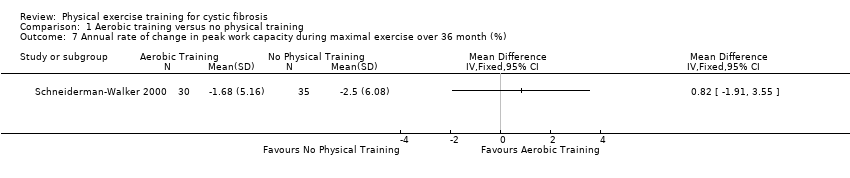
Comparison 1 Aerobic training versus no physical training, Outcome 7 Annual rate of change in peak work capacity during maximal exercise over 36 month (%).
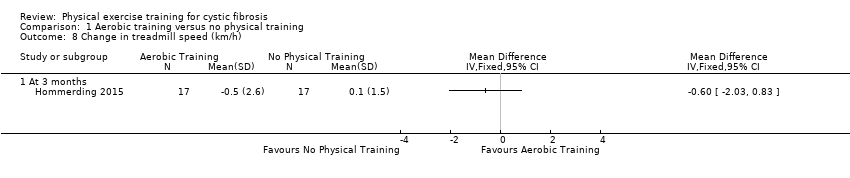
Comparison 1 Aerobic training versus no physical training, Outcome 8 Change in treadmill speed (km/h).
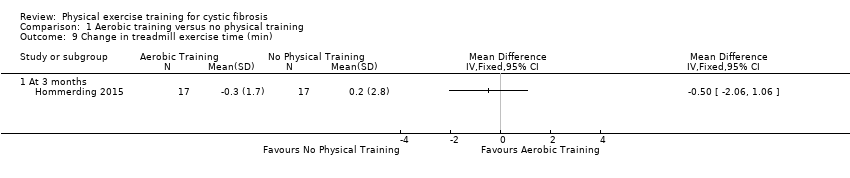
Comparison 1 Aerobic training versus no physical training, Outcome 9 Change in treadmill exercise time (min).

Comparison 1 Aerobic training versus no physical training, Outcome 10 Change in heart rate (beats per min).

Comparison 1 Aerobic training versus no physical training, Outcome 11 Change in oxygen saturation (%).
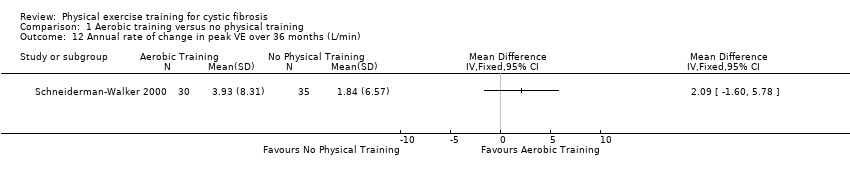
Comparison 1 Aerobic training versus no physical training, Outcome 12 Annual rate of change in peak VE over 36 months (L/min).

Comparison 1 Aerobic training versus no physical training, Outcome 13 Change in FVC (% predicted).

Comparison 1 Aerobic training versus no physical training, Outcome 14 Change in FEF25‐75 (% predicted).

Comparison 1 Aerobic training versus no physical training, Outcome 15 Change in RV/TLC (%).

Comparison 1 Aerobic training versus no physical training, Outcome 16 Change in FEV1/FVC (% predicted).

Comparison 1 Aerobic training versus no physical training, Outcome 17 Change in total physical activity (counts per min).
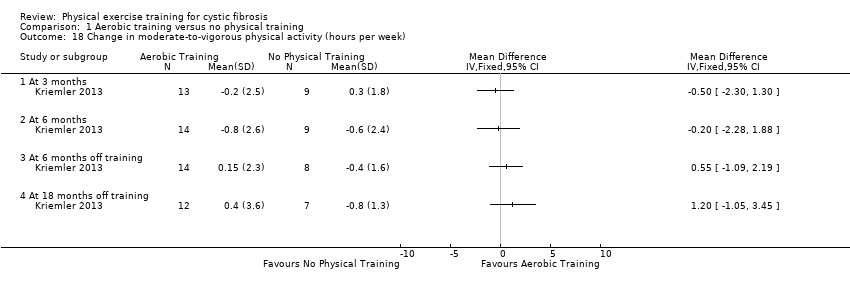
Comparison 1 Aerobic training versus no physical training, Outcome 18 Change in moderate‐to‐vigorous physical activity (hours per week).
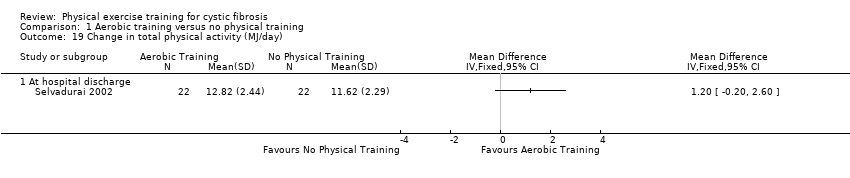
Comparison 1 Aerobic training versus no physical training, Outcome 19 Change in total physical activity (MJ/day).
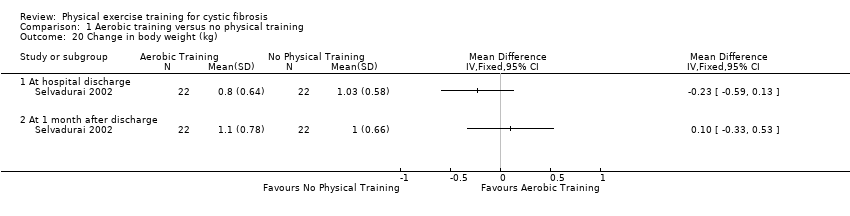
Comparison 1 Aerobic training versus no physical training, Outcome 20 Change in body weight (kg).

Comparison 1 Aerobic training versus no physical training, Outcome 21 Change in BMI (kg/m2).
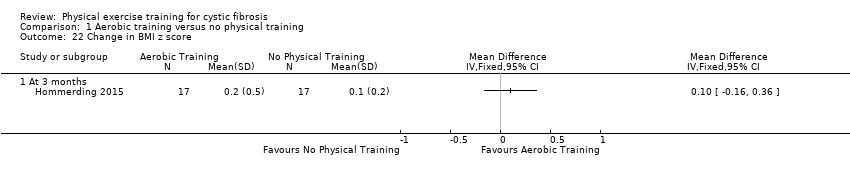
Comparison 1 Aerobic training versus no physical training, Outcome 22 Change in BMI z score.
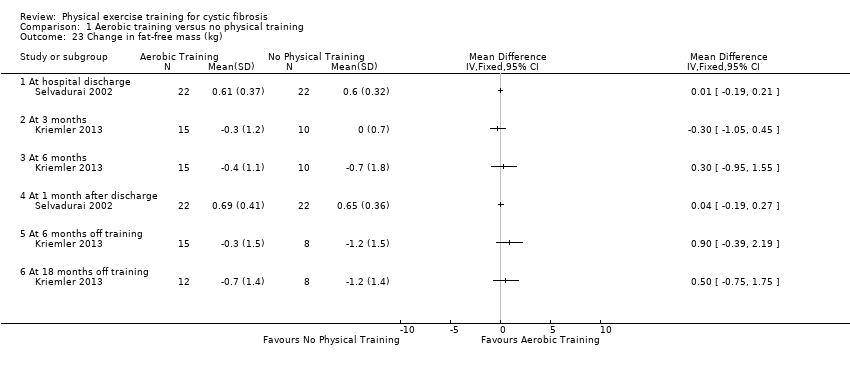
Comparison 1 Aerobic training versus no physical training, Outcome 23 Change in fat‐free mass (kg).

Comparison 1 Aerobic training versus no physical training, Outcome 24 Change in body fat (%).
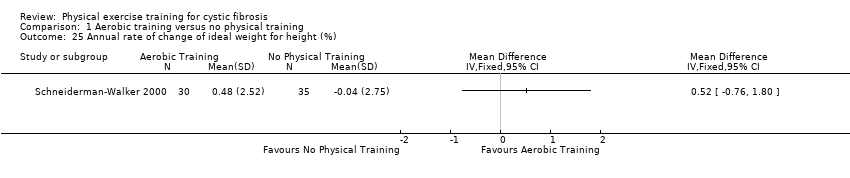
Comparison 1 Aerobic training versus no physical training, Outcome 25 Annual rate of change of ideal weight for height (%).
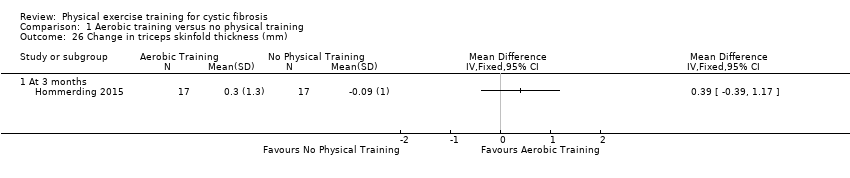
Comparison 1 Aerobic training versus no physical training, Outcome 26 Change in triceps skinfold thickness (mm).

Comparison 1 Aerobic training versus no physical training, Outcome 27 Change in arm muscle circumference (cm).
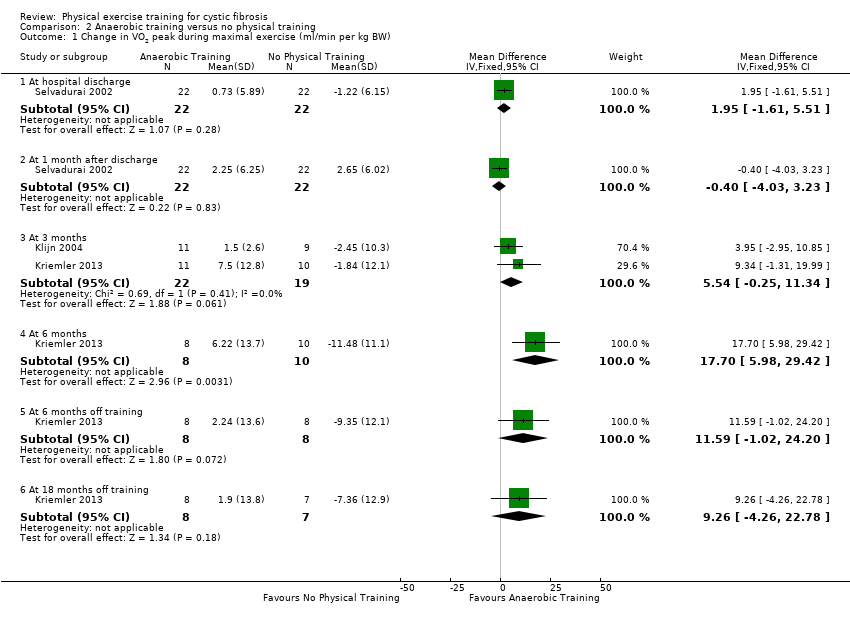
Comparison 2 Anaerobic training versus no physical training, Outcome 1 Change in VO2 peak during maximal exercise (ml/min per kg BW).
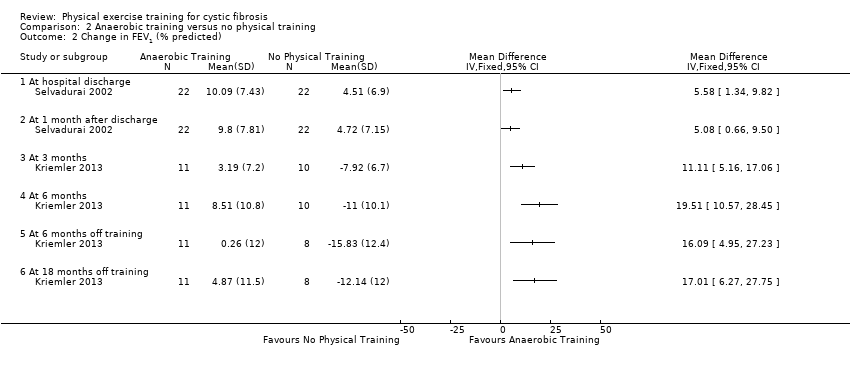
Comparison 2 Anaerobic training versus no physical training, Outcome 2 Change in FEV1 (% predicted).

Comparison 2 Anaerobic training versus no physical training, Outcome 3 Change in HRQoL.

Comparison 2 Anaerobic training versus no physical training, Outcome 4 Change in HRQoL physical function (CF questionnaire).
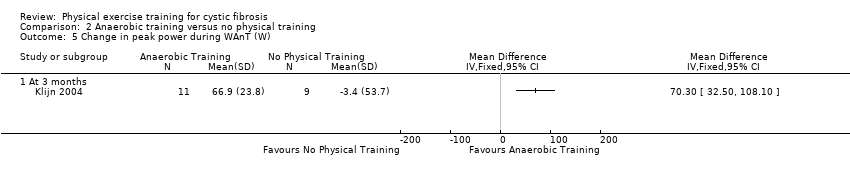
Comparison 2 Anaerobic training versus no physical training, Outcome 5 Change in peak power during WAnT (W).

Comparison 2 Anaerobic training versus no physical training, Outcome 6 Change in mean power during WAnT (W).

Comparison 2 Anaerobic training versus no physical training, Outcome 7 Change in mean power during WAnT (W per kg BW).
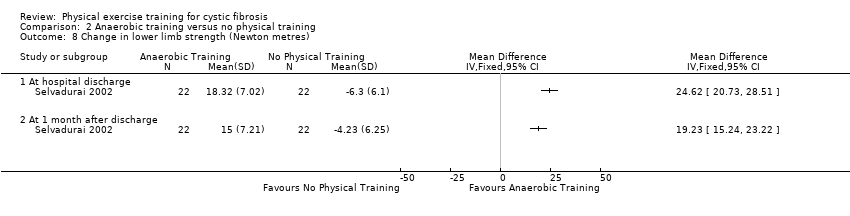
Comparison 2 Anaerobic training versus no physical training, Outcome 8 Change in lower limb strength (Newton metres).

Comparison 2 Anaerobic training versus no physical training, Outcome 9 Change in peak work capacity during maximal exercise (W).

Comparison 2 Anaerobic training versus no physical training, Outcome 10 Change in peak work capacity during maximal exercise (W per kg body weight).
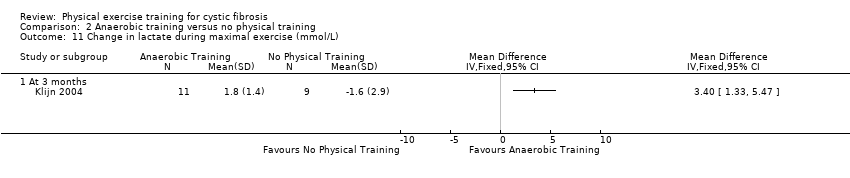
Comparison 2 Anaerobic training versus no physical training, Outcome 11 Change in lactate during maximal exercise (mmol/L).

Comparison 2 Anaerobic training versus no physical training, Outcome 12 Change in peak oxygen saturation during maximal exercise (%).

Comparison 2 Anaerobic training versus no physical training, Outcome 13 Change in FVC (% predicted).

Comparison 2 Anaerobic training versus no physical training, Outcome 14 Change in RV/TLC (%).
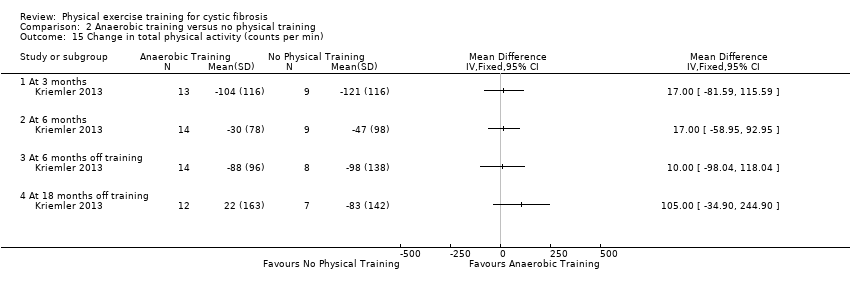
Comparison 2 Anaerobic training versus no physical training, Outcome 15 Change in total physical activity (counts per min).
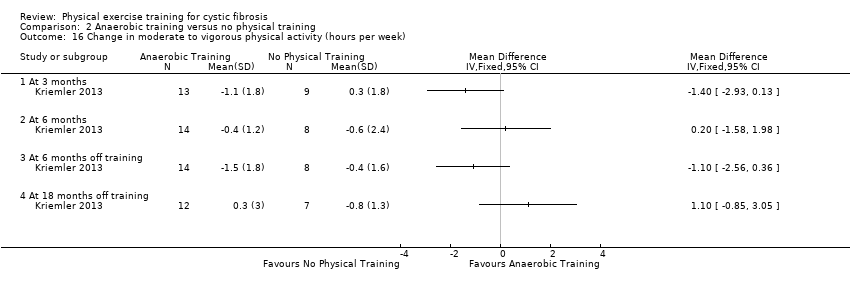
Comparison 2 Anaerobic training versus no physical training, Outcome 16 Change in moderate to vigorous physical activity (hours per week).

Comparison 2 Anaerobic training versus no physical training, Outcome 17 Change in physical activity (MJ/day).

Comparison 2 Anaerobic training versus no physical training, Outcome 18 Change in weight (kg).

Comparison 2 Anaerobic training versus no physical training, Outcome 19 Change in BMI (kg/m2).
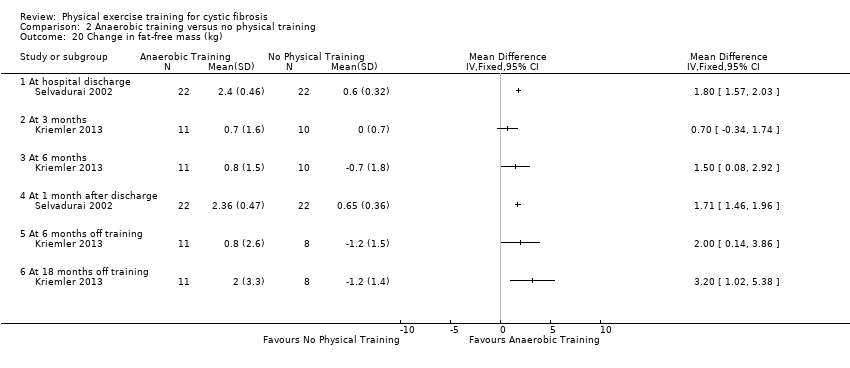
Comparison 2 Anaerobic training versus no physical training, Outcome 20 Change in fat‐free mass (kg).

Comparison 2 Anaerobic training versus no physical training, Outcome 21 Change in body fat (%).

Comparison 3 Combined aerobic and anaerobic training versus no physical training, Outcome 1 Change in VO2 peak during maximal exercise (ml/min per kg BW).
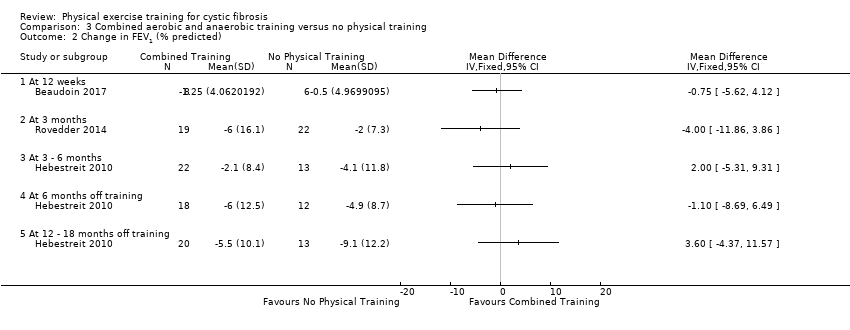
Comparison 3 Combined aerobic and anaerobic training versus no physical training, Outcome 2 Change in FEV1 (% predicted).
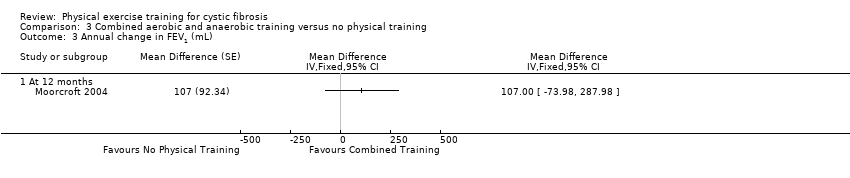
Comparison 3 Combined aerobic and anaerobic training versus no physical training, Outcome 3 Annual change in FEV1 (mL).

Comparison 3 Combined aerobic and anaerobic training versus no physical training, Outcome 4 Change in subjective health perception (CFQ‐R).
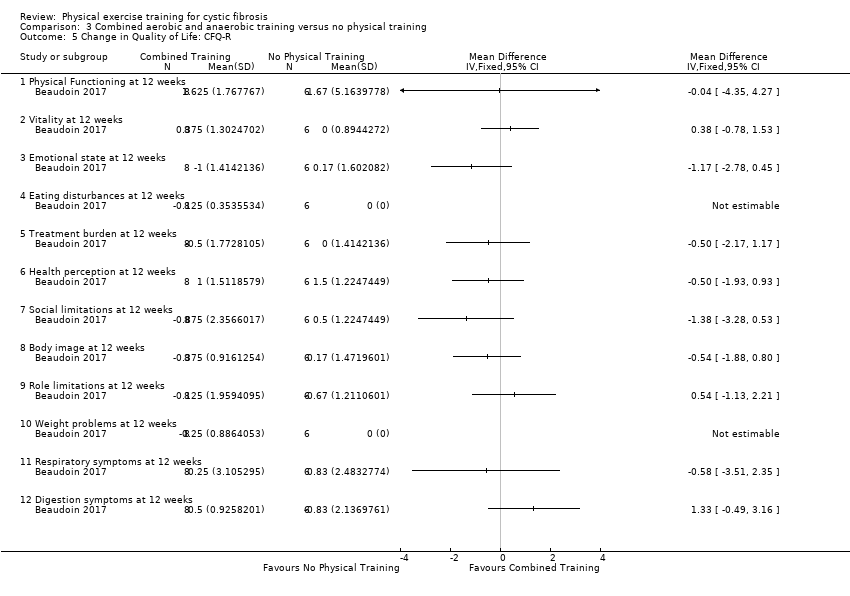
Comparison 3 Combined aerobic and anaerobic training versus no physical training, Outcome 5 Change in Quality of Life: CFQ‐R.
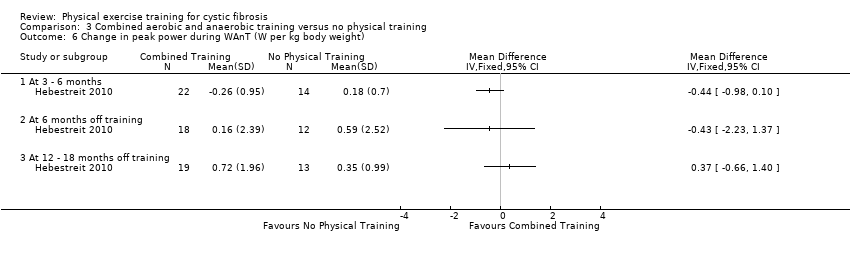
Comparison 3 Combined aerobic and anaerobic training versus no physical training, Outcome 6 Change in peak power during WAnT (W per kg body weight).

Comparison 3 Combined aerobic and anaerobic training versus no physical training, Outcome 7 Change in mean power during WAnT (W per kg body weight).

Comparison 3 Combined aerobic and anaerobic training versus no physical training, Outcome 8 Change in muscle strength (all limbs) (1RM test).
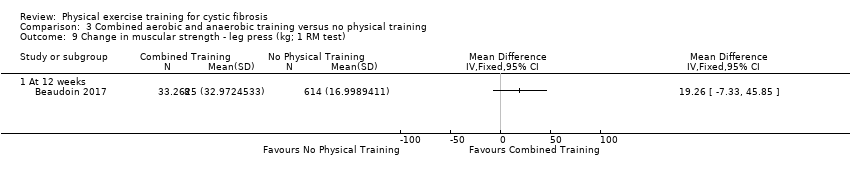
Comparison 3 Combined aerobic and anaerobic training versus no physical training, Outcome 9 Change in muscular strength ‐ leg press (kg; 1 RM test).
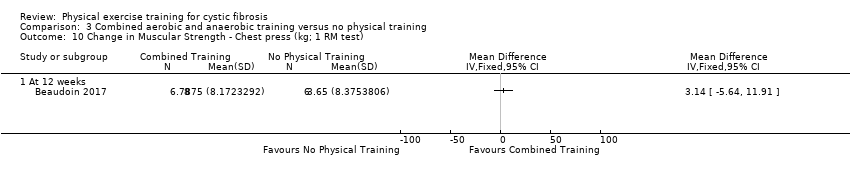
Comparison 3 Combined aerobic and anaerobic training versus no physical training, Outcome 10 Change in Muscular Strength ‐ Chest press (kg; 1 RM test).

Comparison 3 Combined aerobic and anaerobic training versus no physical training, Outcome 11 Change in Muscular Strength ‐ Latpull down (kg; 1 RM test).
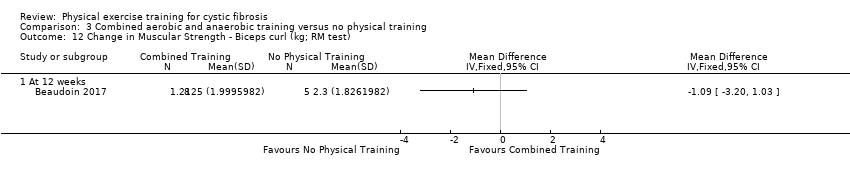
Comparison 3 Combined aerobic and anaerobic training versus no physical training, Outcome 12 Change in Muscular Strength ‐ Biceps curl (kg; RM test).

Comparison 3 Combined aerobic and anaerobic training versus no physical training, Outcome 13 Change in Muscular Endurance ‐ Number of push ups.

Comparison 3 Combined aerobic and anaerobic training versus no physical training, Outcome 14 Change in Muscular Endurance ‐ Number of sit ups.
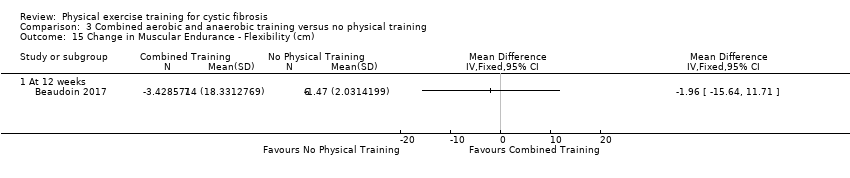
Comparison 3 Combined aerobic and anaerobic training versus no physical training, Outcome 15 Change in Muscular Endurance ‐ Flexibility (cm).

Comparison 3 Combined aerobic and anaerobic training versus no physical training, Outcome 16 Change in Muscular Endurance ‐ hand grip strength (kg).
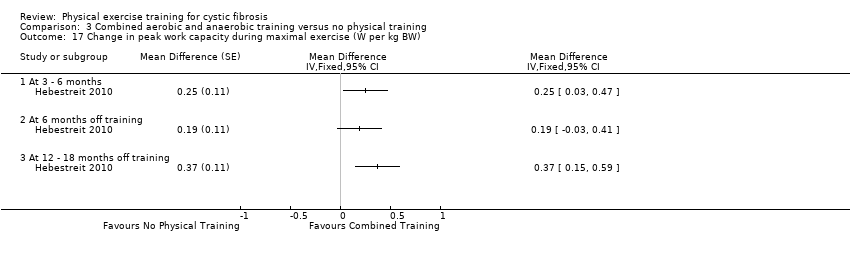
Comparison 3 Combined aerobic and anaerobic training versus no physical training, Outcome 17 Change in peak work capacity during maximal exercise (W per kg BW).

Comparison 3 Combined aerobic and anaerobic training versus no physical training, Outcome 18 Change in functional exercise capacity.
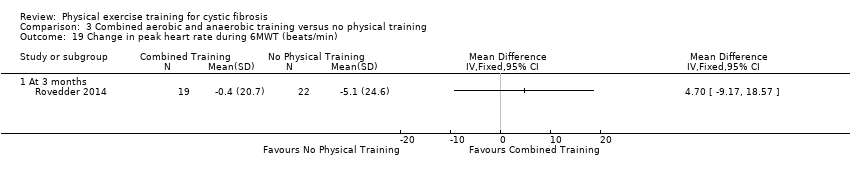
Comparison 3 Combined aerobic and anaerobic training versus no physical training, Outcome 19 Change in peak heart rate during 6MWT (beats/min).

Comparison 3 Combined aerobic and anaerobic training versus no physical training, Outcome 20 Annual change in peak heart rate (beat/min).

Comparison 3 Combined aerobic and anaerobic training versus no physical training, Outcome 21 Annual change in VE (L/min).
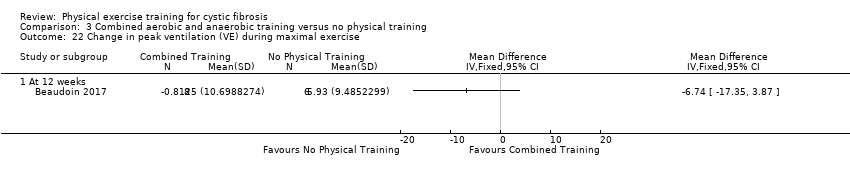
Comparison 3 Combined aerobic and anaerobic training versus no physical training, Outcome 22 Change in peak ventilation (VE) during maximal exercise.
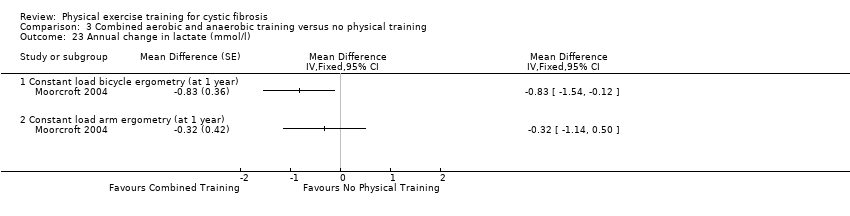
Comparison 3 Combined aerobic and anaerobic training versus no physical training, Outcome 23 Annual change in lactate (mmol/l).
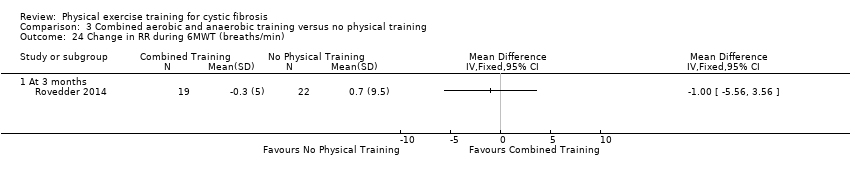
Comparison 3 Combined aerobic and anaerobic training versus no physical training, Outcome 24 Change in RR during 6MWT (breaths/min).

Comparison 3 Combined aerobic and anaerobic training versus no physical training, Outcome 25 Annual change in RR (breaths/min).
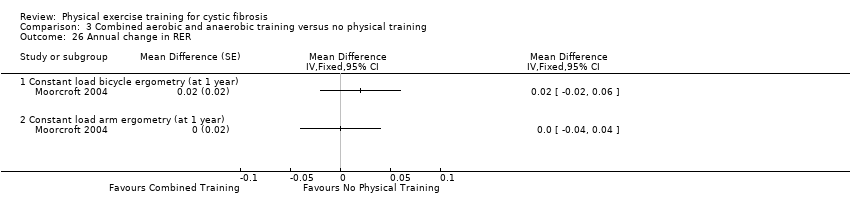
Comparison 3 Combined aerobic and anaerobic training versus no physical training, Outcome 26 Annual change in RER.
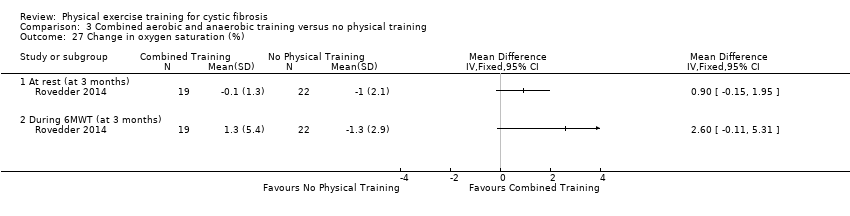
Comparison 3 Combined aerobic and anaerobic training versus no physical training, Outcome 27 Change in oxygen saturation (%).
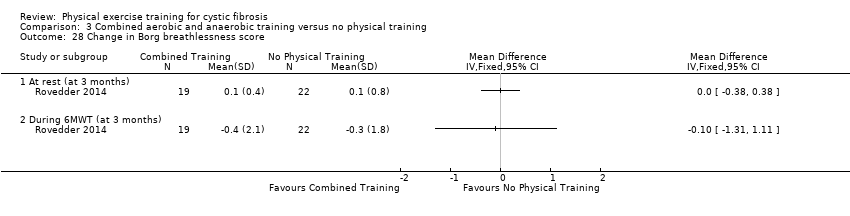
Comparison 3 Combined aerobic and anaerobic training versus no physical training, Outcome 28 Change in Borg breathlessness score.
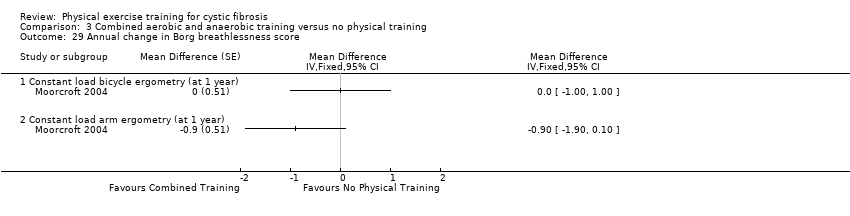
Comparison 3 Combined aerobic and anaerobic training versus no physical training, Outcome 29 Annual change in Borg breathlessness score.
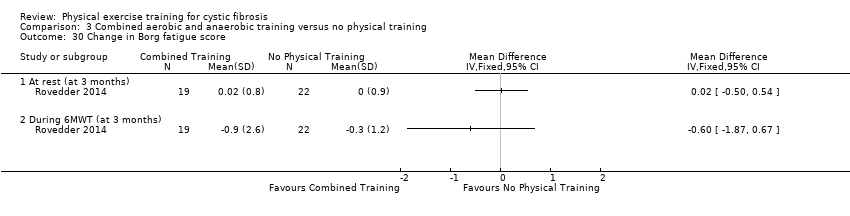
Comparison 3 Combined aerobic and anaerobic training versus no physical training, Outcome 30 Change in Borg fatigue score.

Comparison 3 Combined aerobic and anaerobic training versus no physical training, Outcome 31 Annual change in Borg muscle effort.

Comparison 3 Combined aerobic and anaerobic training versus no physical training, Outcome 32 Change in FVC (% predicted).
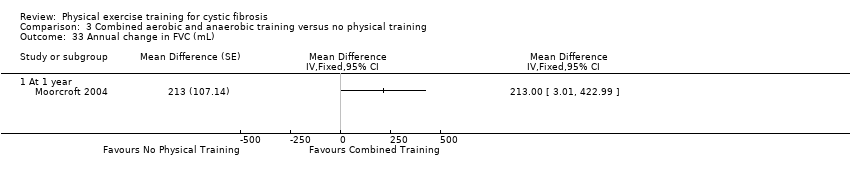
Comparison 3 Combined aerobic and anaerobic training versus no physical training, Outcome 33 Annual change in FVC (mL).

Comparison 3 Combined aerobic and anaerobic training versus no physical training, Outcome 34 Change in RV/TLC (%).

Comparison 3 Combined aerobic and anaerobic training versus no physical training, Outcome 35 Change in Total Energy Expenditure (k/cal).
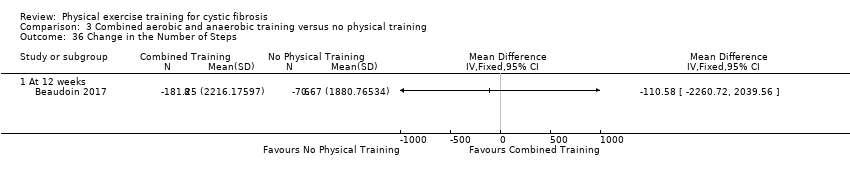
Comparison 3 Combined aerobic and anaerobic training versus no physical training, Outcome 36 Change in the Number of Steps.
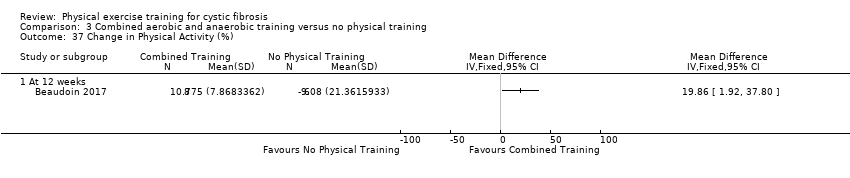
Comparison 3 Combined aerobic and anaerobic training versus no physical training, Outcome 37 Change in Physical Activity (%).
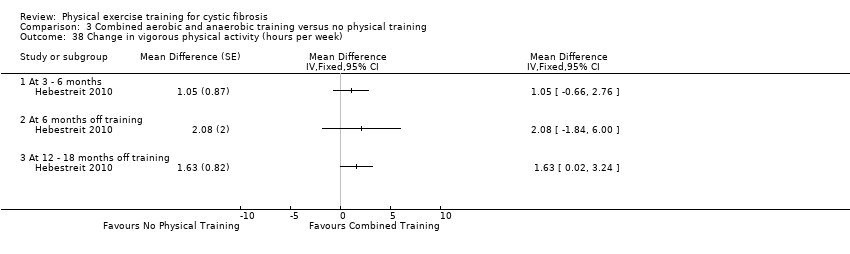
Comparison 3 Combined aerobic and anaerobic training versus no physical training, Outcome 38 Change in vigorous physical activity (hours per week).
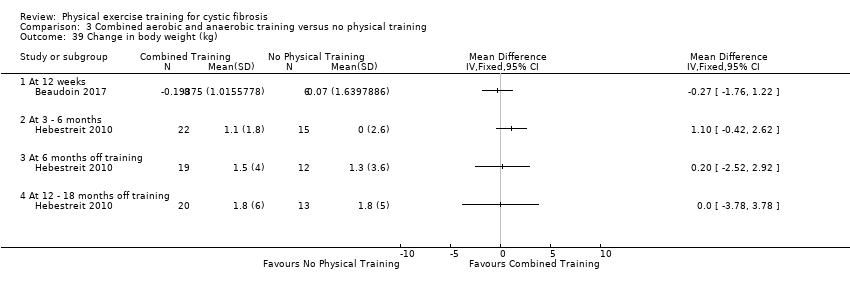
Comparison 3 Combined aerobic and anaerobic training versus no physical training, Outcome 39 Change in body weight (kg).

Comparison 3 Combined aerobic and anaerobic training versus no physical training, Outcome 40 Change in BMI (kg/m2).

Comparison 3 Combined aerobic and anaerobic training versus no physical training, Outcome 41 Change in sum of four skinfolds (mm).
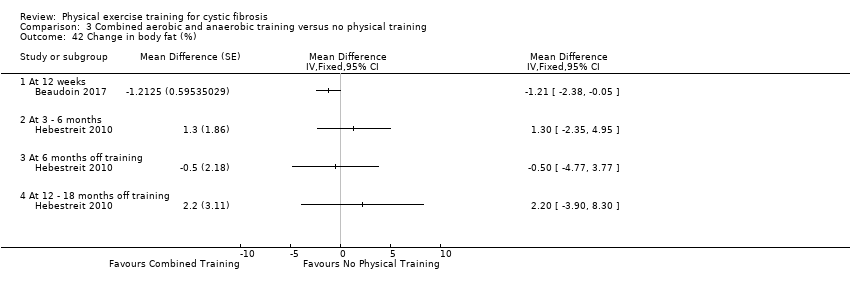
Comparison 3 Combined aerobic and anaerobic training versus no physical training, Outcome 42 Change in body fat (%).

Comparison 3 Combined aerobic and anaerobic training versus no physical training, Outcome 43 Change in fat‐mass (kg).
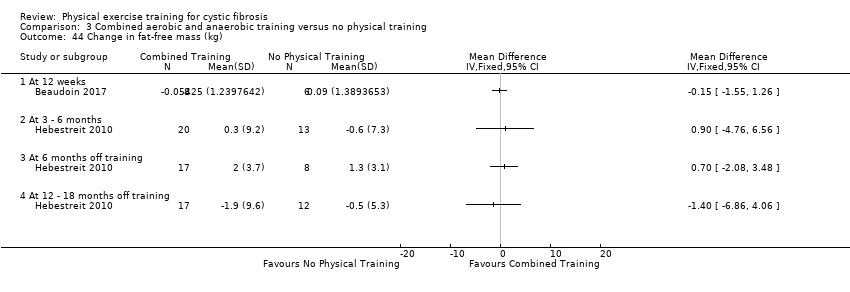
Comparison 3 Combined aerobic and anaerobic training versus no physical training, Outcome 44 Change in fat‐free mass (kg).

Comparison 3 Combined aerobic and anaerobic training versus no physical training, Outcome 45 Change in metabolic parameters (HbA1c (%)).
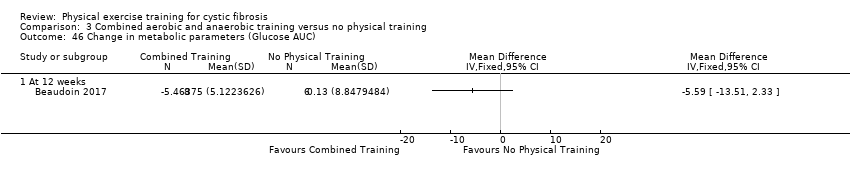
Comparison 3 Combined aerobic and anaerobic training versus no physical training, Outcome 46 Change in metabolic parameters (Glucose AUC).

Comparison 3 Combined aerobic and anaerobic training versus no physical training, Outcome 47 Change in metabolic parameters (Total Insulin AUC).

Comparison 3 Combined aerobic and anaerobic training versus no physical training, Outcome 48 Change in metabolic parameters (Insulin Sensitivity Index).

Comparison 3 Combined aerobic and anaerobic training versus no physical training, Outcome 49 Change in Plasma Glucose (mmol/L).
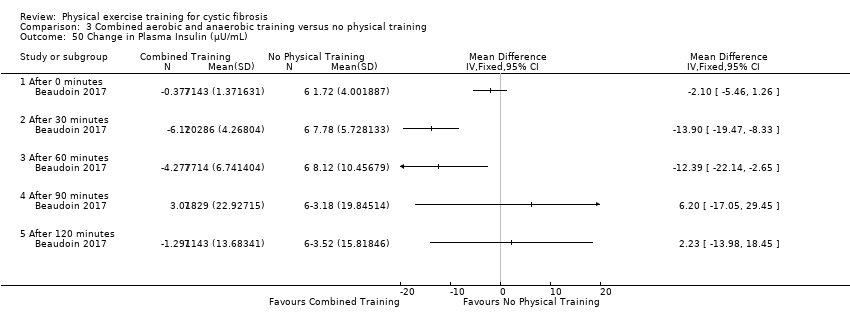
Comparison 3 Combined aerobic and anaerobic training versus no physical training, Outcome 50 Change in Plasma Insulin (µU/mL).
| Aerobic training compared with no physical training for cystic fibrosis | ||||||
| Patient or population: adults and children with cystic fibrosis Settings: Outpatients Intervention: Aerobic training Comparison: No physical training | ||||||
| Outcomes | Illustrative comparative risks* (95% CI) | Relative effect | No of participants | Quality of the evidence | Comments | |
| Assumed risk | Corresponding risk | |||||
| No physical training | Aerobic training | |||||
| Exercise capacity: change in VO2 peak during maximal exercise (mL/min per kg body weight) Follow‐up: from hospital discharge up to 3 years | Short‐term improvements in exercise tolerance during aerobic training were significantly greater than with no physical training at hospital discharge and 1 month after hospital discharge. One study showed no difference between groups at 3 months and 1 study showed a significant improvement in exercise tolerance following aerobic training at 6 months compared to no physical training. No significant longer‐term differences between groups were observed. | NA | 170 (4 studies) | ⊕⊝⊝⊝ | ||
| Pulmonary function: change in FEV1 (% predicted) Follow‐up: from hospital discharge up to 3 years | There were no short‐term differences between groups at hospital discharge or one month after hospital discharge. Two studies showed a significant improvement in pulmonary function during and following aerobic training at 3 months, 6 months and 18 months post‐training compared to no physical training. However, 1 study showed no significant differences in annual change of pulmonary function between groups were observed over 36 months. | NA | 187 (5 studies) | ⊕⊕⊝⊝ | ||
| HRQoL: CFQ Quality of Well‐being Scale and perceived 'positive effects.' Follow‐up: one month after hospital discharge up to three years | No significant differences between the groups were shown according to the CFQ. A significant improvement in HRQoL according to the Quality of Well‐being Scale was observed in the aerobic exercise group compared to the no physical training group at 1 month after hospital discharge, MD 0.10 (95% CI 0.03 to 0.17). Positive effects were reported by 43 out of 49 participants (not reported by treatment group). | NA | 143 (3 studies) | ⊕⊕⊝⊝ | ||
| CF‐related mortality Follow‐up: NA | Outcome not reported. | NA | ||||
| Pulmonary exacerbations: number of hospitalisations and number of days in hospital Follow‐up: up to three years | There were no between‐group differences reported for the mean number of hospitalisations or mean number of days in hospital at year 1, 2 and 3. | NA | 65 (1 study) | ⊕⊕⊝⊝ | ||
| Diabetic control Follow‐up:NA | Outcome not reported. | NA | ||||
| Adverse events Follow‐up: up to two years | One study reported that no adverse effects occurred. In the other study, 1 participant in the aerobic training group injured her ankle and missed 2 days of aerobic training. One participant from the control group developed haemoptysis and withdrew from the study. | NA | 71 (2 studies) | ⊕⊕⊕⊝ | ||
| *The basis for the assumed risk (e.g. the median control group risk across studies) is provided in footnotes. The corresponding risk (and its 95% confidence interval) is based on the assumed risk in the comparison group and the relative effect of the intervention (and its 95% CI). | ||||||
| GRADE Working Group grades of evidence | ||||||
| 1. Downgraded once due to risk of bias: Methodological details of the studies relating to randomisation and allocation concealment were unclear; one study used an inadequate method of randomisation and allocation concealment which may have introduced bias. | ||||||
| Anaerobic training compared with no physical training for cystic fibrosis | ||||||
| Patient or population: adults and children with cystic fibrosis Settings: outpatients Intervention: anaerobic training Comparison: no physical training | ||||||
| Outcomes | Illustrative comparative risks* (95% CI) | Relative effect | No of participants | Quality of the evidence | Comments | |
| Assumed risk | Corresponding risk | |||||
| No physical training | Anaerobic training | |||||
| Exercise capacity: change in VO2 peak during maximal exercise (mL/min per kg BW) Follow‐up: from hospital discharge up to 3 years | One study showed a significant improvement in exercise capacity following anaerobic training at 6 months compared to no physical training. No significant differences between groups were observed at any other time points. | NA | 86 (3 studies) | ⊕⊕⊝⊝ | ||
| Pulmonary function: change in FEV1 (% predicted) Follow‐up: from hospital discharge up to 3 years | Two studies showed a significant improvement in pulmonary function during and following anaerobic training at hospital discharge, 1 month after discharge, 3 months, 6 months and 18 months post‐training compared to no physical training. The second study showed no significant differences in lung function at any time point. | NA | 86 (3 studies) | ⊕⊕⊝⊝ | ||
| HRQoL: Quality of Well‐being Scale or HRQoL scale physical function Follow‐up: up to 2 years | No significant differences between groups were observed according to the Quality of Well‐being Scale or HRQoL scale physical function. | NA | 64 (2 studies) | ⊕⊕⊝⊝ | ||
| CF‐related mortality Follow‐up: NA | Outcome not reported. | NA | ||||
| Pulmonary exacerbations Follow‐up: NA | Outcome not reported. | NA | ||||
| Diabetic control Follow‐up: NA | Outcome not reported. | NA | ||||
| Adverse events Follow‐up: 2 years | One study reported that no adverse effects occurred. | NA | 22 (1 study) | ⊕⊕⊕⊝ | ||
| *The basis for the assumed risk (e.g. the median control group risk across studies) is provided in footnotes. The corresponding risk (and its 95% confidence interval) is based on the assumed risk in the comparison group and the relative effect of the intervention (and its 95% CI). | ||||||
| GRADE Working Group grades of evidence | ||||||
| 1. Downgraded once due to risk of bias: methodological details of the studies relating to randomisation and allocation concealment were unclear; one study used an inadequate method of randomisation and allocation concealment which may have introduced bias. | ||||||
| Combined aerobic and anaerobic training compared with no physical training for cystic fibrosis | ||||||
| Patient or population: adults and children with cystic fibrosis Settings: outpatients Intervention: combined aerobic and anaerobic training Comparison: no physical training | ||||||
| Outcomes | Illustrative comparative risks* (95% CI) | Relative effect | No of participants | Quality of the evidence | Comments | |
| Assumed risk | Corresponding risk | |||||
| No physical training | Combined aerobic and anaerobic training | |||||
| Exercise capacity: change in VO2 peak during maximal exercise (mL/min per kg body weight) Follow‐up: 12 weeks to two years | A significantly higher VO2 peak was found in the combined training compared to the no physical training group after 12 to 18 months in 1 study. No significant difference between groups was found at any other time point. | NA | 52 (2 studies) | ⊕⊕⊝⊝ | Two additional studies recruiting 42 participants showed significant group x time interactions for VO2 peak; however, these results are not included in this review due to concerns over inconsistencies in the data provided to us by the original trial authors. | |
| Pulmonary function: change in FEV1 (% predicted) or mL Follow‐up: 12 weeks to two years | No significant differences in pulmonary function were observed between treatment groups at any time point. | NA | 103 (3 studies) | ⊕⊕⊝⊝ | ||
| HRQoL: CFQ, Medical Outcomes Study‐36 Item Short‐Form Health Survey, SF‐36 Follow‐up: 12 weeks to 2 years | Two studies showed no significant differences in any HRQoL scale. One study showed a significant improvement in subjective health perception in the combined training group after 3 to 6 months and after 12 to 18 months (but not between 6 and 12 months). | NA | 93 (3 studies) | ⊕⊝⊝⊝ | ||
| CF‐related mortality Follow‐up: NA | Outcome not reported. | NA | ||||
| Pulmonary exacerbations Follow‐up: NA | Outcome not reported. | NA | ||||
| Diabetic control Follow‐up: 12 weeks | Significant differences in some of the parameters were observed in the no physical training group compared to the combined training group and vice versa. Also no significant differences were observed for some parameters. | NA | 14 (1 study) | ⊕⊝⊝⊝ | The study reported a range of metabolic parameters (HbA1c(%), Glucose AUC, Total Insulin AUC, Insulin Sensitivity Index) Plasma Glucose and Plasma Insulin. | |
| Adverse events Follow‐up: NA | Outcome not reported. | NA | ||||
| *The basis for the assumed risk (e.g. the median control group risk across studies) is provided in footnotes. The corresponding risk (and its 95% confidence interval) is based on the assumed risk in the comparison group and the relative effect of the intervention (and its 95% CI). | ||||||
| GRADE Working Group grades of evidence | ||||||
| 1. Downgraded once due to risk of bias: methodological details of the studies relating to randomisation and allocation concealment were unclear; one study used an inadequate method of randomisation and allocation concealment which may have introduced bias. | ||||||
| Variable | Group | Pre‐training | Post‐training | Detraining | P value (group x time) | Comments |
| Age (mean (SE)) years | Intervention | 11 (3) | ‐ | ‐ | ‐ | |
| Control | 10 (2) | ‐ | ‐ | ‐ | ||
| Sex (% boys) | Intervention | 55 | ‐ | ‐ | ‐ | |
| Control | 64 | ‐ | ‐ | ‐ | ||
| VO2 peak (mean (95% CI)) ml/min per kg body weight | Intervention | n.a. | 3.9 (1.8 to 6.1) | ‐3.4 (‐5.7 to 1.7) | 0.036 | Significantly higher in controls at baseline (P = 0.023). Data were presented in a figure in the original publication. |
| Control | n.a. | ‐2.2 (‐5.3 to 0.1) | ‐0.7 (‐4.4 to 5.9) | |||
| Leg press (mean (95% CI)) kg | Intervention | n.a. | 24.9 (14.3 to 34.4) | ‐1.0 (‐4.1 to 3.3) | < 0.001 | Data are reported in a figure in the original publication. Significantly higher in controls at baseline (P = 0.014). |
| Control | n.a. | n.a. | n.a. | |||
| Bench press (mean (95% CI)) kg | Intervention | n.a. | 10.5 (7.0 to 14.0) | ‐1.2 (‐3.6 to 3.0) | < 0.001 | Significantly higher in controls at baseline (P = 0.007). Data presented in a figure in the original publication. |
| Control | n.a. | n.a. | n.a. | |||
| Seated row (mean (95% CI)) kg | Intervention | n.a. | 12.7 (9.2 to 16.0) | ‐0.2 (‐3.6 to 3.2) | < 0.001 | Significantly higher in controls at baseline (P = 0.009). Data presented in a figure in the original publication. |
| Control | n.a. | n.a. | n.a. | |||
| Oxygen saturation at peak exercise (mean (SE)) | Intervention | 94.9 (0.9)% | 95.6 (0.8)% | 94.5 (1.2)% | n.a. | |
| Control | 95.7 (0.5)% | 96.4 (0.4)% | 96.1 (0.5)% | |||
| FEV1 (mean (SE)) litres | Intervention | 1.87 (0.24) | 1.94 (0.23) | 1.90 (0.25) | 0.769 | |
| Control | 1.77 (0.17) | 1.87 (0.15) | 1.79 (0.19) | |||
| FVC (mean (SE)) litres | Intervention | 2.41 (0.24) | 2.49 (0.25) | 2.56 (0.29) | 0.920 | |
| Control | 2.29 (0.19) | 2.36 (0.20) | 2.40 (0.24) | |||
| PImax (mean (SE)) cm H2O | Intervention | 64.0 (5.5) | 69.8 (6.8) | 75.2 (6.2) | 0.797 | |
| Control | 61.5 (6.9) | 72.2 (7.2) | 76.4 (7.5) | |||
| HRQoL score ‐ children's report (median (range)) | Intervention | 696 (495 ‐ 741) | 719 (550 ‐ 734) | ‐ | 0.257 | HRQoL was assessed before and after the intervention. P value for comparison pre versus post‐training. |
| Control | 649 (578 ‐ 768) | 638 (461 ‐ 791) | ‐ | |||
| HRQoL score ‐ parents' report (median (range)) | Intervention | 896 (688‐1011) | 889 (811 ‐ 973) | ‐ | 0.143 | HRQoL was assessed before and after the intervention. |
| Control | 911 (842 ‐ 1028) | 978 (684 ‐ 1059) | ‐ | |||
| Weight (mean (SE)) kg | Intervention | 39.9 (3.5) | 40.5 (3.4) | 41.4 (3.4) | 0.723 | |
| Control | 34.0 (2.6) | 35.1 (2.8) | 36.2 (3.0) | |||
| BMI (mean (SE)) kg/m² | Intervention | 18.4 (1.0) | 18.3 (0.7) | 18.5 (0.7) | 0.959 | |
| Control | 17.2 (0.8) | 17.1 (0.8) | 17.4 (0.9) | |||
| Fat‐free mass (mean (SE)) % | Intervention | 78.1 (2.7) | 79.4 (2.8) | 78.8 (2.9) | 0.115 | |
| Control | 81.1 (2.5) | 80.9 (2.1) | 81.1 (2.2) | |||
| Body fat (mean (SE)) % | Intervention | 21.9 (2.7) | 20.6 (2.8) | 21.2 (2.9) | 0.115 | |
| Control | 18.9 (2.5) | 19.1 (2.1) | 18.9 (2.2) | |||
| Compliance with physical training (mean (SE)) % | Intervention | ‐ | 95.1 (7.4) | ‐ | ‐ ‐ | 73% of children completed all training sessions. |
| Control | ‐ | ‐ | ‐ | |||
| Adverse effects | Intervention | ‐ | ‐ | ‐ | ‐ | No adverse effects occurred during training or maximal exercise testing. |
| Control | ‐ | ‐ | ‐ | |||
| BMI: body mass index | ||||||
| Variable | Group | Pre‐training | Post‐training | Detraining | P value (group x time) | Comments |
| Age (mean (SE)) years | Intervention | 11 (1) | ‐ | ‐ | ‐ | |
| Control | 10 (1) | ‐ | ‐ | ‐ | ||
| Sex (% boys) | Intervention | 60 | ‐ | ‐ | ‐ | |
| Control | 60 | ‐ | ‐ | ‐ | ||
| VO2 peak (mean (95% CI) ml/min per kg body weight | Intervention | n.a. | 6.9 (3.4 to 10.5) | ‐1.5 (‐2.7 to ‐0.4) | < 0.001 | Significantly higher in controls at baseline (P = 0.034). |
| Control | n.a. | n.a. | n.a. | |||
| Leg press (mean (SE)) kg | Intervention | 62.5 (6.5) | 89.5 (9.3) | 88.6 (9.2) | < 0.001 | Significantly higher in controls at baseline (P = 0.046). |
| Control | 45.2 (4.7) | 43.9 (5.1) | 43.9 (5.4) | |||
| Bench press (mean (SE)) kg | Intervention | 26.4 (2.7) | 38.4 (3.2) | 35.9 (2.9) | < 0.001 | |
| Control | 23.2 (2.9) | 21.6 (3.2) | 21.7 (3.6) | |||
| Lateral row (mean (SE)) kg | Intervention | 30.5 (3.6) | 43.0 (4.2) | 35.9 (2.9) | < 0.001 | |
| Control | 23.2 (3.0) | 22.0 (3.1) | 21.7 (3.6) | |||
| Oxygen saturation at peak exercise (mean (SE)) % | Intervention | 94.7 (0.7) | 94.5 (0.7) | 93.1 (0.8) | n.a. | |
| Control | 96.4 (0.4) | 96.2 (0.5) | 96.1 (0.6) | |||
| FEV1 (mean (SE)) L | Intervention | 1.65 (0.19) | 1.74 (0.23) | 1.69 (0.24) | 0.486 | |
| Control | 1.57 (0.26) | 1.55 (0.26) | 1.59 (0.26) | |||
| FVC (mean (SE)) L | Intervention | 2.23 (0.27) | 2.34 (0.29) | 2.28 (0.28) | 0.156 | |
| Control | 1.90 (0.33) | 1.85 (0.32) | 1.92 (0.32) | |||
| PImax (mean (SE)) cm H2O | Intervention | 68.3 (6.3) | 107.6 (8.4) | 103.2 (8.1) | < 0.001 | |
| Control | 69.5 (9.7) | 71.8 (10.0) | 66.7 (9.4) | |||
| HRQoL score (median (min ‐ max)) | Intervention | 629 (505 ‐ 701) | 688 (609 ‐ 791) | ‐ | 0.071 | HRQoL was assessed before and after the intervention. |
| Control | 636 (626 ‐ 745) | 638 (626 ‐ 737) | ‐ | |||
| Weight (mean (SE)) kg | Intervention | 36.4 (3.1) | 37.8 (3.2) | 38.3 (3.1) | 0.342 | |
| Control | 31.5 (4.6) | 32.4 (4.7) | 32.7 (4.5) | |||
| Fat‐free mass (mean (SE)) % of total | Intervention | 81.6 (1.3) | 82.6 (1.0) | 82.5 (1.0) | 0.001 | |
| Control | 82.9 (1.8) | 82.8 (1.8) | 82.5 (1.9) | |||
| Body fat (mean (SE)) % of total | Intervention | 18.4 (1.3) | 17.4 (1.2) | 17.5 (1.1) | 0.023 | |
| Control | 17.1 (1.8) | 17.2 (1.8) | 17.5 (1.9) | |||
| Compliance with physical training (mean (SE)) % | Intervention | ‐ | 97.5 (1.7) | ‐ | 70% of children completed all training sessions. | |
| Control | ‐ | ‐ | ‐ | |||
| Adverse effects | Intervention | ‐ | ‐ | ‐ | No adverse effects occurred during training or exercise testing. | |
| Control | ‐ | ‐ | ‐ | |||
| CI: confidence interval | ||||||
| Health‐related quality of life | Exercise group (n = 19) | Control group (n = 22) | P value |
| HRQoL scale ‐ physical (median (interquartile range)) | 6.1 (‐4 to 8) | 2.4 (‐10 to 13) | 0.742 |
| HRQoL scale ‐ body image (median (interquartile range)) | 3.3 (‐11 to 22) | 3.0 (‐2 to 11) | 0.915 |
| HRQoL scale ‐ digestive (median (interquartile range)) | ‐1.0 (‐4 to 0) | ‐0.5 (0 to 0) | 0.953 |
| HRQoL scale ‐ respiratory (median (interquartile range)) | 3.8 (0 to 11) | ‐4.7 (‐1 to 7) | 0.925 |
| HRQoL scale ‐ emotional (median (interquartile range)) | 1.2 (‐6 to 6) | ‐4.3 (‐13 to 6) | 0.458 |
| HRQoL scale ‐ social (median (interquartile range)) | ‐1.1 (‐11 to 5) | ‐1.7 (‐5 to 11) | 0.822 |
| HRQoL scale ‐ food (median (interquartile range)) | ‐0.3 (‐11 to 6) | ‐2.0 (‐11 to 0) | 0.913 |
| HRQoL scale ‐ treatment (median (interquartile range)) | ‐2.0 (‐11 to 0) | ‐2.5 (‐11 to 11) | 0.850 |
| HRQoL scale ‐ vitality (median (interquartile range)) | ‐1.2 (‐16 to 8) | 2.6 (‐8 to 10) | 0.579 |
| HRQoL scale ‐ health (median (interquartile range)) | 1.7 (‐11 to 16) | ‐3.0 (‐11 to 0) | 0.382 |
| HRQoL scale ‐ weight (median (interquartile range)) | 4.6 (0 to 33) | 12.1 (0 to 11) | 0.410 |
| HRQoL scale ‐ social role (median (interquartile range)) | 0.8 (‐8 to 8) | 1.8 (‐2 to 0) | 0.935 |
| SF‐36 ‐ functional capacity (median (interquartile range)) | 2.8 (‐10 to 15) | 2.0 (‐11 to 10) | 0.916 |
| SF‐36 ‐ physical aspects (median (interquartile range)) | 11.8 (‐25 to 50) | 6.8 (‐6 to 31) | 0.705 |
| SF‐36 ‐ pain (mean (median (interquartile range)) | ‐7.2 (‐28 to 11) | 8.0 (7 to 17) | 0.100 |
| SF‐36 ‐ general health (median (interquartile range)) | 3.7 (‐5 to 10) | ‐3.5 (‐11 to 5) | 0.197 |
| SF‐36 ‐ vitality (median (interquartile range)) | 1.2 (‐15 to 20) | 7.5 (‐1 to 21) | 0.416 |
| SF‐36 ‐ social aspects (median (interquartile range)) | 15.2 (0 to 33) | 21.2 (0 to 66) | 0.989 |
| SF‐36 ‐ emotional aspects (median (interquartile range)) | 4.7 (‐12 to 37) | 4.5 (‐12 to 25) | 0.914 |
| SF‐36 ‐ mental health (median (interquartile range)) | ‐0.8 (‐12 to 12) | 0.9 (‐9 to 13) | 0.752 |
| Pre‐post changes in HRQoL measured by the CFQ and the SF‐36 CFQ: Cystic Fibrosis Questionnaire | |||
| Outcome or subgroup title | No. of studies | No. of participants | Statistical method | Effect size |
| 1 Change in VO2 peak during maximal exercise (ml/min per kg BW) Show forest plot | 3 | Mean Difference (IV, Fixed, 95% CI) | Subtotals only | |
| 1.1 At hospital discharge | 1 | 44 | Mean Difference (IV, Fixed, 95% CI) | 8.53 [4.85, 12.21] |
| 1.2 At 1 month after discharge | 1 | 44 | Mean Difference (IV, Fixed, 95% CI) | 4.91 [1.13, 8.69] |
| 1.3 At 3 months | 2 | 59 | Mean Difference (IV, Fixed, 95% CI) | 2.29 [‐2.71, 7.29] |
| 1.4 At 6 months | 1 | 25 | Mean Difference (IV, Fixed, 95% CI) | 18.33 [8.95, 27.71] |
| 1.5 At 6 months off training | 1 | 22 | Mean Difference (IV, Fixed, 95% CI) | 9.51 [‐1.32, 20.34] |
| 1.6 At 18 months off training | 1 | 18 | Mean Difference (IV, Fixed, 95% CI) | 2.86 [‐9.70, 15.42] |
| 2 Change in FEV1(% predicted) Show forest plot | 4 | Mean Difference (IV, Fixed, 95% CI) | Subtotals only | |
| 2.1 At hospital discharge | 1 | 44 | Mean Difference (IV, Fixed, 95% CI) | 2.03 [‐2.31, 6.37] |
| 2.2 At 1 month after discharge | 1 | 44 | Mean Difference (IV, Fixed, 95% CI) | 1.53 [‐2.93, 5.99] |
| 2.3 At 3 months | 2 | 58 | Mean Difference (IV, Fixed, 95% CI) | 7.21 [2.49, 11.94] |
| 2.4 At 6 months | 1 | 25 | Mean Difference (IV, Fixed, 95% CI) | 17.17 [8.59, 25.75] |
| 2.5 At 6 months off training | 1 | 23 | Mean Difference (IV, Fixed, 95% CI) | 16.92 [6.07, 27.77] |
| 2.6 At 18 months off training | 1 | 20 | Mean Difference (IV, Fixed, 95% CI) | 12.45 [1.27, 23.63] |
| 2.7 Annual rate of change over 36 months | 1 | 65 | Mean Difference (IV, Fixed, 95% CI) | 2.01 [‐0.06, 4.08] |
| 3 Change in health‐related quality of life Show forest plot | 1 | Mean Difference (IV, Fixed, 95% CI) | Totals not selected | |
| 3.1 At 1 month after discharge | 1 | Mean Difference (IV, Fixed, 95% CI) | 0.0 [0.0, 0.0] | |
| 4 Change in mean power during WAnT (W per kg BW) Show forest plot | 1 | Mean Difference (IV, Fixed, 95% CI) | Totals not selected | |
| 4.1 At 3 months | 1 | Mean Difference (IV, Fixed, 95% CI) | 0.0 [0.0, 0.0] | |
| 4.2 At 6 months | 1 | Mean Difference (IV, Fixed, 95% CI) | 0.0 [0.0, 0.0] | |
| 4.3 At 6 months off training | 1 | Mean Difference (IV, Fixed, 95% CI) | 0.0 [0.0, 0.0] | |
| 4.4 At 18 months off training | 1 | Mean Difference (IV, Fixed, 95% CI) | 0.0 [0.0, 0.0] | |
| 5 Change in strength (Newton metres) Show forest plot | 1 | Mean Difference (IV, Fixed, 95% CI) | Totals not selected | |
| 5.1 At hospital discharge | 1 | Mean Difference (IV, Fixed, 95% CI) | 0.0 [0.0, 0.0] | |
| 5.2 At 1 month after discharge | 1 | Mean Difference (IV, Fixed, 95% CI) | 0.0 [0.0, 0.0] | |
| 6 Change in peak work capacity during maximal exercise (W per kg BW) Show forest plot | 1 | Mean Difference (IV, Fixed, 95% CI) | Totals not selected | |
| 6.1 At 3 months | 1 | Mean Difference (IV, Fixed, 95% CI) | 0.0 [0.0, 0.0] | |
| 6.2 At 6 months | 1 | Mean Difference (IV, Fixed, 95% CI) | 0.0 [0.0, 0.0] | |
| 6.3 At 6 months off training | 1 | Mean Difference (IV, Fixed, 95% CI) | 0.0 [0.0, 0.0] | |
| 6.4 At 18 months off training | 1 | Mean Difference (IV, Fixed, 95% CI) | 0.0 [0.0, 0.0] | |
| 7 Annual rate of change in peak work capacity during maximal exercise over 36 month (%) Show forest plot | 1 | Mean Difference (IV, Fixed, 95% CI) | Totals not selected | |
| 8 Change in treadmill speed (km/h) Show forest plot | 1 | Mean Difference (IV, Fixed, 95% CI) | Totals not selected | |
| 8.1 At 3 months | 1 | Mean Difference (IV, Fixed, 95% CI) | 0.0 [0.0, 0.0] | |
| 9 Change in treadmill exercise time (min) Show forest plot | 1 | Mean Difference (IV, Fixed, 95% CI) | Totals not selected | |
| 9.1 At 3 months | 1 | Mean Difference (IV, Fixed, 95% CI) | 0.0 [0.0, 0.0] | |
| 10 Change in heart rate (beats per min) Show forest plot | 2 | Mean Difference (IV, Fixed, 95% CI) | Totals not selected | |
| 10.1 At rest at 3 months | 1 | Mean Difference (IV, Fixed, 95% CI) | 0.0 [0.0, 0.0] | |
| 10.2 At maximal exercise at 3 months | 1 | Mean Difference (IV, Fixed, 95% CI) | 0.0 [0.0, 0.0] | |
| 10.3 At maximal exercise ‐ annual rate of change over 36 months | 1 | Mean Difference (IV, Fixed, 95% CI) | 0.0 [0.0, 0.0] | |
| 11 Change in oxygen saturation (%) Show forest plot | 2 | Mean Difference (IV, Fixed, 95% CI) | Totals not selected | |
| 11.1 During maximal exercise at hospital discharge | 1 | Mean Difference (IV, Fixed, 95% CI) | 0.0 [0.0, 0.0] | |
| 11.2 During maximal exercise at 3 months | 1 | Mean Difference (IV, Fixed, 95% CI) | 0.0 [0.0, 0.0] | |
| 11.3 At rest at 3 months | 1 | Mean Difference (IV, Fixed, 95% CI) | 0.0 [0.0, 0.0] | |
| 12 Annual rate of change in peak VE over 36 months (L/min) Show forest plot | 1 | Mean Difference (IV, Fixed, 95% CI) | Totals not selected | |
| 13 Change in FVC (% predicted) Show forest plot | 4 | Mean Difference (IV, Fixed, 95% CI) | Subtotals only | |
| 13.1 At hospital discharge | 1 | 44 | Mean Difference (IV, Fixed, 95% CI) | 0.06 [‐2.55, 2.67] |
| 13.2 At 3 months | 2 | 58 | Mean Difference (IV, Fixed, 95% CI) | 4.89 [0.69, 9.08] |
| 13.3 At 6 months | 1 | 25 | Mean Difference (IV, Fixed, 95% CI) | 12.51 [5.90, 19.12] |
| 13.4 At 1 month after discharge | 1 | 44 | Mean Difference (IV, Fixed, 95% CI) | ‐0.11 [‐2.64, 2.42] |
| 13.5 At 6 months off training | 1 | 23 | Mean Difference (IV, Fixed, 95% CI) | 15.09 [6.01, 24.17] |
| 13.6 At 18 months off training | 1 | 20 | Mean Difference (IV, Fixed, 95% CI) | 9.10 [‐0.94, 19.14] |
| 13.7 Annual rate of change over 36 months | 1 | 65 | Mean Difference (IV, Fixed, 95% CI) | 2.17 [0.47, 3.87] |
| 14 Change in FEF25‐75 (% predicted) Show forest plot | 2 | Mean Difference (IV, Fixed, 95% CI) | Totals not selected | |
| 14.1 Annual rate of change | 1 | Mean Difference (IV, Fixed, 95% CI) | 0.0 [0.0, 0.0] | |
| 14.2 At 3 months | 1 | Mean Difference (IV, Fixed, 95% CI) | 0.0 [0.0, 0.0] | |
| 15 Change in RV/TLC (%) Show forest plot | 1 | Mean Difference (IV, Fixed, 95% CI) | Totals not selected | |
| 15.1 At 3 months | 1 | Mean Difference (IV, Fixed, 95% CI) | 0.0 [0.0, 0.0] | |
| 15.2 At 6 months | 1 | Mean Difference (IV, Fixed, 95% CI) | 0.0 [0.0, 0.0] | |
| 15.3 At 6 months off training | 1 | Mean Difference (IV, Fixed, 95% CI) | 0.0 [0.0, 0.0] | |
| 15.4 At 18 months off training | 1 | Mean Difference (IV, Fixed, 95% CI) | 0.0 [0.0, 0.0] | |
| 16 Change in FEV1/FVC (% predicted) Show forest plot | 1 | Mean Difference (IV, Fixed, 95% CI) | Totals not selected | |
| 16.1 At 3 months | 1 | Mean Difference (IV, Fixed, 95% CI) | 0.0 [0.0, 0.0] | |
| 17 Change in total physical activity (counts per min) Show forest plot | 1 | Mean Difference (IV, Fixed, 95% CI) | Totals not selected | |
| 17.1 At 3 months | 1 | Mean Difference (IV, Fixed, 95% CI) | 0.0 [0.0, 0.0] | |
| 17.2 At 6 months | 1 | Mean Difference (IV, Fixed, 95% CI) | 0.0 [0.0, 0.0] | |
| 17.3 At 6 months off training | 1 | Mean Difference (IV, Fixed, 95% CI) | 0.0 [0.0, 0.0] | |
| 17.4 At 18 months off training | 1 | Mean Difference (IV, Fixed, 95% CI) | 0.0 [0.0, 0.0] | |
| 18 Change in moderate‐to‐vigorous physical activity (hours per week) Show forest plot | 1 | Mean Difference (IV, Fixed, 95% CI) | Totals not selected | |
| 18.1 At 3 months | 1 | Mean Difference (IV, Fixed, 95% CI) | 0.0 [0.0, 0.0] | |
| 18.2 At 6 months | 1 | Mean Difference (IV, Fixed, 95% CI) | 0.0 [0.0, 0.0] | |
| 18.3 At 6 months off training | 1 | Mean Difference (IV, Fixed, 95% CI) | 0.0 [0.0, 0.0] | |
| 18.4 At 18 months off training | 1 | Mean Difference (IV, Fixed, 95% CI) | 0.0 [0.0, 0.0] | |
| 19 Change in total physical activity (MJ/day) Show forest plot | 1 | Mean Difference (IV, Fixed, 95% CI) | Totals not selected | |
| 19.1 At hospital discharge | 1 | Mean Difference (IV, Fixed, 95% CI) | 0.0 [0.0, 0.0] | |
| 20 Change in body weight (kg) Show forest plot | 1 | Mean Difference (IV, Fixed, 95% CI) | Totals not selected | |
| 20.1 At hospital discharge | 1 | Mean Difference (IV, Fixed, 95% CI) | 0.0 [0.0, 0.0] | |
| 20.2 At 1 month after discharge | 1 | Mean Difference (IV, Fixed, 95% CI) | 0.0 [0.0, 0.0] | |
| 21 Change in BMI (kg/m2) Show forest plot | 1 | Mean Difference (IV, Fixed, 95% CI) | Totals not selected | |
| 21.1 At 3 months | 1 | Mean Difference (IV, Fixed, 95% CI) | 0.0 [0.0, 0.0] | |
| 21.2 At 6 months | 1 | Mean Difference (IV, Fixed, 95% CI) | 0.0 [0.0, 0.0] | |
| 21.3 At 6 months off training | 1 | Mean Difference (IV, Fixed, 95% CI) | 0.0 [0.0, 0.0] | |
| 21.4 At 18 months off training | 1 | Mean Difference (IV, Fixed, 95% CI) | 0.0 [0.0, 0.0] | |
| 22 Change in BMI z score Show forest plot | 1 | Mean Difference (IV, Fixed, 95% CI) | Totals not selected | |
| 22.1 At 3 months | 1 | Mean Difference (IV, Fixed, 95% CI) | 0.0 [0.0, 0.0] | |
| 23 Change in fat‐free mass (kg) Show forest plot | 2 | Mean Difference (IV, Fixed, 95% CI) | Totals not selected | |
| 23.1 At hospital discharge | 1 | Mean Difference (IV, Fixed, 95% CI) | 0.0 [0.0, 0.0] | |
| 23.2 At 3 months | 1 | Mean Difference (IV, Fixed, 95% CI) | 0.0 [0.0, 0.0] | |
| 23.3 At 6 months | 1 | Mean Difference (IV, Fixed, 95% CI) | 0.0 [0.0, 0.0] | |
| 23.4 At 1 month after discharge | 1 | Mean Difference (IV, Fixed, 95% CI) | 0.0 [0.0, 0.0] | |
| 23.5 At 6 months off training | 1 | Mean Difference (IV, Fixed, 95% CI) | 0.0 [0.0, 0.0] | |
| 23.6 At 18 months off training | 1 | Mean Difference (IV, Fixed, 95% CI) | 0.0 [0.0, 0.0] | |
| 24 Change in body fat (%) Show forest plot | 1 | Mean Difference (IV, Fixed, 95% CI) | Totals not selected | |
| 24.1 At 3 months | 1 | Mean Difference (IV, Fixed, 95% CI) | 0.0 [0.0, 0.0] | |
| 24.2 At 6 months | 1 | Mean Difference (IV, Fixed, 95% CI) | 0.0 [0.0, 0.0] | |
| 24.3 At 6 months off training | 1 | Mean Difference (IV, Fixed, 95% CI) | 0.0 [0.0, 0.0] | |
| 24.4 At 18 months off training | 1 | Mean Difference (IV, Fixed, 95% CI) | 0.0 [0.0, 0.0] | |
| 25 Annual rate of change of ideal weight for height (%) Show forest plot | 1 | Mean Difference (IV, Fixed, 95% CI) | Totals not selected | |
| 26 Change in triceps skinfold thickness (mm) Show forest plot | 1 | Mean Difference (IV, Fixed, 95% CI) | Totals not selected | |
| 26.1 At 3 months | 1 | Mean Difference (IV, Fixed, 95% CI) | 0.0 [0.0, 0.0] | |
| 27 Change in arm muscle circumference (cm) Show forest plot | 1 | Mean Difference (IV, Fixed, 95% CI) | Totals not selected | |
| 27.1 At 3 months | 1 | Mean Difference (IV, Fixed, 95% CI) | 0.0 [0.0, 0.0] | |
| Outcome or subgroup title | No. of studies | No. of participants | Statistical method | Effect size |
| 1 Change in VO2 peak during maximal exercise (ml/min per kg BW) Show forest plot | 3 | Mean Difference (IV, Fixed, 95% CI) | Subtotals only | |
| 1.1 At hospital discharge | 1 | 44 | Mean Difference (IV, Fixed, 95% CI) | 1.95 [‐1.61, 5.51] |
| 1.2 At 1 month after discharge | 1 | 44 | Mean Difference (IV, Fixed, 95% CI) | ‐0.40 [‐4.03, 3.23] |
| 1.3 At 3 months | 2 | 41 | Mean Difference (IV, Fixed, 95% CI) | 5.54 [‐0.25, 11.34] |
| 1.4 At 6 months | 1 | 18 | Mean Difference (IV, Fixed, 95% CI) | 17.7 [5.98, 29.42] |
| 1.5 At 6 months off training | 1 | 16 | Mean Difference (IV, Fixed, 95% CI) | 11.59 [‐1.02, 24.20] |
| 1.6 At 18 months off training | 1 | 15 | Mean Difference (IV, Fixed, 95% CI) | 9.26 [‐4.26, 22.78] |
| 2 Change in FEV1 (% predicted) Show forest plot | 2 | Mean Difference (IV, Fixed, 95% CI) | Totals not selected | |
| 2.1 At hospital discharge | 1 | Mean Difference (IV, Fixed, 95% CI) | 0.0 [0.0, 0.0] | |
| 2.2 At 1 month after discharge | 1 | Mean Difference (IV, Fixed, 95% CI) | 0.0 [0.0, 0.0] | |
| 2.3 At 3 months | 1 | Mean Difference (IV, Fixed, 95% CI) | 0.0 [0.0, 0.0] | |
| 2.4 At 6 months | 1 | Mean Difference (IV, Fixed, 95% CI) | 0.0 [0.0, 0.0] | |
| 2.5 At 6 months off training | 1 | Mean Difference (IV, Fixed, 95% CI) | 0.0 [0.0, 0.0] | |
| 2.6 At 18 months off training | 1 | Mean Difference (IV, Fixed, 95% CI) | 0.0 [0.0, 0.0] | |
| 3 Change in HRQoL Show forest plot | 1 | Mean Difference (IV, Fixed, 95% CI) | Totals not selected | |
| 3.1 1 month after discharge | 1 | Mean Difference (IV, Fixed, 95% CI) | 0.0 [0.0, 0.0] | |
| 4 Change in HRQoL physical function (CF questionnaire) Show forest plot | 1 | Mean Difference (IV, Fixed, 95% CI) | Totals not selected | |
| 4.1 At 3 months | 1 | Mean Difference (IV, Fixed, 95% CI) | 0.0 [0.0, 0.0] | |
| 5 Change in peak power during WAnT (W) Show forest plot | 1 | Mean Difference (IV, Fixed, 95% CI) | Totals not selected | |
| 5.1 At 3 months | 1 | Mean Difference (IV, Fixed, 95% CI) | 0.0 [0.0, 0.0] | |
| 6 Change in mean power during WAnT (W) Show forest plot | 1 | Mean Difference (IV, Fixed, 95% CI) | Totals not selected | |
| 6.1 At 3 months | 1 | Mean Difference (IV, Fixed, 95% CI) | 0.0 [0.0, 0.0] | |
| 7 Change in mean power during WAnT (W per kg BW) Show forest plot | 1 | Mean Difference (IV, Fixed, 95% CI) | Totals not selected | |
| 7.1 At 3 months | 1 | Mean Difference (IV, Fixed, 95% CI) | 0.0 [0.0, 0.0] | |
| 7.2 At 6 months | 1 | Mean Difference (IV, Fixed, 95% CI) | 0.0 [0.0, 0.0] | |
| 7.3 At 6 months off training | 1 | Mean Difference (IV, Fixed, 95% CI) | 0.0 [0.0, 0.0] | |
| 7.4 At 18 months off training | 1 | Mean Difference (IV, Fixed, 95% CI) | 0.0 [0.0, 0.0] | |
| 8 Change in lower limb strength (Newton metres) Show forest plot | 1 | Mean Difference (IV, Fixed, 95% CI) | Totals not selected | |
| 8.1 At hospital discharge | 1 | Mean Difference (IV, Fixed, 95% CI) | 0.0 [0.0, 0.0] | |
| 8.2 At 1 month after discharge | 1 | Mean Difference (IV, Fixed, 95% CI) | 0.0 [0.0, 0.0] | |
| 9 Change in peak work capacity during maximal exercise (W) Show forest plot | 1 | Mean Difference (IV, Fixed, 95% CI) | Totals not selected | |
| 9.1 At 3 months | 1 | Mean Difference (IV, Fixed, 95% CI) | 0.0 [0.0, 0.0] | |
| 10 Change in peak work capacity during maximal exercise (W per kg body weight) Show forest plot | 1 | Mean Difference (IV, Fixed, 95% CI) | Totals not selected | |
| 10.1 At 3 months | 1 | Mean Difference (IV, Fixed, 95% CI) | 0.0 [0.0, 0.0] | |
| 10.2 At 6 months | 1 | Mean Difference (IV, Fixed, 95% CI) | 0.0 [0.0, 0.0] | |
| 10.3 At 6 months off training | 1 | Mean Difference (IV, Fixed, 95% CI) | 0.0 [0.0, 0.0] | |
| 10.4 At 18 months off training | 1 | Mean Difference (IV, Fixed, 95% CI) | 0.0 [0.0, 0.0] | |
| 11 Change in lactate during maximal exercise (mmol/L) Show forest plot | 1 | Mean Difference (IV, Fixed, 95% CI) | Totals not selected | |
| 11.1 At 3 months | 1 | Mean Difference (IV, Fixed, 95% CI) | 0.0 [0.0, 0.0] | |
| 12 Change in peak oxygen saturation during maximal exercise (%) Show forest plot | 1 | Mean Difference (IV, Fixed, 95% CI) | Totals not selected | |
| 12.1 At hospital discharge | 1 | Mean Difference (IV, Fixed, 95% CI) | 0.0 [0.0, 0.0] | |
| 13 Change in FVC (% predicted) Show forest plot | 2 | Mean Difference (IV, Fixed, 95% CI) | Totals not selected | |
| 13.1 At hospital discharge | 1 | Mean Difference (IV, Fixed, 95% CI) | 0.0 [0.0, 0.0] | |
| 13.2 At 3 months | 1 | Mean Difference (IV, Fixed, 95% CI) | 0.0 [0.0, 0.0] | |
| 13.3 At 6 months | 1 | Mean Difference (IV, Fixed, 95% CI) | 0.0 [0.0, 0.0] | |
| 13.4 At 1 month after discharge | 1 | Mean Difference (IV, Fixed, 95% CI) | 0.0 [0.0, 0.0] | |
| 13.5 At 6 months off training | 1 | Mean Difference (IV, Fixed, 95% CI) | 0.0 [0.0, 0.0] | |
| 13.6 At 18 months off training | 1 | Mean Difference (IV, Fixed, 95% CI) | 0.0 [0.0, 0.0] | |
| 14 Change in RV/TLC (%) Show forest plot | 1 | Mean Difference (IV, Fixed, 95% CI) | Totals not selected | |
| 14.1 At 3 months | 1 | Mean Difference (IV, Fixed, 95% CI) | 0.0 [0.0, 0.0] | |
| 14.2 At 6 months | 1 | Mean Difference (IV, Fixed, 95% CI) | 0.0 [0.0, 0.0] | |
| 14.3 At 6 months off training | 1 | Mean Difference (IV, Fixed, 95% CI) | 0.0 [0.0, 0.0] | |
| 14.4 At 18 months off training | 1 | Mean Difference (IV, Fixed, 95% CI) | 0.0 [0.0, 0.0] | |
| 15 Change in total physical activity (counts per min) Show forest plot | 1 | Mean Difference (IV, Fixed, 95% CI) | Totals not selected | |
| 15.1 At 3 months | 1 | Mean Difference (IV, Fixed, 95% CI) | 0.0 [0.0, 0.0] | |
| 15.2 At 6 months | 1 | Mean Difference (IV, Fixed, 95% CI) | 0.0 [0.0, 0.0] | |
| 15.3 At 6 months off training | 1 | Mean Difference (IV, Fixed, 95% CI) | 0.0 [0.0, 0.0] | |
| 15.4 At 18 months off training | 1 | Mean Difference (IV, Fixed, 95% CI) | 0.0 [0.0, 0.0] | |
| 16 Change in moderate to vigorous physical activity (hours per week) Show forest plot | 1 | Mean Difference (IV, Fixed, 95% CI) | Totals not selected | |
| 16.1 At 3 months | 1 | Mean Difference (IV, Fixed, 95% CI) | 0.0 [0.0, 0.0] | |
| 16.2 At 6 months | 1 | Mean Difference (IV, Fixed, 95% CI) | 0.0 [0.0, 0.0] | |
| 16.3 At 6 months off training | 1 | Mean Difference (IV, Fixed, 95% CI) | 0.0 [0.0, 0.0] | |
| 16.4 At 18 months off training | 1 | Mean Difference (IV, Fixed, 95% CI) | 0.0 [0.0, 0.0] | |
| 17 Change in physical activity (MJ/day) Show forest plot | 1 | Mean Difference (IV, Fixed, 95% CI) | Totals not selected | |
| 17.1 At hospital discharge | 1 | Mean Difference (IV, Fixed, 95% CI) | 0.0 [0.0, 0.0] | |
| 18 Change in weight (kg) Show forest plot | 1 | Mean Difference (IV, Fixed, 95% CI) | Totals not selected | |
| 18.1 At hospital discharge | 1 | Mean Difference (IV, Fixed, 95% CI) | 0.0 [0.0, 0.0] | |
| 18.2 At 1 month after discharge | 1 | Mean Difference (IV, Fixed, 95% CI) | 0.0 [0.0, 0.0] | |
| 19 Change in BMI (kg/m2) Show forest plot | 1 | Mean Difference (IV, Fixed, 95% CI) | Totals not selected | |
| 19.1 At 3 months | 1 | Mean Difference (IV, Fixed, 95% CI) | 0.0 [0.0, 0.0] | |
| 19.2 At 6 months | 1 | Mean Difference (IV, Fixed, 95% CI) | 0.0 [0.0, 0.0] | |
| 19.3 At 6 months off training | 1 | Mean Difference (IV, Fixed, 95% CI) | 0.0 [0.0, 0.0] | |
| 19.4 At 18 months off training | 1 | Mean Difference (IV, Fixed, 95% CI) | 0.0 [0.0, 0.0] | |
| 20 Change in fat‐free mass (kg) Show forest plot | 2 | Mean Difference (IV, Fixed, 95% CI) | Totals not selected | |
| 20.1 At hospital discharge | 1 | Mean Difference (IV, Fixed, 95% CI) | 0.0 [0.0, 0.0] | |
| 20.2 At 3 months | 1 | Mean Difference (IV, Fixed, 95% CI) | 0.0 [0.0, 0.0] | |
| 20.3 At 6 months | 1 | Mean Difference (IV, Fixed, 95% CI) | 0.0 [0.0, 0.0] | |
| 20.4 At 1 month after discharge | 1 | Mean Difference (IV, Fixed, 95% CI) | 0.0 [0.0, 0.0] | |
| 20.5 At 6 months off training | 1 | Mean Difference (IV, Fixed, 95% CI) | 0.0 [0.0, 0.0] | |
| 20.6 At 18 months off training | 1 | Mean Difference (IV, Fixed, 95% CI) | 0.0 [0.0, 0.0] | |
| 21 Change in body fat (%) Show forest plot | 1 | Mean Difference (IV, Fixed, 95% CI) | Totals not selected | |
| 21.1 At 3 months | 1 | Mean Difference (IV, Fixed, 95% CI) | 0.0 [0.0, 0.0] | |
| 21.2 At 6 months | 1 | Mean Difference (IV, Fixed, 95% CI) | 0.0 [0.0, 0.0] | |
| 21.3 At 6 months off training | 1 | Mean Difference (IV, Fixed, 95% CI) | 0.0 [0.0, 0.0] | |
| 21.4 At 18 months off training | 1 | Mean Difference (IV, Fixed, 95% CI) | 0.0 [0.0, 0.0] | |
| Outcome or subgroup title | No. of studies | No. of participants | Statistical method | Effect size |
| 1 Change in VO2 peak during maximal exercise (ml/min per kg BW) Show forest plot | 2 | Mean Difference (Fixed, 95% CI) | Totals not selected | |
| 1.1 At 12 weeks | 1 | Mean Difference (Fixed, 95% CI) | 0.0 [0.0, 0.0] | |
| 1.2 At 3 ‐ 6 months | 1 | Mean Difference (Fixed, 95% CI) | 0.0 [0.0, 0.0] | |
| 1.3 At 6 months off training | 1 | Mean Difference (Fixed, 95% CI) | 0.0 [0.0, 0.0] | |
| 1.4 At 12 ‐ 18 months off training | 1 | Mean Difference (Fixed, 95% CI) | 0.0 [0.0, 0.0] | |
| 2 Change in FEV1 (% predicted) Show forest plot | 3 | Mean Difference (IV, Fixed, 95% CI) | Totals not selected | |
| 2.1 At 12 weeks | 1 | Mean Difference (IV, Fixed, 95% CI) | 0.0 [0.0, 0.0] | |
| 2.2 At 3 months | 1 | Mean Difference (IV, Fixed, 95% CI) | 0.0 [0.0, 0.0] | |
| 2.3 At 3 ‐ 6 months | 1 | Mean Difference (IV, Fixed, 95% CI) | 0.0 [0.0, 0.0] | |
| 2.4 At 6 months off training | 1 | Mean Difference (IV, Fixed, 95% CI) | 0.0 [0.0, 0.0] | |
| 2.5 At 12 ‐ 18 months off training | 1 | Mean Difference (IV, Fixed, 95% CI) | 0.0 [0.0, 0.0] | |
| 3 Annual change in FEV1 (mL) Show forest plot | 1 | Mean Difference (Fixed, 95% CI) | Totals not selected | |
| 3.1 At 12 months | 1 | Mean Difference (Fixed, 95% CI) | 0.0 [0.0, 0.0] | |
| 4 Change in subjective health perception (CFQ‐R) Show forest plot | 1 | Mean Difference (Fixed, 95% CI) | Totals not selected | |
| 4.1 At 3 ‐ 6 months | 1 | Mean Difference (Fixed, 95% CI) | 0.0 [0.0, 0.0] | |
| 4.2 At 6 months off training | 1 | Mean Difference (Fixed, 95% CI) | 0.0 [0.0, 0.0] | |
| 4.3 At 12 ‐ 18 months off training | 1 | Mean Difference (Fixed, 95% CI) | 0.0 [0.0, 0.0] | |
| 5 Change in Quality of Life: CFQ‐R Show forest plot | 1 | Mean Difference (IV, Fixed, 95% CI) | Totals not selected | |
| 5.1 Physical Functioning at 12 weeks | 1 | Mean Difference (IV, Fixed, 95% CI) | 0.0 [0.0, 0.0] | |
| 5.2 Vitality at 12 weeks | 1 | Mean Difference (IV, Fixed, 95% CI) | 0.0 [0.0, 0.0] | |
| 5.3 Emotional state at 12 weeks | 1 | Mean Difference (IV, Fixed, 95% CI) | 0.0 [0.0, 0.0] | |
| 5.4 Eating disturbances at 12 weeks | 1 | Mean Difference (IV, Fixed, 95% CI) | 0.0 [0.0, 0.0] | |
| 5.5 Treatment burden at 12 weeks | 1 | Mean Difference (IV, Fixed, 95% CI) | 0.0 [0.0, 0.0] | |
| 5.6 Health perception at 12 weeks | 1 | Mean Difference (IV, Fixed, 95% CI) | 0.0 [0.0, 0.0] | |
| 5.7 Social limitations at 12 weeks | 1 | Mean Difference (IV, Fixed, 95% CI) | 0.0 [0.0, 0.0] | |
| 5.8 Body image at 12 weeks | 1 | Mean Difference (IV, Fixed, 95% CI) | 0.0 [0.0, 0.0] | |
| 5.9 Role limitations at 12 weeks | 1 | Mean Difference (IV, Fixed, 95% CI) | 0.0 [0.0, 0.0] | |
| 5.10 Weight problems at 12 weeks | 1 | Mean Difference (IV, Fixed, 95% CI) | 0.0 [0.0, 0.0] | |
| 5.11 Respiratory symptoms at 12 weeks | 1 | Mean Difference (IV, Fixed, 95% CI) | 0.0 [0.0, 0.0] | |
| 5.12 Digestion symptoms at 12 weeks | 1 | Mean Difference (IV, Fixed, 95% CI) | 0.0 [0.0, 0.0] | |
| 6 Change in peak power during WAnT (W per kg body weight) Show forest plot | 1 | Mean Difference (IV, Fixed, 95% CI) | Totals not selected | |
| 6.1 At 3 ‐ 6 months | 1 | Mean Difference (IV, Fixed, 95% CI) | 0.0 [0.0, 0.0] | |
| 6.2 At 6 months off training | 1 | Mean Difference (IV, Fixed, 95% CI) | 0.0 [0.0, 0.0] | |
| 6.3 At 12 ‐ 18 months off training | 1 | Mean Difference (IV, Fixed, 95% CI) | 0.0 [0.0, 0.0] | |
| 7 Change in mean power during WAnT (W per kg body weight) Show forest plot | 1 | Mean Difference (IV, Fixed, 95% CI) | Totals not selected | |
| 7.1 At 3 ‐ 6 months | 1 | Mean Difference (IV, Fixed, 95% CI) | 0.0 [0.0, 0.0] | |
| 7.2 At 6 months off training | 1 | Mean Difference (IV, Fixed, 95% CI) | 0.0 [0.0, 0.0] | |
| 7.3 At 12 ‐ 18 months off training | 1 | Mean Difference (IV, Fixed, 95% CI) | 0.0 [0.0, 0.0] | |
| 8 Change in muscle strength (all limbs) (1RM test) Show forest plot | 1 | Mean Difference (IV, Fixed, 95% CI) | Totals not selected | |
| 8.1 Right upper limb at 3 months | 1 | Mean Difference (IV, Fixed, 95% CI) | 0.0 [0.0, 0.0] | |
| 8.2 Left upper limb at 3 months | 1 | Mean Difference (IV, Fixed, 95% CI) | 0.0 [0.0, 0.0] | |
| 8.3 Right lower limb at 3 months | 1 | Mean Difference (IV, Fixed, 95% CI) | 0.0 [0.0, 0.0] | |
| 8.4 Left lower limb at 3 months | 1 | Mean Difference (IV, Fixed, 95% CI) | 0.0 [0.0, 0.0] | |
| 9 Change in muscular strength ‐ leg press (kg; 1 RM test) Show forest plot | 1 | Mean Difference (IV, Fixed, 95% CI) | Totals not selected | |
| 9.1 At 12 weeks | 1 | Mean Difference (IV, Fixed, 95% CI) | 0.0 [0.0, 0.0] | |
| 10 Change in Muscular Strength ‐ Chest press (kg; 1 RM test) Show forest plot | 1 | Mean Difference (IV, Fixed, 95% CI) | Totals not selected | |
| 10.1 At 12 weeks | 1 | Mean Difference (IV, Fixed, 95% CI) | 0.0 [0.0, 0.0] | |
| 11 Change in Muscular Strength ‐ Latpull down (kg; 1 RM test) Show forest plot | 1 | Mean Difference (IV, Fixed, 95% CI) | Totals not selected | |
| 11.1 At 12 weeks | 1 | Mean Difference (IV, Fixed, 95% CI) | 0.0 [0.0, 0.0] | |
| 12 Change in Muscular Strength ‐ Biceps curl (kg; RM test) Show forest plot | 1 | Mean Difference (IV, Fixed, 95% CI) | Totals not selected | |
| 12.1 At 12 weeks | 1 | Mean Difference (IV, Fixed, 95% CI) | 0.0 [0.0, 0.0] | |
| 13 Change in Muscular Endurance ‐ Number of push ups Show forest plot | 1 | Mean Difference (IV, Fixed, 95% CI) | Totals not selected | |
| 13.1 At 12 weeks | 1 | Mean Difference (IV, Fixed, 95% CI) | 0.0 [0.0, 0.0] | |
| 14 Change in Muscular Endurance ‐ Number of sit ups Show forest plot | 1 | Mean Difference (IV, Fixed, 95% CI) | Totals not selected | |
| 14.1 At 12 weeks | 1 | Mean Difference (IV, Fixed, 95% CI) | 0.0 [0.0, 0.0] | |
| 15 Change in Muscular Endurance ‐ Flexibility (cm) Show forest plot | 1 | Mean Difference (IV, Fixed, 95% CI) | Totals not selected | |
| 15.1 At 12 weeks | 1 | Mean Difference (IV, Fixed, 95% CI) | 0.0 [0.0, 0.0] | |
| 16 Change in Muscular Endurance ‐ hand grip strength (kg) Show forest plot | 1 | Mean Difference (IV, Fixed, 95% CI) | Totals not selected | |
| 16.1 At 12 weeks | 1 | Mean Difference (IV, Fixed, 95% CI) | 0.0 [0.0, 0.0] | |
| 17 Change in peak work capacity during maximal exercise (W per kg BW) Show forest plot | 1 | Mean Difference (Fixed, 95% CI) | Totals not selected | |
| 17.1 At 3 ‐ 6 months | 1 | Mean Difference (Fixed, 95% CI) | 0.0 [0.0, 0.0] | |
| 17.2 At 6 months off training | 1 | Mean Difference (Fixed, 95% CI) | 0.0 [0.0, 0.0] | |
| 17.3 At 12 ‐ 18 months off training | 1 | Mean Difference (Fixed, 95% CI) | 0.0 [0.0, 0.0] | |
| 18 Change in functional exercise capacity Show forest plot | 1 | Mean Difference (IV, Fixed, 95% CI) | Totals not selected | |
| 18.1 6MWT distance (m) at 3 months | 1 | Mean Difference (IV, Fixed, 95% CI) | 0.0 [0.0, 0.0] | |
| 18.2 6MWT distance (% predicted) at 3 months | 1 | Mean Difference (IV, Fixed, 95% CI) | 0.0 [0.0, 0.0] | |
| 19 Change in peak heart rate during 6MWT (beats/min) Show forest plot | 1 | Mean Difference (IV, Fixed, 95% CI) | Totals not selected | |
| 19.1 At 3 months | 1 | Mean Difference (IV, Fixed, 95% CI) | 0.0 [0.0, 0.0] | |
| 20 Annual change in peak heart rate (beat/min) Show forest plot | 1 | Mean Difference (Fixed, 95% CI) | Totals not selected | |
| 20.1 Constant load bicycle ergometry (at 1 year) | 1 | Mean Difference (Fixed, 95% CI) | 0.0 [0.0, 0.0] | |
| 20.2 Constant load arm ergometry (at 1 year) | 1 | Mean Difference (Fixed, 95% CI) | 0.0 [0.0, 0.0] | |
| 21 Annual change in VE (L/min) Show forest plot | 1 | Mean Difference (Fixed, 95% CI) | Totals not selected | |
| 21.1 Constant load bicycle ergometry (at 1 year) | 1 | Mean Difference (Fixed, 95% CI) | 0.0 [0.0, 0.0] | |
| 21.2 Constant load arm ergometry (at 1 year) | 1 | Mean Difference (Fixed, 95% CI) | 0.0 [0.0, 0.0] | |
| 22 Change in peak ventilation (VE) during maximal exercise Show forest plot | 1 | Mean Difference (IV, Fixed, 95% CI) | Totals not selected | |
| 22.1 At 12 weeks | 1 | Mean Difference (IV, Fixed, 95% CI) | 0.0 [0.0, 0.0] | |
| 23 Annual change in lactate (mmol/l) Show forest plot | 1 | Mean Difference (Fixed, 95% CI) | Totals not selected | |
| 23.1 Constant load bicycle ergometry (at 1 year) | 1 | Mean Difference (Fixed, 95% CI) | 0.0 [0.0, 0.0] | |
| 23.2 Constant load arm ergometry (at 1 year) | 1 | Mean Difference (Fixed, 95% CI) | 0.0 [0.0, 0.0] | |
| 24 Change in RR during 6MWT (breaths/min) Show forest plot | 1 | Mean Difference (IV, Fixed, 95% CI) | Totals not selected | |
| 24.1 At 3 months | 1 | Mean Difference (IV, Fixed, 95% CI) | 0.0 [0.0, 0.0] | |
| 25 Annual change in RR (breaths/min) Show forest plot | 1 | Mean Difference (Fixed, 95% CI) | Totals not selected | |
| 25.1 Constant load bicycle ergometry (at 1 year) | 1 | Mean Difference (Fixed, 95% CI) | 0.0 [0.0, 0.0] | |
| 25.2 Constant load arm ergometry (at 1 year) | 1 | Mean Difference (Fixed, 95% CI) | 0.0 [0.0, 0.0] | |
| 26 Annual change in RER Show forest plot | 1 | Mean Difference (Fixed, 95% CI) | Totals not selected | |
| 26.1 Constant load bicycle ergometry (at 1 year) | 1 | Mean Difference (Fixed, 95% CI) | 0.0 [0.0, 0.0] | |
| 26.2 Constant load arm ergometry (at 1 year) | 1 | Mean Difference (Fixed, 95% CI) | 0.0 [0.0, 0.0] | |
| 27 Change in oxygen saturation (%) Show forest plot | 1 | Mean Difference (IV, Fixed, 95% CI) | Totals not selected | |
| 27.1 At rest (at 3 months) | 1 | Mean Difference (IV, Fixed, 95% CI) | 0.0 [0.0, 0.0] | |
| 27.2 During 6MWT (at 3 months) | 1 | Mean Difference (IV, Fixed, 95% CI) | 0.0 [0.0, 0.0] | |
| 28 Change in Borg breathlessness score Show forest plot | 1 | Mean Difference (IV, Fixed, 95% CI) | Totals not selected | |
| 28.1 At rest (at 3 months) | 1 | Mean Difference (IV, Fixed, 95% CI) | 0.0 [0.0, 0.0] | |
| 28.2 During 6MWT (at 3 months) | 1 | Mean Difference (IV, Fixed, 95% CI) | 0.0 [0.0, 0.0] | |
| 29 Annual change in Borg breathlessness score Show forest plot | 1 | Mean Difference (Fixed, 95% CI) | Totals not selected | |
| 29.1 Constant load bicycle ergometry (at 1 year) | 1 | Mean Difference (Fixed, 95% CI) | 0.0 [0.0, 0.0] | |
| 29.2 Constant load arm ergometry (at 1 year) | 1 | Mean Difference (Fixed, 95% CI) | 0.0 [0.0, 0.0] | |
| 30 Change in Borg fatigue score Show forest plot | 1 | Mean Difference (IV, Fixed, 95% CI) | Totals not selected | |
| 30.1 At rest (at 3 months) | 1 | Mean Difference (IV, Fixed, 95% CI) | 0.0 [0.0, 0.0] | |
| 30.2 During 6MWT (at 3 months) | 1 | Mean Difference (IV, Fixed, 95% CI) | 0.0 [0.0, 0.0] | |
| 31 Annual change in Borg muscle effort Show forest plot | 1 | Mean Difference (Fixed, 95% CI) | Totals not selected | |
| 31.1 Constant load bicycle ergometry (at 1 year) | 1 | Mean Difference (Fixed, 95% CI) | 0.0 [0.0, 0.0] | |
| 31.2 Constant load arm ergometry (at 1 year) | 1 | Mean Difference (Fixed, 95% CI) | 0.0 [0.0, 0.0] | |
| 32 Change in FVC (% predicted) Show forest plot | 3 | Mean Difference (Fixed, 95% CI) | Totals not selected | |
| 32.1 At 12 weeks | 1 | Mean Difference (Fixed, 95% CI) | 0.0 [0.0, 0.0] | |
| 32.2 At 3 months | 1 | Mean Difference (Fixed, 95% CI) | 0.0 [0.0, 0.0] | |
| 32.3 At 3 ‐ 6 months | 1 | Mean Difference (Fixed, 95% CI) | 0.0 [0.0, 0.0] | |
| 32.4 At 6 months off training | 1 | Mean Difference (Fixed, 95% CI) | 0.0 [0.0, 0.0] | |
| 32.5 At 12 ‐ 18 months off training | 1 | Mean Difference (Fixed, 95% CI) | 0.0 [0.0, 0.0] | |
| 33 Annual change in FVC (mL) Show forest plot | 1 | Mean Difference (Fixed, 95% CI) | Totals not selected | |
| 33.1 At 1 year | 1 | Mean Difference (Fixed, 95% CI) | 0.0 [0.0, 0.0] | |
| 34 Change in RV/TLC (%) Show forest plot | 1 | Mean Difference (IV, Fixed, 95% CI) | Totals not selected | |
| 34.1 At 3 ‐ 6 months | 1 | Mean Difference (IV, Fixed, 95% CI) | 0.0 [0.0, 0.0] | |
| 34.2 At 6 months off training | 1 | Mean Difference (IV, Fixed, 95% CI) | 0.0 [0.0, 0.0] | |
| 34.3 At 12 ‐ 18 months off training | 1 | Mean Difference (IV, Fixed, 95% CI) | 0.0 [0.0, 0.0] | |
| 35 Change in Total Energy Expenditure (k/cal) Show forest plot | 1 | Mean Difference (IV, Fixed, 95% CI) | Totals not selected | |
| 35.1 At 12 weeks | 1 | Mean Difference (IV, Fixed, 95% CI) | 0.0 [0.0, 0.0] | |
| 36 Change in the Number of Steps Show forest plot | 1 | Mean Difference (IV, Fixed, 95% CI) | Totals not selected | |
| 36.1 At 12 weeks | 1 | Mean Difference (IV, Fixed, 95% CI) | 0.0 [0.0, 0.0] | |
| 37 Change in Physical Activity (%) Show forest plot | 1 | Mean Difference (IV, Fixed, 95% CI) | Totals not selected | |
| 37.1 At 12 weeks | 1 | Mean Difference (IV, Fixed, 95% CI) | 0.0 [0.0, 0.0] | |
| 38 Change in vigorous physical activity (hours per week) Show forest plot | 1 | Mean Difference (Fixed, 95% CI) | Totals not selected | |
| 38.1 At 3 ‐ 6 months | 1 | Mean Difference (Fixed, 95% CI) | 0.0 [0.0, 0.0] | |
| 38.2 At 6 months off training | 1 | Mean Difference (Fixed, 95% CI) | 0.0 [0.0, 0.0] | |
| 38.3 At 12 ‐ 18 months off training | 1 | Mean Difference (Fixed, 95% CI) | 0.0 [0.0, 0.0] | |
| 39 Change in body weight (kg) Show forest plot | 2 | Mean Difference (IV, Fixed, 95% CI) | Totals not selected | |
| 39.1 At 12 weeks | 1 | Mean Difference (IV, Fixed, 95% CI) | 0.0 [0.0, 0.0] | |
| 39.2 At 3 ‐ 6 months | 1 | Mean Difference (IV, Fixed, 95% CI) | 0.0 [0.0, 0.0] | |
| 39.3 At 6 months off training | 1 | Mean Difference (IV, Fixed, 95% CI) | 0.0 [0.0, 0.0] | |
| 39.4 At 12 ‐ 18 months off training | 1 | Mean Difference (IV, Fixed, 95% CI) | 0.0 [0.0, 0.0] | |
| 40 Change in BMI (kg/m2) Show forest plot | 3 | Mean Difference (Fixed, 95% CI) | Totals not selected | |
| 40.1 At 12 weeks | 1 | Mean Difference (Fixed, 95% CI) | 0.0 [0.0, 0.0] | |
| 40.2 At 3 ‐ 6 months | 1 | Mean Difference (Fixed, 95% CI) | 0.0 [0.0, 0.0] | |
| 40.3 Annual change | 1 | Mean Difference (Fixed, 95% CI) | 0.0 [0.0, 0.0] | |
| 40.4 At 6 months off training | 1 | Mean Difference (Fixed, 95% CI) | 0.0 [0.0, 0.0] | |
| 40.5 At 12 ‐ 18 months off training | 1 | Mean Difference (Fixed, 95% CI) | 0.0 [0.0, 0.0] | |
| 41 Change in sum of four skinfolds (mm) Show forest plot | 1 | Mean Difference (Fixed, 95% CI) | Totals not selected | |
| 41.1 At 3‐6 months | 1 | Mean Difference (Fixed, 95% CI) | 0.0 [0.0, 0.0] | |
| 41.2 At 6 months off training | 1 | Mean Difference (Fixed, 95% CI) | 0.0 [0.0, 0.0] | |
| 41.3 At 12‐18 months off training | 1 | Mean Difference (Fixed, 95% CI) | 0.0 [0.0, 0.0] | |
| 42 Change in body fat (%) Show forest plot | 2 | Mean Difference (Fixed, 95% CI) | Totals not selected | |
| 42.1 At 12 weeks | 1 | Mean Difference (Fixed, 95% CI) | 0.0 [0.0, 0.0] | |
| 42.2 At 3 ‐ 6 months | 1 | Mean Difference (Fixed, 95% CI) | 0.0 [0.0, 0.0] | |
| 42.3 At 6 months off training | 1 | Mean Difference (Fixed, 95% CI) | 0.0 [0.0, 0.0] | |
| 42.4 At 12 ‐ 18 months off training | 1 | Mean Difference (Fixed, 95% CI) | 0.0 [0.0, 0.0] | |
| 43 Change in fat‐mass (kg) Show forest plot | 1 | Mean Difference (IV, Fixed, 95% CI) | Totals not selected | |
| 43.1 At 12 weeks | 1 | Mean Difference (IV, Fixed, 95% CI) | 0.0 [0.0, 0.0] | |
| 44 Change in fat‐free mass (kg) Show forest plot | 2 | Mean Difference (IV, Fixed, 95% CI) | Totals not selected | |
| 44.1 At 12 weeks | 1 | Mean Difference (IV, Fixed, 95% CI) | 0.0 [0.0, 0.0] | |
| 44.2 At 3 ‐ 6 months | 1 | Mean Difference (IV, Fixed, 95% CI) | 0.0 [0.0, 0.0] | |
| 44.3 At 6 months off training | 1 | Mean Difference (IV, Fixed, 95% CI) | 0.0 [0.0, 0.0] | |
| 44.4 At 12 ‐ 18 months off training | 1 | Mean Difference (IV, Fixed, 95% CI) | 0.0 [0.0, 0.0] | |
| 45 Change in metabolic parameters (HbA1c (%)) Show forest plot | 1 | Mean Difference (IV, Fixed, 95% CI) | Totals not selected | |
| 45.1 At 12 weeks | 1 | Mean Difference (IV, Fixed, 95% CI) | 0.0 [0.0, 0.0] | |
| 46 Change in metabolic parameters (Glucose AUC) Show forest plot | 1 | Mean Difference (IV, Fixed, 95% CI) | Totals not selected | |
| 46.1 At 12 weeks | 1 | Mean Difference (IV, Fixed, 95% CI) | 0.0 [0.0, 0.0] | |
| 47 Change in metabolic parameters (Total Insulin AUC) Show forest plot | 1 | Mean Difference (IV, Fixed, 95% CI) | Totals not selected | |
| 47.1 At 12 weeks | 1 | Mean Difference (IV, Fixed, 95% CI) | 0.0 [0.0, 0.0] | |
| 48 Change in metabolic parameters (Insulin Sensitivity Index) Show forest plot | 1 | Mean Difference (IV, Fixed, 95% CI) | Totals not selected | |
| 48.1 At 12 weeks | 1 | Mean Difference (IV, Fixed, 95% CI) | 0.0 [0.0, 0.0] | |
| 49 Change in Plasma Glucose (mmol/L) Show forest plot | 1 | Mean Difference (IV, Fixed, 95% CI) | Totals not selected | |
| 49.1 After 0 minutes | 1 | Mean Difference (IV, Fixed, 95% CI) | 0.0 [0.0, 0.0] | |
| 49.2 After 30 minutes | 1 | Mean Difference (IV, Fixed, 95% CI) | 0.0 [0.0, 0.0] | |
| 49.3 After 60 minutes | 1 | Mean Difference (IV, Fixed, 95% CI) | 0.0 [0.0, 0.0] | |
| 49.4 After 90 minutes | 1 | Mean Difference (IV, Fixed, 95% CI) | 0.0 [0.0, 0.0] | |
| 49.5 After 120 minutes | 1 | Mean Difference (IV, Fixed, 95% CI) | 0.0 [0.0, 0.0] | |
| 50 Change in Plasma Insulin (µU/mL) Show forest plot | 1 | Mean Difference (IV, Fixed, 95% CI) | Totals not selected | |
| 50.1 After 0 minutes | 1 | Mean Difference (IV, Fixed, 95% CI) | 0.0 [0.0, 0.0] | |
| 50.2 After 30 minutes | 1 | Mean Difference (IV, Fixed, 95% CI) | 0.0 [0.0, 0.0] | |
| 50.3 After 60 minutes | 1 | Mean Difference (IV, Fixed, 95% CI) | 0.0 [0.0, 0.0] | |
| 50.4 After 90 minutes | 1 | Mean Difference (IV, Fixed, 95% CI) | 0.0 [0.0, 0.0] | |
| 50.5 After 120 minutes | 1 | Mean Difference (IV, Fixed, 95% CI) | 0.0 [0.0, 0.0] | |