Active chest compression‐decompression for cardiopulmonary resuscitation
Información
- DOI:
- https://doi.org/10.1002/14651858.CD002751.pub3Copiar DOI

- Base de datos:
-
- Cochrane Database of Systematic Reviews
- Versión publicada:
-
- 20 septiembre 2013see what's new
- Tipo:
-
- Intervention
- Etapa:
-
- Review
- Grupo Editorial Cochrane:
-
Grupo Cochrane de Corazón
- Copyright:
-
- Copyright © 2014 The Cochrane Collaboration. Published by John Wiley & Sons, Ltd.
Cifras del artículo
Altmetric:
Citado por:
Autores
Contributions of authors
Carmelo Lafuente‐Lafuente: conception and design of the review, draft of the protocol, search for primary studies, assessing papers for inclusion and quality, extracting data, analysis and interpretation of data, writing the review.
María Melero‐Bascones: draft of the protocol, screening search results, retrieval of papers, assessing papers for inclusion and quality, extracting data from papers, writing the review.
Sources of support
Internal sources
-
Complejo Hospitalario Universitario de Albacete, Spain.
-
Hôpital Charles Foix, groupe hospitalier Pitié‐Salpêtrière‐Charles Foix, Paris, France.
Allocating time to the main author to allow them to do this work
External sources
-
No sources of support supplied
Declarations of interest
None known.
Acknowledgements
Previous versions:
Professor Shah Ebrahim and Dr Jonathon Sterne made valuable comments.
Dr Plaisance helped us to locate primary studies.
Ms Margaret Burke updated our searches for primary studies.
Ms Theresa Moore reviewed and improved our English wording.
Current update:
We thank the Cochrane Heart Group for their support in updating this review (2013).
Version history
| Published | Title | Stage | Authors | Version |
| 2013 Sep 20 | Active chest compression‐decompression for cardiopulmonary resuscitation | Review | Carmelo Lafuente‐Lafuente, María Melero‐Bascones | |
| 2004 Oct 18 | Active chest compression‐decompression for cardiopulmonary resuscitation | Review | Carmelo Lafuente‐Lafuente, María Melero‐Bascones | |
| 2002 May 27 | Active chest compression‐decompression for cardiopulmonary resuscitation | Review | Carmelo Lafuente‐Lafuente, María Melero‐Bascones | |
Differences between protocol and review
There were none; we applied the protocol as initially defined.
Keywords
MeSH
Medical Subject Headings (MeSH) Keywords
Medical Subject Headings Check Words
Adult; Humans;

'Risk of bias' graph: review authors' judgements about each 'Risk of bias' item presented as percentages across all included studies
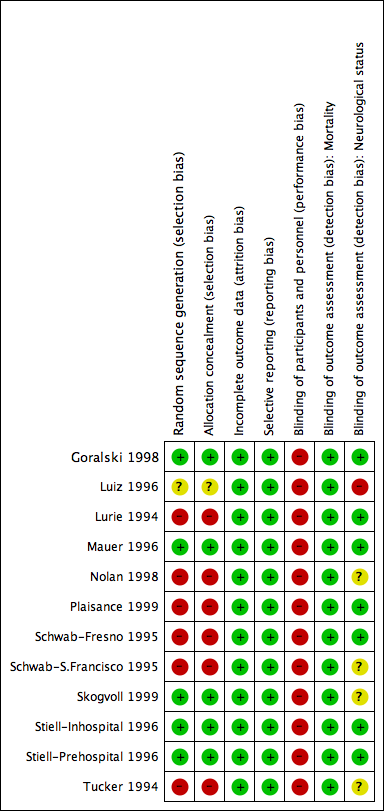
'Risk of bias' summary: review authors' judgements about each 'Risk of bias' item for each included study
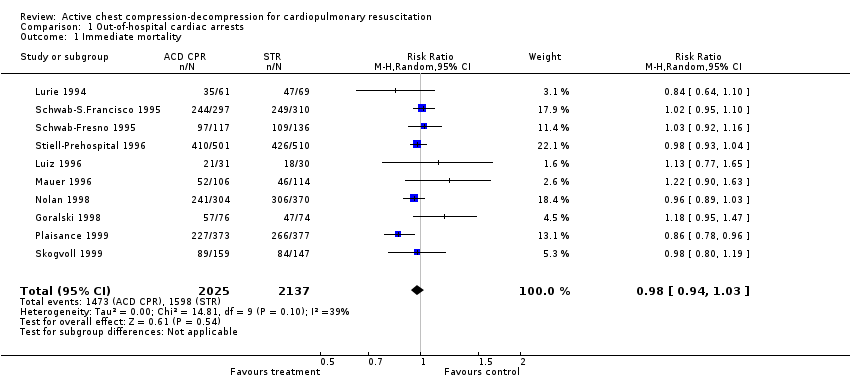
Comparison 1 Out‐of‐hospital cardiac arrests, Outcome 1 Immediate mortality.
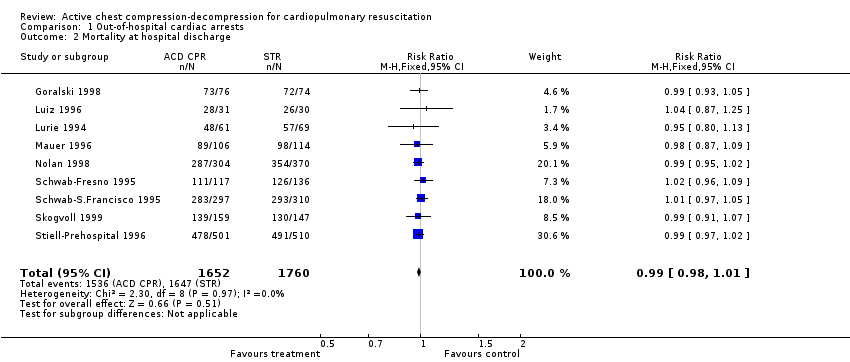
Comparison 1 Out‐of‐hospital cardiac arrests, Outcome 2 Mortality at hospital discharge.

Comparison 1 Out‐of‐hospital cardiac arrests, Outcome 3 Neurological impairment in survivors.

Comparison 1 Out‐of‐hospital cardiac arrests, Outcome 4 Complications.
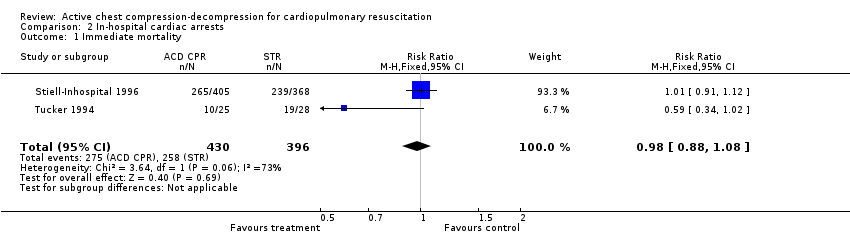
Comparison 2 In‐hospital cardiac arrests, Outcome 1 Immediate mortality.
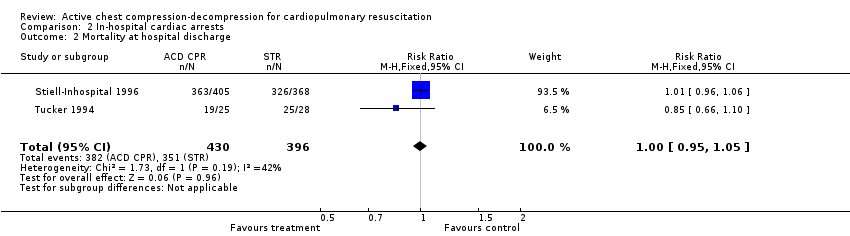
Comparison 2 In‐hospital cardiac arrests, Outcome 2 Mortality at hospital discharge.

Comparison 2 In‐hospital cardiac arrests, Outcome 3 Neurological impairment in survivors.

Comparison 2 In‐hospital cardiac arrests, Outcome 4 Complications.

Comparison 3 Subgroup analysis: physician in first responding team or only paramedics, Outcome 1 Immediate mortality.
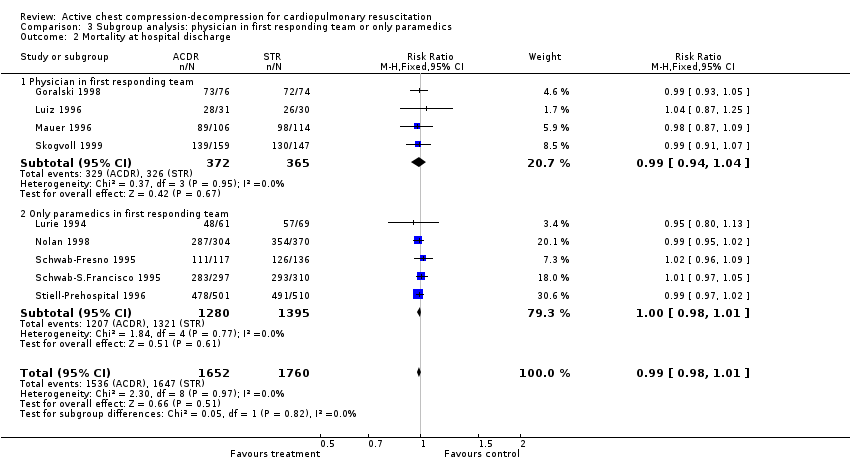
Comparison 3 Subgroup analysis: physician in first responding team or only paramedics, Outcome 2 Mortality at hospital discharge.

Comparison 3 Subgroup analysis: physician in first responding team or only paramedics, Outcome 3 Neurological impairment in survivors (any severity).

Comparison 4 Sensitivity analysis: best‐quality studies, Outcome 1 Immediate mortality.

Comparison 4 Sensitivity analysis: best‐quality studies, Outcome 2 Mortality at hospital discharge.

Comparison 4 Sensitivity analysis: best‐quality studies, Outcome 3 Neurological impairment in survivors (any severity).

Comparison 5 Sensitivity analysis: largest (n > 500) studies, Outcome 1 Immediate mortality.
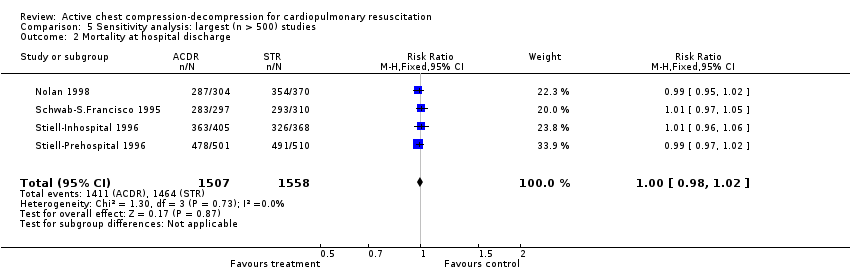
Comparison 5 Sensitivity analysis: largest (n > 500) studies, Outcome 2 Mortality at hospital discharge.

Comparison 5 Sensitivity analysis: largest (n > 500) studies, Outcome 3 Neurological impairment in survivors (any severity).
| Outcome or subgroup title | No. of studies | No. of participants | Statistical method | Effect size |
| 1 Immediate mortality Show forest plot | 10 | 4162 | Risk Ratio (M‐H, Random, 95% CI) | 0.98 [0.94, 1.03] |
| 2 Mortality at hospital discharge Show forest plot | 9 | 3412 | Risk Ratio (M‐H, Fixed, 95% CI) | 0.99 [0.98, 1.01] |
| 3 Neurological impairment in survivors Show forest plot | 5 | 358 | Risk Ratio (M‐H, Fixed, 95% CI) | 1.74 [1.06, 2.83] |
| 3.1 Moderate neurological impairment | 4 | 107 | Risk Ratio (M‐H, Fixed, 95% CI) | 0.98 [0.34, 2.79] |
| 3.2 Severe neurological impairment | 4 | 107 | Risk Ratio (M‐H, Fixed, 95% CI) | 3.11 [0.98, 9.83] |
| 3.3 Any neurological impairment (any severity) | 5 | 144 | Risk Ratio (M‐H, Fixed, 95% CI) | 1.71 [0.90, 3.25] |
| 4 Complications Show forest plot | 7 | 3032 | Risk Ratio (M‐H, Fixed, 95% CI) | 1.09 [0.86, 1.38] |
| Outcome or subgroup title | No. of studies | No. of participants | Statistical method | Effect size |
| 1 Immediate mortality Show forest plot | 2 | 826 | Risk Ratio (M‐H, Fixed, 95% CI) | 0.98 [0.88, 1.08] |
| 2 Mortality at hospital discharge Show forest plot | 2 | 826 | Risk Ratio (M‐H, Fixed, 95% CI) | 1.00 [0.95, 1.05] |
| 3 Neurological impairment in survivors Show forest plot | 2 | 279 | Risk Ratio (M‐H, Fixed, 95% CI) | 1.19 [0.63, 2.25] |
| 3.1 Moderate neurologic impairment | 2 | 93 | Risk Ratio (M‐H, Fixed, 95% CI) | 0.5 [0.10, 2.58] |
| 3.2 Severe neurologic impairment | 2 | 93 | Risk Ratio (M‐H, Fixed, 95% CI) | 1.95 [0.59, 6.50] |
| 3.3 Any neurological impairment (any severity) | 2 | 93 | Risk Ratio (M‐H, Fixed, 95% CI) | 1.19 [0.50, 2.86] |
| 4 Complications Show forest plot | 1 | 773 | Risk Ratio (M‐H, Fixed, 95% CI) | 0.97 [0.49, 1.93] |
| Outcome or subgroup title | No. of studies | No. of participants | Statistical method | Effect size |
| 1 Immediate mortality Show forest plot | 10 | 4162 | Risk Ratio (M‐H, Fixed, 95% CI) | 0.98 [0.94, 1.01] |
| 1.1 Physician in first responding team | 5 | 1487 | Risk Ratio (M‐H, Fixed, 95% CI) | 0.96 [0.89, 1.04] |
| 1.2 Only paramedics in first responding team | 5 | 2675 | Risk Ratio (M‐H, Fixed, 95% CI) | 0.98 [0.95, 1.02] |
| 2 Mortality at hospital discharge Show forest plot | 9 | 3412 | Risk Ratio (M‐H, Fixed, 95% CI) | 0.99 [0.98, 1.01] |
| 2.1 Physician in first responding team | 4 | 737 | Risk Ratio (M‐H, Fixed, 95% CI) | 0.99 [0.94, 1.04] |
| 2.2 Only paramedics in first responding team | 5 | 2675 | Risk Ratio (M‐H, Fixed, 95% CI) | 1.00 [0.98, 1.01] |
| 3 Neurological impairment in survivors (any severity) Show forest plot | 5 | 144 | Risk Ratio (M‐H, Fixed, 95% CI) | 1.71 [0.90, 3.25] |
| 3.1 Physician in first responding team | 2 | 44 | Risk Ratio (M‐H, Fixed, 95% CI) | 1.07 [0.41, 2.80] |
| 3.2 Only paramedics in first responding team | 3 | 100 | Risk Ratio (M‐H, Fixed, 95% CI) | 2.19 [0.93, 5.13] |
| Outcome or subgroup title | No. of studies | No. of participants | Statistical method | Effect size |
| 1 Immediate mortality Show forest plot | 12 | 4988 | Risk Ratio (M‐H, Fixed, 95% CI) | 0.98 [0.95, 1.01] |
| 1.1 Allocation concealment adequate | 5 | 2460 | Risk Ratio (M‐H, Fixed, 95% CI) | 1.01 [0.96, 1.06] |
| 1.2 Allocation concealment unclear | 1 | 61 | Risk Ratio (M‐H, Fixed, 95% CI) | 1.13 [0.77, 1.65] |
| 1.3 Allocation concealment inadequate | 6 | 2467 | Risk Ratio (M‐H, Fixed, 95% CI) | 0.94 [0.90, 0.99] |
| 2 Mortality at hospital discharge Show forest plot | 11 | 4238 | Risk Ratio (M‐H, Fixed, 95% CI) | 1.00 [0.98, 1.01] |
| 2.1 Allocation concealment adequate | 5 | 2460 | Risk Ratio (M‐H, Fixed, 95% CI) | 1.00 [0.97, 1.02] |
| 2.2 Allocation concealment unclear | 1 | 61 | Risk Ratio (M‐H, Fixed, 95% CI) | 1.04 [0.87, 1.25] |
| 2.3 Allocation concealment inadequate | 5 | 1717 | Risk Ratio (M‐H, Fixed, 95% CI) | 0.99 [0.97, 1.02] |
| 3 Neurological impairment in survivors (any severity) Show forest plot | 7 | 237 | Risk Ratio (M‐H, Fixed, 95% CI) | 1.50 [0.89, 2.51] |
| 3.1 Allocation concealment adequate | 3 | 163 | Risk Ratio (M‐H, Fixed, 95% CI) | 1.45 [0.75, 2.79] |
| 3.2 Allocation concealment unclear | 1 | 7 | Risk Ratio (M‐H, Fixed, 95% CI) | 0.89 [0.33, 2.37] |
| 3.3 Allocation concealment inadequate | 3 | 67 | Risk Ratio (M‐H, Fixed, 95% CI) | 2.09 [0.67, 6.54] |
| Outcome or subgroup title | No. of studies | No. of participants | Statistical method | Effect size |
| 1 Immediate mortality Show forest plot | 5 | 3815 | Risk Ratio (M‐H, Fixed, 95% CI) | 0.97 [0.93, 1.00] |
| 2 Mortality at hospital discharge Show forest plot | 4 | 3065 | Risk Ratio (M‐H, Fixed, 95% CI) | 1.00 [0.98, 1.02] |
| 3 Neurological impairment in survivors (any severity) Show forest plot | 3 | 159 | Risk Ratio (M‐H, Fixed, 95% CI) | 1.60 [0.81, 3.16] |