| 1 Total exacerbations per participant Show forest plot | 2 | 180 | Mean Difference (IV, Fixed, 95% CI) | ‐0.37 [‐0.64, ‐0.11] |
|
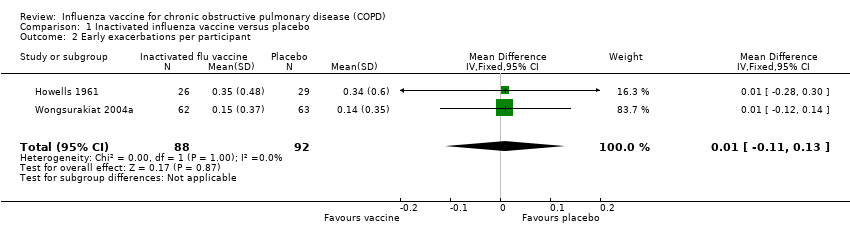
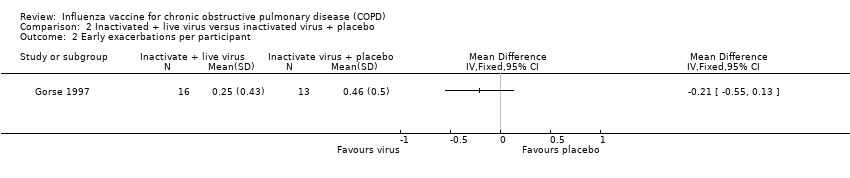
| 2 Early exacerbations per participant Show forest plot | 2 | 180 | Mean Difference (IV, Fixed, 95% CI) | 0.01 [‐0.11, 0.13] |
|
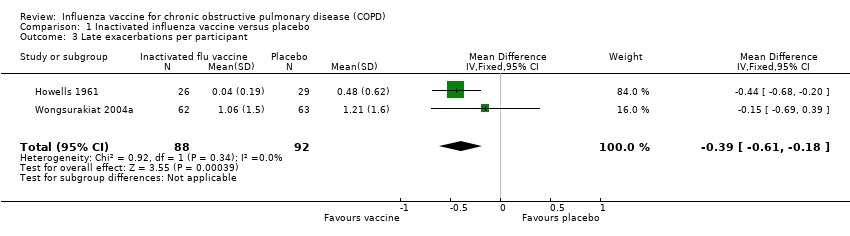
| 3 Late exacerbations per participant Show forest plot | 2 | 180 | Mean Difference (IV, Fixed, 95% CI) | ‐0.39 [‐0.61, ‐0.18] |
|
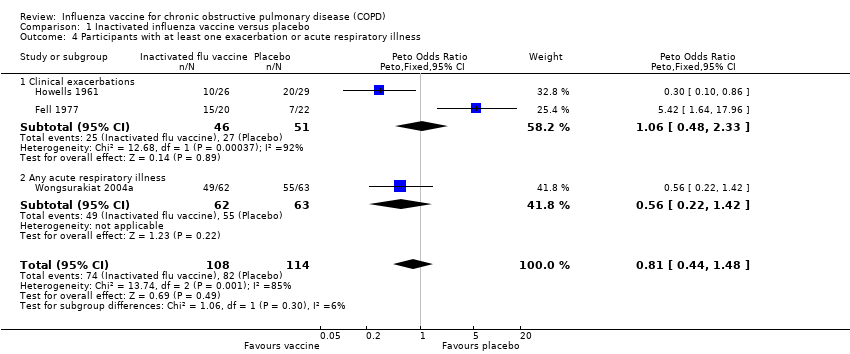
| 4 Participants with at least one exacerbation or acute respiratory illness Show forest plot | 3 | 222 | Peto Odds Ratio (Peto, Fixed, 95% CI) | 0.81 [0.44, 1.48] |
|
| 4.1 Clinical exacerbations | 2 | 97 | Peto Odds Ratio (Peto, Fixed, 95% CI) | 1.06 [0.48, 2.33] |
| 4.2 Any acute respiratory illness | 1 | 125 | Peto Odds Ratio (Peto, Fixed, 95% CI) | 0.56 [0.22, 1.42] |
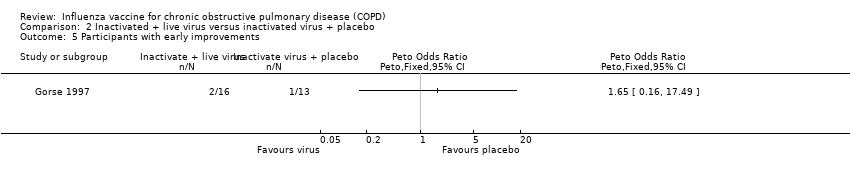
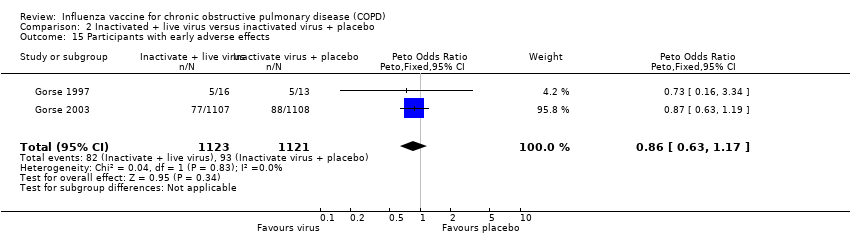
| 5 Participants with early exacerbations Show forest plot | 2 | 180 | Peto Odds Ratio (Peto, Fixed, 95% CI) | 1.08 [0.52, 2.26] |
|
| 6 Participants with late exacerbations Show forest plot | 1 | | Peto Odds Ratio (Peto, Fixed, 95% CI) | Totals not selected |
|
| 7 Hospital admissions Show forest plot | 2 | 180 | Peto Odds Ratio (Peto, Fixed, 95% CI) | 0.33 [0.09, 1.24] |
|
| 7.1 Clinical exacerbations | 1 | 55 | Peto Odds Ratio (Peto, Fixed, 95% CI) | 0.14 [0.01, 2.39] |
| 7.2 Influenza‐related exacerbations | 1 | 125 | Peto Odds Ratio (Peto, Fixed, 95% CI) | 0.41 [0.09, 1.89] |
| 8 Mortality (all cause) Show forest plot | 2 | 180 | Peto Odds Ratio (Peto, Fixed, 95% CI) | 0.87 [0.28, 2.70] |
|
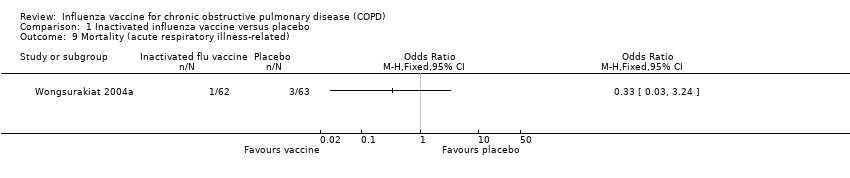
| 9 Mortality (acute respiratory illness‐related) Show forest plot | 1 | | Odds Ratio (M‐H, Fixed, 95% CI) | Totals not selected |
|
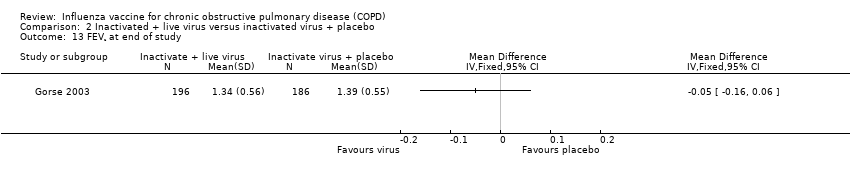
| 10 Overall change in lung function (FEV¹, L) Show forest plot | 1 | | Mean Difference (IV, Fixed, 95% CI) | Totals not selected |
|
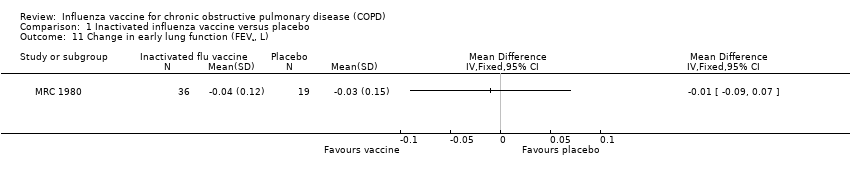
| 11 Change in early lung function (FEV¹, L) Show forest plot | 1 | | Mean Difference (IV, Fixed, 95% CI) | Totals not selected |
|
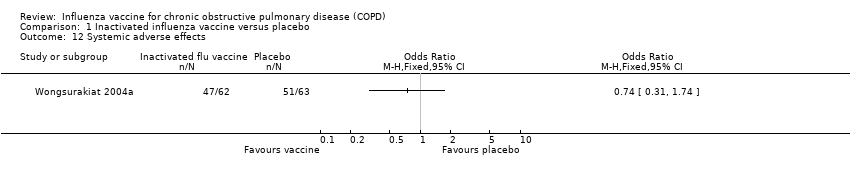
| 12 Systemic adverse effects Show forest plot | 1 | | Odds Ratio (M‐H, Fixed, 95% CI) | Totals not selected |
|
| 13 Local effects at injection site Show forest plot | 1 | | Odds Ratio (M‐H, Fixed, 95% CI) | Totals not selected |
|
| 14 Participants with early breathlessness Show forest plot | 1 | | Peto Odds Ratio (Peto, Fixed, 95% CI) | Totals not selected |
|
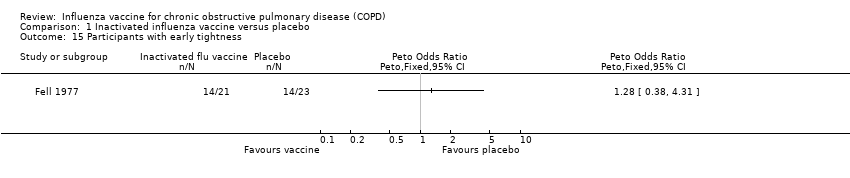
| 15 Participants with early tightness Show forest plot | 1 | | Peto Odds Ratio (Peto, Fixed, 95% CI) | Totals not selected |
|
| 16 Participants with early wheeze Show forest plot | 1 | | Peto Odds Ratio (Peto, Fixed, 95% CI) | Totals not selected |
|
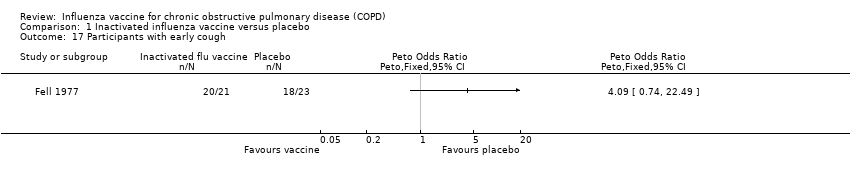
| 17 Participants with early cough Show forest plot | 1 | | Peto Odds Ratio (Peto, Fixed, 95% CI) | Totals not selected |
|
| 18 Acute respiratory illness subsequently documented as influenza‐related Show forest plot | 2 | 180 | Odds Ratio (M‐H, Fixed, 95% CI) | 0.19 [0.07, 0.48] |
|
| 18.1 FEV¹ ≥ 70% predicted | 1 | 45 | Odds Ratio (M‐H, Fixed, 95% CI) | 0.12 [0.01, 1.11] |
| 18.2 Participants with chronic bronchitis | 1 | 55 | Odds Ratio (M‐H, Fixed, 95% CI) | 0.19 [0.04, 0.96] |
| 18.3 FEV¹ < 50% predicted | 1 | 47 | Odds Ratio (M‐H, Fixed, 95% CI) | 0.11 [0.01, 0.99] |
| 18.4 FEV¹ 50% to 69% predicted | 1 | 33 | Odds Ratio (M‐H, Fixed, 95% CI) | 0.46 [0.07, 2.98] |
| 19 Early acute respiratory illness (ARI) Show forest plot | 1 | 250 | Odds Ratio (M‐H, Fixed, 95% CI) | 0.72 [0.34, 1.50] |
|
| 19.1 ARI within 1 week of vaccination | 1 | 125 | Odds Ratio (M‐H, Fixed, 95% CI) | 1.02 [0.24, 4.26] |
| 19.2 ARI between 1 and 4 weeks after vaccination | 1 | 125 | Odds Ratio (M‐H, Fixed, 95% CI) | 0.63 [0.27, 1.50] |
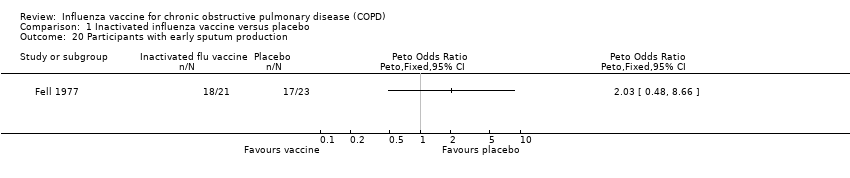
| 20 Participants with early sputum production Show forest plot | 1 | | Peto Odds Ratio (Peto, Fixed, 95% CI) | Totals not selected |
|