慢性阻塞性肺病的流感疫苗使用
Referencias
References to studies included in this review
References to studies excluded from this review
Additional references
References to other published versions of this review
Characteristics of studies
Characteristics of included studies [ordered by study ID]
Ir a:
| Methods | Duration: about 7 months Withdrawals: 8 volunteers were lost but none had experienced vaccination‐related complications. Follow‐up schedule: adverse reactions recorded on days 1 and 2 post vaccination. HAI antibody litres at 4 weeks compared after re‐vaccinations for a subgroup 5 months later. | |
| Participants | Setting: June to Nov 1976, Texas Medical Centre, USA Number: 413; 8 withdrawals; 348 in combined vaccine groups Characteristics: all participants were ambulatory and either older (> 50 years) or high‐risk adults. The average age was 64.3 (SD 7.3) years with 60.7% female participants. About 5% had lung disease, most of which was COPD. 35% were considered high‐risk, due to cardiovascular complications, chronic and underlying disease. Baseline characteristics: no details Comorbidities: no details Diagnostic criteria: over the age of 50 years, or adults with a chronic disorder that placed them at high risk for serious complications of influenza infection. Exclusion criteria: no details | |
| Interventions | Vaccination type: inactivated, bivalent influenza virus vaccine (A/New Jersey/76 and A/Victoria/75) in 200/200 or 400/400 CCA units, 0.5 mL dosage intramuscularly Vaccines were either subvirion or whole. Control: saline placebo, intramuscular, 0.5 mL dosage | |
| Outcomes | Early: days 1 and 2 post vaccination. Adverse effects were recorded as symptom scores, including systemic and local reactions. Serology; HAI antibody titres were performed at 4 weeks Late: HAI antibody titres performed again after revaccination in a subgroup, about 5 months later. | |
| Notes | Not specifically people with COPD | |
| Risk of bias | ||
| Bias | Authors' judgement | Support for judgement |
| Random sequence generation (selection bias) | Unclear risk | Quasi‐randomised |
| Allocation concealment (selection bias) | Unclear risk | Vaccines and placebo provided in randomly arranged coded sets of 10 dose vials, with a rotating sequence of administration |
| Blinding of participants and personnel (performance bias) | Unclear risk | Placebo controlled, but did not state if placebo identical‐looking |
| Blinding of outcome assessment (detection bias) | Unclear risk | Insufficient information to make determination |
| Incomplete outcome data (attrition bias) | Unclear risk | Eight volunteers lost to follow‐up reported as "none known to have had any unexpected complication from the vaccination." Further details were not provided |
| Selective reporting (reporting bias) | Unclear risk | No trial registry record available |
| Other bias | Unclear risk | Used volunteers and provided reimbursement to participants. None noted |
| Methods | Duration: 20 weeks Withdrawals: 1 (vaccinated participant developed pleuritic pain on day 14 of baseline) Follow‐up schedule: during exacerbations | |
| Participants | Setting: Nov 1975, group practice; Deddington, Oxfordshire, UK (non‐epidemic Number: 45 enrolled; 22 in vaccinated group, 23 in control. 1 vaccinated participant withdrew during baseline Characteristics: 28 men (64%) and the average age was 59.43 years. Baseline characteristics: Randomisation was unsuccessful in a number of areas; symptom scores of first 2 weeks after vaccination were used. The vaccinated group had greater symptom reports (not statistically significant) and lower mean PEFR. 19% of the vaccinated group had histories of asthma and 30% were on digoxin at entry, while none in the control had either. Over 60% of the vaccinated group had circulating HAI antibody against the Wellcome Research Laboratories (WRL) 105 strain before vaccination while less than 35% of the control did. Comorbidities: past history of asthma in 19% and use of digoxin in 30 % of vaccinated Diagnostic criteria: chronic bronchitis; 3 months productive cough annually for 3 years, MRC questionnaire completed. Severity of COPD unclear Exclusion criteria: none described | |
| Interventions | Vaccination type: live attenuated, WRL‐105 (A/Finland/4/74‐H3N2, A/Okuda/57‐H2N2), intranasal, 0.5 mL carrier, 0.25 per nostril. Control: placebo, freeze‐dried excipients of vaccine, indistinguishable by appearance or reconstitution | |
| Outcomes | Early: adverse effects in Weeks 1 and 2 recorded by guided participant self‐assessment, hospitalisation. Late: respiratory scores of adverse reactions greater than baseline, antibody responses to vaccination. | |
| Notes | Prescribed use of live vaccination but was a small study, conducted in a non‐ epidemic setting | |
| Risk of bias | ||
| Bias | Authors' judgement | Support for judgement |
| Random sequence generation (selection bias) | Unclear risk | Random allocation reported, however, no details regarding methods of randomisation reported |
| Allocation concealment (selection bias) | Unclear risk | Information not available |
| Blinding of participants and personnel (performance bias) | Low risk | Placebo controlled. "The freeze‐dried excipients of the vaccine were used as placebo, which was indistinguishable from vaccine in appearance or reconstitution characteristics." |
| Blinding of outcome assessment (detection bias) | Low risk | Participants completed self‐assessments but were blinded to intervention |
| Incomplete outcome data (attrition bias) | Low risk | Reported exclusion of one participant from analyses |
| Selective reporting (reporting bias) | Unclear risk | No trial registry record available |
| Other bias | Unclear risk | Insufficient information to make determination |
| Methods | Duration: 4 weeks Withdrawals: no details Follow‐up schedule: days 1 to 7 with immunological assays conducted on days 14 and 28 | |
| Participants | Setting: 1993 to 1994; Jefferson Barracks Division Nursing home, St Louis VA Medical Centre and at St Louis Altenheim nursing home, USA Number: 50; 25 in each of treatment and control groups Characteristics: older adults, chronically ill nursing home residents, 86% male, average age 74.95 years Baseline characteristics: generally comparable with average age in the treatment group being 74.3 (SE 1.6) years and 75.6 (SE 1.9) years in the control. 28% of the treatment group had lung conditions and 36% of the control. Levels of other Comorbidities, WBC counts, cholesterol, and pre‐vaccination serum HAI antibodies were similar Comorbidities: heart 64%, lung 32%, neurologic 84%, diabetes mellitus 40%, GI 30%, renal 24%, tobacco use 70%, alcohol use 62% Diagnostic criteria: older adults > 60 years, (32% with lung disease) Exclusion criteria: 1. history of hypersensitivity to influenza virus vaccines and eggs, 2. receipt of influenza vaccination less than 6 months prior to study, 3. incompetence to give written informed consent, 4. current administration of any antineoplastic chemotherapy, 5. hematologic malignancy not in remission, 6. blood haemoglobin levels less than 11 g/dL | |
| Interventions | Vaccination type: 1. Bivalent live attenuated influenza A virus vaccine (CAV) derived from cold‐adapted influenza A/Ann Arbor/6/60 (H2N2) and A/Kawasaki/9/86 (H1N1) and A/Beijing/353/89 (H3N2). Intranasal; 0.5 mL dose. 2. Trivalent inactivated subvirion influenza virus vaccine (TVV). The first 26 received A/Texas/36/91 (H1N1), A/Beijing/353/89 (H3N2), B/Panama/45/90. The next 26 received A/Texaz/36/91 (H1N1), A/Beijing/32/92 (H3N2), and B/Panama/45/90 Intramuscular Control: 1. Saline placebo intranasal 2. Trivalent inactivated influenza virus vaccines (TVV), Intramuscular, identical to vaccinated group | |
| Outcomes | Early: adverse effects; mild upper respiratory symptoms, transient mild pain, malaise, febrile illness. Serology; virus titres determined and levels of anti‐influenza A virus cytotoxic activity Late: serology, some adverse effects | |
| Notes | Not specifically COPD participants. There is a possible advantage of administering live attenuated with inactivated virus because in frail older people who have decreased immune responsiveness due to underlying disease, there is evidence of increased memory of anti‐influenza A virus cytotoxic T cell (CTL) activity. | |
| Risk of bias | ||
| Bias | Authors' judgement | Support for judgement |
| Random sequence generation (selection bias) | Unclear risk | Of each consecutive pair enrolled, one was assigned to intervention and one to control |
| Allocation concealment (selection bias) | Unclear risk | Insufficient information to make determination |
| Blinding of participants and personnel (performance bias) | Unclear risk | Placebo‐controlled. Same delivery method with participants and laboratory personnel blinded. See below — study nurse was unblinded |
| Blinding of outcome assessment (detection bias) | High risk | The nurse administering the immunisation was unblinded. This study nurse also "examined the vaccine injection site and evaluated the subjects for clinical signs and symptoms of influenza virus infection on 4 of the first 7 days, and 2 and 4 weeks after vaccination." |
| Incomplete outcome data (attrition bias) | Unclear risk | Reported that three participants could not be evaluated, but no further explanation given |
| Selective reporting (reporting bias) | Unclear risk | Insufficient information to make determination |
| Other bias | Unclear risk | Insufficient information to make determination |
| Methods | Randomisation: no details Allocation concealment: participants and study personnel were blinded but not the study nurse administering vaccines Outcome assessment was conducted under blind conditions. Duration: unclear, more than 28 days Withdrawals: none reported Follow‐up schedule: clinical evaluation 3 times between each of days 1 to 5, 7 to 10, 21 to 28 after immunisation | |
| Participants | Setting: 1994 to 1995 Number: 29; 16 in CAV/TVV group and 13 in TVV/placebo group Characteristics: the average age was 65.2 (SD 2.1) years. All male volunteers. Demographic characteristics and mean pre‐vaccination clinical lab tests were comparable; mean total WBC was 7710 (SD 298) cells/microL. Mean lymphocytes were 22.7% (SD 1.4) of total WBC. Mean serum albumin was 4.3 (SD 0.07) g/dL. Mean total cholesterol was 222.8 (SD 12.4) mg/dL. Baseline characteristics: demographics and lab results largely comparable. Proportions of participants with underlying medical illnesses comparable with the exception of higher proportion of liver disease in CAV/TVV group Comorbidities: 32% of CAV/TVV participants had underlying liver disease. Overall, other diseases were comparable; 21% renal, 66% heart disease, 38% neurologic, 21% diabetes mellitus. 97% of the participants reported having smoked tobacco products in the past. 90% reported having consumed alcohol in the past. Diagnostic criteria: COPD with severe obstruction to airflow on average and FEV1/FVC% < 70%. Medical history consisting of respiratory symptoms, physical examination and clinical lab tests were used. Exclusion criteria: | |
| Interventions | Vaccination type: 1. Bivalent live attenuated influenza virus vaccine (CAV) derived from cold‐adapted influenza A/Ann Arbor/6/60 (H2N2) and A/Kawasaki/9/86 (H1N1) and A/Beijing/353/89 (H3N2). Intranasal with 0.4 mL in each naris. 2.Trivalent inactivated subvirion influenza virus vaccine (TVV) — A/Texas/36/91 (H1N1), A/Shandong/9/93 (H3N2), B/Panama/4?/90. Intramuscular, 15 μg of HA from each of 3 strains per 0.5 mL dose. Control: | |
| Outcomes | Early: all measured 7 to 10 days after immunisation. Clinical status; pulmonary function using basic spirometry, measuring FEV1, FVC and FEV1/FVC %. Adverse symptoms such as cough, nasal congestion, runny nose, etc. Serology; levels of anti‐HA immunoglobulins in nasal washings Late: spirometry was repeated for those who reported changes in obstruction to airflow or respiratory symptoms at 7 to 10 days. | |
| Notes | To calculate standard deviations from continuous data, we assumed that only 1 exacerbation was experienced by each participant | |
| Risk of bias | ||
| Bias | Authors' judgement | Support for judgement |
| Random sequence generation (selection bias) | Unclear risk | Random allocation reported, however, no details regarding methods of randomisation reported |
| Allocation concealment (selection bias) | Unclear risk | Insufficient information to make determination |
| Blinding of participants and personnel (performance bias) | Unclear risk | Placebo‐controlled. Same delivery method with participants and laboratory personnel blinded. Study nurse was unblinded |
| Blinding of outcome assessment (detection bias) | Unclear risk | The nurse administering the immunisation was unblinded. Unclear who did the follow‐up checks on the days following vaccination |
| Incomplete outcome data (attrition bias) | Low risk | All vaccinated participants were evaluated and reported in the study results |
| Selective reporting (reporting bias) | Unclear risk | Insufficient information to make determination |
| Other bias | Unclear risk | Insufficient information to make determination |
| Methods | Duration: six + months | |
| Participants | Setting: Winter; USA; 1998 to1999; people with COPD meeting spirometric criteria for COPD from 20 VA Medical Centre sites Exclusion: allergic to vaccine components, received influenza vaccine less than six months previously, immunocompromised, cystic fibrosis, febrile illness 72 hours prior or exacerbation of COPD within 3 weeks prior, or history of Guillain–Barré syndrome Number: 2215; 1107 in intervention and 1108 in control group Age: 50 or over. Mean age 67.8 years, 98.2% male, 83.5% white, 95% had smoking history, 95% had comorbidity, mean FEV1 1.34 L, 42.6% predicted, FEV1/FVC 0.53 | |
| Interventions | Trivalent inactivated influenza virus vaccine (TVV) ‐A/Beijing/262/95‐like (H1N1), A/Sydney/5/97‐like (H3N2), B/Beijing/184/93; intramuscular into deltoid; 0.5 mL dose. Same lot in all participants. On same day, participants also received either: Intervention: Trivalent, types A and B, live cold adapted influenza virus vaccine (CAIV‐T) corresponding to the strains in the TVV, 0.25 mL per nostril, or Control: intranasal saline as a large particle aerosol | |
| Outcomes | Primary outcome:
Secondary outcomes:
Adverse reactions: early reactions monitored for 7 days using diary Additional outcome of chronic lung disease severity index (CLDSI) was reported in Gorse 2003a. | |
| Notes | ||
| Risk of bias | ||
| Bias | Authors' judgement | Support for judgement |
| Random sequence generation (selection bias) | Low risk | Random assignment 1:1, stratified by site |
| Allocation concealment (selection bias) | Unclear risk | Insufficient information to make determination |
| Blinding of participants and personnel (performance bias) | Unclear risk | Double‐blind, all participants received intramuscular vaccination; however, the method of intranasal delivery of intervention versus control was different |
| Blinding of outcome assessment (detection bias) | Unclear risk | Insufficient information to make determination |
| Incomplete outcome data (attrition bias) | Unclear risk | Insufficient information to make determination |
| Selective reporting (reporting bias) | Unclear risk | Insufficient information to make determination |
| Other bias | Unclear risk | Insufficient information to make determination |
| Methods | Duration: 5 months | |
| Participants | Setting: Winter 1991‐92, 15 General Practices in Southern Netherlands Number: 1838; 927 vaccinated and 911 in the control Characteristics: Baseline characteristics: similar ages, sex ratios, risk status, previous vaccination rates. 13.5%heart, 11.3% lung, 2.3% diabetes mellitus in the vaccine group and 13.6% heart, 10.4% lung, 2.2% diabetes mellitus in the control. 54.7% female in the vaccine group compared to 50.7% in the control Comorbidities: cardiological, pulmonary, and other metabolic Diagnostic criteria: over 60 years of age, with conditions, if present, that were not severe enough to necessitate mandatory vaccination; not specifically COPD Influenza diagnosed serologically, by a physician or by International Classification of Health Problems in Primary Care 2nd Edition (ICHPPC‐2) defined criteria Exclusion criteria: Other reasons for non‐participation included inability to consent and fear of injections | |
| Interventions | Vaccination type: Control: physiological saline placebo | |
| Outcomes | Early: none Late: mortality, exacerbation rates in the form of occurrence of influenza or influenza‐like illnesses, HAI antibody titres; adverse reactions assessed at week 4; local, systemic, subgroup analysis | |
| Notes | A subsequent report, Govaert 1994a was a sub‐study of this trial reported the adverse reactions; | |
| Risk of bias | ||
| Bias | Authors' judgement | Support for judgement |
| Random sequence generation (selection bias) | Low risk | Stratified randomisation schedule used with 4 strata according to each morbidity category |
| Allocation concealment (selection bias) | Low risk | At the vaccination session, the participant revealed a previously allocated study number to the vaccination team, which enabled allocation of the participant to the next consecutive number in the appropriate stratum. |
| Blinding of participants and personnel (performance bias) | Low risk | Placebo‐controlled using a 'visually' identical syringe |
| Blinding of outcome assessment (detection bias) | Low risk | Researchers blinded to vaccination status analysed questionnaires completed by the participants |
| Incomplete outcome data (attrition bias) | Low risk | Adequate reporting of participants lost to follow‐up. One death reported in the control group. Authors noted that participants with incomplete data were retained in the analyses where possible |
| Selective reporting (reporting bias) | Unclear risk | Insufficient information to make determination |
| Other bias | Unclear risk | Insufficient information to make determination |
| Methods | Duration: about 4 months Withdrawals: 1 (control group participant died during an acute exacerbation) Follow‐up schedule: initially at week 2, then every 4 weeks by both observers | |
| Participants | Setting: Winter 1960, NW Wolverhampton, UK Number: 55 enrolled; 26 in vaccinated group, 29 in control Characteristics: 37 men (67%) of average age 52.78 years (SD 12.51); overall average peak expiratory flow (PEF) was 270.09 L/min (SD111.88). The overall maximum breathing capacity was 64.33 L/min (SD 30.59) Baseline characteristics: Comorbidities: 7% of control were asthmatics Diagnostic criteria: chronic bronchitis; "a minimum of 3 years' history of cough with phlegm on most days for at least 3 months of the year...". Participants were assessed to enable placement into Grades 1, 2 or 3 with increasing severity. Exclusion criteria: people with Grade 4 bronchitis and TB | |
| Interventions | Vaccination type: Flubron (A.A2 Asian‐Formosa 7000, B England 5000), intramuscular Control: physiological saline solution | |
| Outcomes | Early: exacerbations in weeks 1 to 3 recorded by clinical examination and measurement of PEF. Bacteriological and complement fixation results for cause of exacerbations. Late: hospitalisation, mortality, as well as all early outcomes. | |
| Notes | We made an assumption for the number of early and late exacerbations per participant for the placebo group. We knew the total number of exacerbations was 24 experienced by 20 participants out of 29. Thus, there would have been at least 8 early and 10 late exacerbations, according to the numbers of participants experiencing exacerbations in the placebo group. We added 2 exacerbations to each group to make up the total of 24. We felt justified in doing so because the study stated that similar numbers of early exacerbations were recorded in both groups, which was the case using our assumption. | |
| Risk of bias | ||
| Bias | Authors' judgement | Support for judgement |
| Random sequence generation (selection bias) | Unclear risk | Insufficient information to make determination |
| Allocation concealment (selection bias) | Low risk | A key was provided by the statistical advisor to the nursing staff administering injections. |
| Blinding of participants and personnel (performance bias) | Low risk | Double‐blind; a nurse uninvolved in the conduct of the research study administered the vaccination |
| Blinding of outcome assessment (detection bias) | Low risk | No details of outcome assessment blinding |
| Incomplete outcome data (attrition bias) | Low risk | All participants described and accounted for in results. One death occurred in the control group |
| Selective reporting (reporting bias) | Unclear risk | Insufficient information to make determination |
| Other bias | Unclear risk | Insufficient information to make determination |
| Methods | Duration: unclear; more than 3 weeks Withdrawals: 16 participants from the Sheffield centre had no baseline recordings. 15 participants failed to complete all records (reasons not discussed) Follow‐up schedule: no details | |
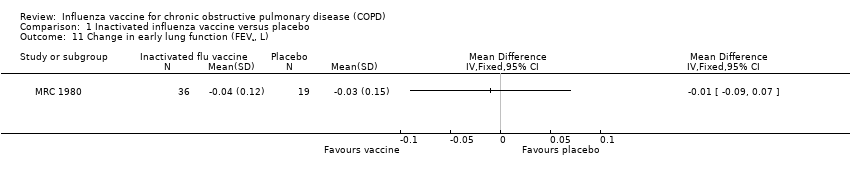
| Participants | Setting: no details Number: 86 to begin with, but 16 had no baseline data and 15 had incomplete records. Thus, only 55 included in final analysis, with 36 in the vaccinated group and 19 in the control Characteristics: age range of 28 to 78 years Baseline characteristics: none recorded Comorbidities: no details Diagnostic criteria: chronic bronchitis (MRC definition) and airways obstruction with an FEV1 > 1 L Exclusion criteria: cardiac disease symptoms and steroid treatment | |
| Interventions | Vaccination type: live attenuated, RIT 4050 (H2N3) vaccine virus; having surface antigens of the A/Victoria/75 virus in a lyophilised preparation; intranasal; 0.5 mL volume Control: placebo preparation without virus | |
| Outcomes | Early: 7 days post vaccination. Upper and lower respiratory symptoms, systemic symptoms Spirometry: MEFV curves used to determine V50, V75, EVC, PEFR, FEV1 Late: day 21; all self‐assessments, spirometry of early outcomes, and serology; HAI tests | |
| Notes | Standard errors of serologically negative and positive participants were averaged to calculate a standard deviation for all vaccinees according to the formula: | |
| Risk of bias | ||
| Bias | Authors' judgement | Support for judgement |
| Random sequence generation (selection bias) | Unclear risk | Insufficient information to make determination |
| Allocation concealment (selection bias) | Unclear risk | Insufficient information to make determination |
| Blinding of participants and personnel (performance bias) | Unclear risk | Insufficient information to make determination |
| Blinding of outcome assessment (detection bias) | Unclear risk | Insufficient information to make determination |
| Incomplete outcome data (attrition bias) | High risk | Eleven participants were vaccinated but excluded from the analyses; these originated from one study site |
| Selective reporting (reporting bias) | Unclear risk | Insufficient information to make determination |
| Other bias | Unclear risk | Insufficient information to make determination |
| Methods | Duration: 3 years Withdrawals: 8; 7 from intranasal group; deaths due to unrelated causes, discharges from institutions Follow‐up schedule: days 1 to 3 after each vaccination for adverse reactions and nasal sheddings; then daily staff nursing reports were used | |
| Participants | Setting: 1987‐90, 3 large nursing homes in Rochester, NY, USA; St Ann's Home, St John's Home and Monroe Community Hospital Number: 523; 345 participant years in the intranasal group and 346 participant years in the control Characteristics: older adults; Mean age of 84.2 years. 32% had cardiac or pulmonary conditions; 75% female Baseline characteristics: Comorbidities: only details of cardiovascular and pulmonary complications Diagnostic criteria: none; all residents at these institutions were invited Exclusion criteria:
| |
| Interventions | Vaccination type:
Control:
| |
| Outcomes | Early: days 1 to 3 post vaccination; adverse effects Late: years 1, 2, 3: serum antibody responses measured and occurrence of respiratory and flu‐like illnesses were measured to evaluate the efficacy of adding live intranasal vaccination to the inactivated type | |
| Notes | Not specifically people with COPD | |
| Risk of bias | ||
| Bias | Authors' judgement | Support for judgement |
| Random sequence generation (selection bias) | Unclear risk | Insufficient details on randomisation sequence provided. Re‐randomisation occurred every year |
| Allocation concealment (selection bias) | Unclear risk | Insufficient information to make determination |
| Blinding of participants and personnel (performance bias) | Unclear risk | Insufficient detail provided, although it is stated that this study was double‐blind |
| Blinding of outcome assessment (detection bias) | Unclear risk | See above |
| Incomplete outcome data (attrition bias) | Low risk | A low number of dropouts reported per year, evenly across groups. Independent analysis each study year |
| Selective reporting (reporting bias) | Unclear risk | Insufficient information to make determination |
| Other bias | Unclear risk | Insufficient information to make determination |
| Methods | Duration: at least 4 weeks Withdrawals: no details Follow‐up schedule: early symptoms at days 3 to 4, serologic testing at 4 weeks post vaccination | |
| Participants | Setting: outpatient clinics of Strong Memorial Hospital; Rochester, NY and a private practice, USA Number: 81; 34 in the live attenuated vaccination group, 30 in the inactivated vaccination group and 11 in the control Characteristics: older adults (> 65 years) and chronically ill, 65% female Baseline characteristics: distributions of chronic conditions, smokers and mean ages were roughly similar. 18% of the live vaccinated group had chronic lung disorders, and had a mean age of 68.9 years. Comorbidities: chronic cardiac, pulmonary, endocrine, hematologic conditions, 25% smokers Diagnostic criteria: ambulatory adults over 65 years, or with at least 1 high risk condition Exclusion criteria: no details | |
| Interventions | Vaccination type: Control: placebo; intramuscular saline and intranasal veal infusion broth | |
| Outcomes | Early: 3 to 4 days post vaccination; pulse oximetry, spirometry, virus cultures and HAI tests; symptoms for 7 days (upper and lower respiratory tract symptoms, systemic) Late: serology repeated at week 4, hospitalisations | |
| Notes | Cold adapted, live attenuated influenza B vaccines are safe but not as immunogenic as inactivated ones in chronically ill or older people. There were no significant differences between the groups in outcomes of spirometry and adverse effects. Author provided individual participant data. | |
| Risk of bias | ||
| Bias | Authors' judgement | Support for judgement |
| Random sequence generation (selection bias) | Unclear risk | No further details other than 'randomly assigned' |
| Allocation concealment (selection bias) | Unclear risk | Insufficient information to make determination |
| Blinding of participants and personnel (performance bias) | Unclear risk | This study was double‐blind, however, methods were not described in any more detail. |
| Blinding of outcome assessment (detection bias) | Unclear risk | See above |
| Incomplete outcome data (attrition bias) | Low risk | No missing data or withdrawals reported |
| Selective reporting (reporting bias) | Unclear risk | Insufficient information to make determination |
| Other bias | Unclear risk | Insufficient information to make determination |
| Methods | Duration: 1 year. Withdrawals: 3 dropouts (1 vaccine, 2 control). Deaths 8 (5 vaccine, 3 control) all died from causes not related to acute respiratory infection Follow‐up schedule: reviewed monthly. Bloods taken at week 0, week 4, and 6 and 12 months; participants reported acute respiratory infections, and had extra visit for full assessment, including the taking of acute and convalescent serum 4 to 6 weeks later. If respiratory infection presented for less than 6 days, swabs taken | |
| Participants | Setting: 1997‐8. Thailand, university hospital, COPD outpatient clinic; non‐influenza epidemic years in Thailand Number: 132 consecutive outpatients. 7 excluded as couldn't attend, making 125 in total, 62 in vaccine group and 63 in control group Inclusion: clinical COPD (COPD not defined although managed according to Thai guidelines), FEV1 < 70% and < 15% increase after bronchodilator Exclusions: egg allergy, immunocompromised, immunosuppressive drugs (except corticosteroids), or if comorbidities expected to reduce survival to < 1 year Characteristics: mean age 68.3 years, 94% male, 96% smoking history, 37% FEV1 < 50%, 44% FEV1 > 70%, 33% with comorbidities | |
| Interventions | Vaccination type: purified trivalent split‐virus vaccine A/Texas/36/91 (H1N1), ANanchang/933/95 (H3N2), B/Harbin/07/94. 0.5 mL on Day 1 and a second dose at 4 weeks; two‐dose schedule given as first time that influenza vaccine available in Thailand. Control was 0.5 mL of Vitamin B1 | |
| Outcomes | Acute respiratory infections, antibody responses to vaccination and to acute respiratory infections (by HAI test), allowing classification of whether the infection was influenza‐related Clinical classification of ARI into common cold, acute exacerbation, influenza‐like illness, or pneumonia. Severity recorded; hospitalisation, ventilation, and stratified by COPD severity Adverse effects recorded carefully for 4 weeks after vaccination | |
| Notes | ||
| Risk of bias | ||
| Bias | Authors' judgement | Support for judgement |
| Random sequence generation (selection bias) | Low risk | Particpants stratified based on disease severity and numbered consecutively. These numerical identifiers had been previously randomised to either intervention or placebo. |
| Allocation concealment (selection bias) | Low risk | A nurse not involved in participant care determined which numerical identifier was allocated to intervention or placebo. |
| Blinding of participants and personnel (performance bias) | Low risk | Double‐blind, placebo controlled. Both vaccine and placebo were same volume and quantity, administered to all participants. |
| Blinding of outcome assessment (detection bias) | Unclear risk | Insufficient information to make determination |
| Incomplete outcome data (attrition bias) | Low risk | Study clearly outlines exclusions and dropouts; dropouts were very similar for both groups. |
| Selective reporting (reporting bias) | Unclear risk | Insufficient information to make determination |
| Other bias | Unclear risk | Insufficient information to make determination |
ARI: acute respiratory infection; CAIV‐T: live cold adapted influenza virus vaccine; CAV: live attenuated influenza A virus vaccine derived from cold‐adapted influenza; CCA: chicken cell agglutinating; CLDSI: chronic lung disease severity index; COPD: chronic obstructive pulmonary disease; FEV1: forced expiratory volume in one second; FVC: force vital capacity; HAI: hemagglutination inhibition; ICHPPC‐2: International Classification of Health Problems in Primary Care; ILI: influenza‐like illness; IM: intramuscular; LDI: laboratory‐documented influenza; MD: mean difference; MEFV: maximum expiratory flow ‐ volume curve; MRC: Medical Research Council; PEFR: peak expiratory flow rate; SD: standard deviation; TB: tuberculosis; TVV: trivalent inactivated influenza virus vaccine; USA: United States of America; UK: United Kingdom; VAS: visual analogue scale; V50: air flow rate at 50% vital capacity; V75: air flow rate at 75% vital capacity; WBC: white blood cells.
Characteristics of excluded studies [ordered by study ID]
Ir a:
| Study | Reason for exclusion |
| Not placebo controlled and not COPD specific | |
| Add‐on benefit of bacterial immunostimulant is being assessed | |
| Not RCT, people with obstructive airways disease are only a small subgroup | |
| Live and inactivated virus vaccines used without placebo as a control, not randomised | |
| Serological results only; no primary outcomes suitable for this review | |
| No randomisation of people with COPD. | |
| Serological outcomes only, no primary outcomes suitable for this review | |
| No randomisation of older participants with lung disease | |
| Healthy adults susceptible to virus vaccine were used | |
| Serological outcomes only; no primary outcomes suitable for this review, unclear if this is an RCT from the abstract. We were unable to retrieve the full paper. | |
| Randomised survey with a lung disease component but not placebo controlled | |
| 3 inactivated vaccines used without placebo as a control | |
| Not randomised for people with COPD. | |
| Not RCT | |
| Not RCT, serological outcomes only; no primary outcomes suitable for this review | |
| Healthy older adults used | |
| Not RCT | |
| Retrospective cohort study , not COPD | |
| Older and high risk participants but no details of COPD or any other lung disease | |
| No randomisation of chronic bronchitis |
Data and analyses
| Outcome or subgroup title | No. of studies | No. of participants | Statistical method | Effect size |
| 1 Total exacerbations per participant Show forest plot | 2 | 180 | Mean Difference (IV, Fixed, 95% CI) | ‐0.37 [‐0.64, ‐0.11] |
| Analysis 1.1  Comparison 1 Inactivated influenza vaccine versus placebo, Outcome 1 Total exacerbations per participant. | ||||
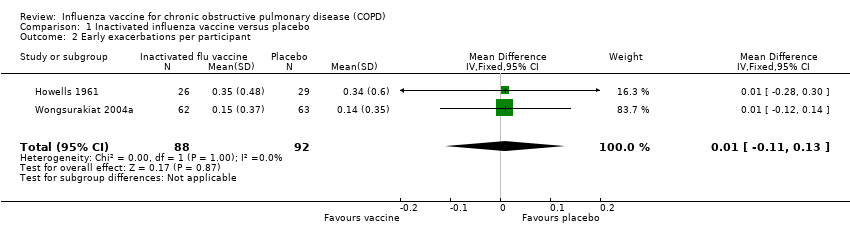
| 2 Early exacerbations per participant Show forest plot | 2 | 180 | Mean Difference (IV, Fixed, 95% CI) | 0.01 [‐0.11, 0.13] |
| Analysis 1.2  Comparison 1 Inactivated influenza vaccine versus placebo, Outcome 2 Early exacerbations per participant. | ||||
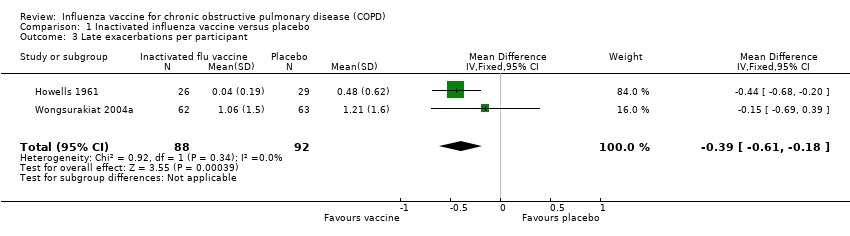
| 3 Late exacerbations per participant Show forest plot | 2 | 180 | Mean Difference (IV, Fixed, 95% CI) | ‐0.39 [‐0.61, ‐0.18] |
| Analysis 1.3  Comparison 1 Inactivated influenza vaccine versus placebo, Outcome 3 Late exacerbations per participant. | ||||
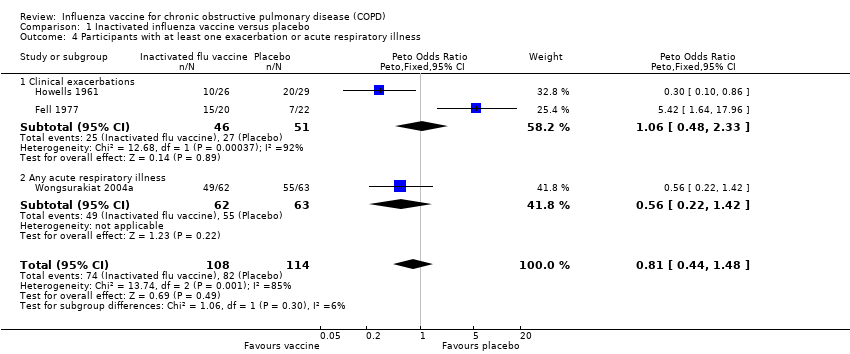
| 4 Participants with at least one exacerbation or acute respiratory illness Show forest plot | 3 | 222 | Peto Odds Ratio (Peto, Fixed, 95% CI) | 0.81 [0.44, 1.48] |
| Analysis 1.4  Comparison 1 Inactivated influenza vaccine versus placebo, Outcome 4 Participants with at least one exacerbation or acute respiratory illness. | ||||
| 4.1 Clinical exacerbations | 2 | 97 | Peto Odds Ratio (Peto, Fixed, 95% CI) | 1.06 [0.48, 2.33] |
| 4.2 Any acute respiratory illness | 1 | 125 | Peto Odds Ratio (Peto, Fixed, 95% CI) | 0.56 [0.22, 1.42] |
| 5 Participants with early exacerbations Show forest plot | 2 | 180 | Peto Odds Ratio (Peto, Fixed, 95% CI) | 1.08 [0.52, 2.26] |
| Analysis 1.5  Comparison 1 Inactivated influenza vaccine versus placebo, Outcome 5 Participants with early exacerbations. | ||||
| 6 Participants with late exacerbations Show forest plot | 1 | Peto Odds Ratio (Peto, Fixed, 95% CI) | Totals not selected | |
| Analysis 1.6  Comparison 1 Inactivated influenza vaccine versus placebo, Outcome 6 Participants with late exacerbations. | ||||
| 7 Hospital admissions Show forest plot | 2 | 180 | Peto Odds Ratio (Peto, Fixed, 95% CI) | 0.33 [0.09, 1.24] |
| Analysis 1.7  Comparison 1 Inactivated influenza vaccine versus placebo, Outcome 7 Hospital admissions. | ||||
| 7.1 Clinical exacerbations | 1 | 55 | Peto Odds Ratio (Peto, Fixed, 95% CI) | 0.14 [0.01, 2.39] |
| 7.2 Influenza‐related exacerbations | 1 | 125 | Peto Odds Ratio (Peto, Fixed, 95% CI) | 0.41 [0.09, 1.89] |
| 8 Mortality (all cause) Show forest plot | 2 | 180 | Peto Odds Ratio (Peto, Fixed, 95% CI) | 0.87 [0.28, 2.70] |
| Analysis 1.8  Comparison 1 Inactivated influenza vaccine versus placebo, Outcome 8 Mortality (all cause). | ||||
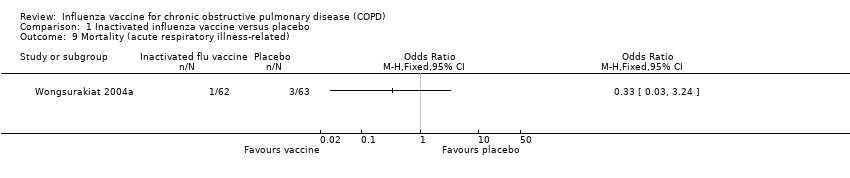
| 9 Mortality (acute respiratory illness‐related) Show forest plot | 1 | Odds Ratio (M‐H, Fixed, 95% CI) | Totals not selected | |
| Analysis 1.9  Comparison 1 Inactivated influenza vaccine versus placebo, Outcome 9 Mortality (acute respiratory illness‐related). | ||||
| 10 Overall change in lung function (FEV¹, L) Show forest plot | 1 | Mean Difference (IV, Fixed, 95% CI) | Totals not selected | |
| Analysis 1.10  Comparison 1 Inactivated influenza vaccine versus placebo, Outcome 10 Overall change in lung function (FEV¹, L). | ||||
| 11 Change in early lung function (FEV¹, L) Show forest plot | 1 | Mean Difference (IV, Fixed, 95% CI) | Totals not selected | |
| Analysis 1.11  Comparison 1 Inactivated influenza vaccine versus placebo, Outcome 11 Change in early lung function (FEV¹, L). | ||||
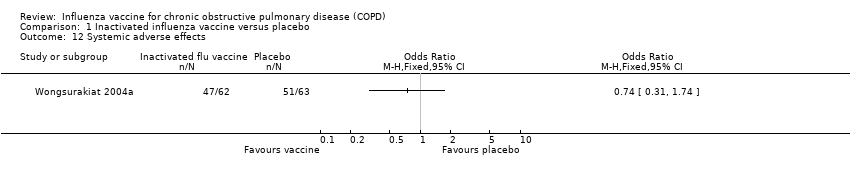
| 12 Systemic adverse effects Show forest plot | 1 | Odds Ratio (M‐H, Fixed, 95% CI) | Totals not selected | |
| Analysis 1.12  Comparison 1 Inactivated influenza vaccine versus placebo, Outcome 12 Systemic adverse effects. | ||||
| 13 Local effects at injection site Show forest plot | 1 | Odds Ratio (M‐H, Fixed, 95% CI) | Totals not selected | |
| Analysis 1.13  Comparison 1 Inactivated influenza vaccine versus placebo, Outcome 13 Local effects at injection site. | ||||
| 14 Participants with early breathlessness Show forest plot | 1 | Peto Odds Ratio (Peto, Fixed, 95% CI) | Totals not selected | |
| Analysis 1.14  Comparison 1 Inactivated influenza vaccine versus placebo, Outcome 14 Participants with early breathlessness. | ||||
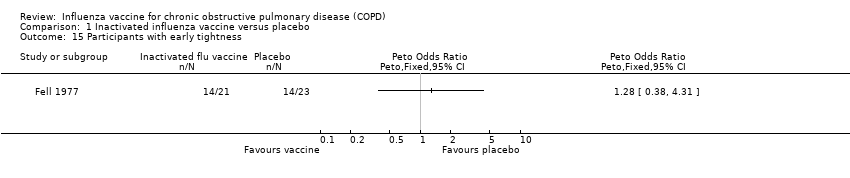
| 15 Participants with early tightness Show forest plot | 1 | Peto Odds Ratio (Peto, Fixed, 95% CI) | Totals not selected | |
| Analysis 1.15  Comparison 1 Inactivated influenza vaccine versus placebo, Outcome 15 Participants with early tightness. | ||||
| 16 Participants with early wheeze Show forest plot | 1 | Peto Odds Ratio (Peto, Fixed, 95% CI) | Totals not selected | |
| Analysis 1.16  Comparison 1 Inactivated influenza vaccine versus placebo, Outcome 16 Participants with early wheeze. | ||||
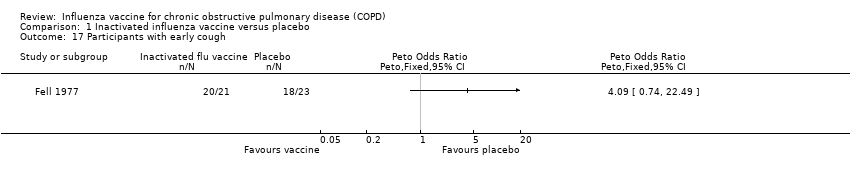
| 17 Participants with early cough Show forest plot | 1 | Peto Odds Ratio (Peto, Fixed, 95% CI) | Totals not selected | |
| Analysis 1.17  Comparison 1 Inactivated influenza vaccine versus placebo, Outcome 17 Participants with early cough. | ||||
| 18 Acute respiratory illness subsequently documented as influenza‐related Show forest plot | 2 | 180 | Odds Ratio (M‐H, Fixed, 95% CI) | 0.19 [0.07, 0.48] |
| Analysis 1.18  Comparison 1 Inactivated influenza vaccine versus placebo, Outcome 18 Acute respiratory illness subsequently documented as influenza‐related. | ||||
| 18.1 FEV¹ ≥ 70% predicted | 1 | 45 | Odds Ratio (M‐H, Fixed, 95% CI) | 0.12 [0.01, 1.11] |
| 18.2 Participants with chronic bronchitis | 1 | 55 | Odds Ratio (M‐H, Fixed, 95% CI) | 0.19 [0.04, 0.96] |
| 18.3 FEV¹ < 50% predicted | 1 | 47 | Odds Ratio (M‐H, Fixed, 95% CI) | 0.11 [0.01, 0.99] |
| 18.4 FEV¹ 50% to 69% predicted | 1 | 33 | Odds Ratio (M‐H, Fixed, 95% CI) | 0.46 [0.07, 2.98] |
| 19 Early acute respiratory illness (ARI) Show forest plot | 1 | 250 | Odds Ratio (M‐H, Fixed, 95% CI) | 0.72 [0.34, 1.50] |
| Analysis 1.19  Comparison 1 Inactivated influenza vaccine versus placebo, Outcome 19 Early acute respiratory illness (ARI). | ||||
| 19.1 ARI within 1 week of vaccination | 1 | 125 | Odds Ratio (M‐H, Fixed, 95% CI) | 1.02 [0.24, 4.26] |
| 19.2 ARI between 1 and 4 weeks after vaccination | 1 | 125 | Odds Ratio (M‐H, Fixed, 95% CI) | 0.63 [0.27, 1.50] |
| 20 Participants with early sputum production Show forest plot | 1 | Peto Odds Ratio (Peto, Fixed, 95% CI) | Totals not selected | |
| Analysis 1.20  Comparison 1 Inactivated influenza vaccine versus placebo, Outcome 20 Participants with early sputum production. | ||||
| Outcome or subgroup title | No. of studies | No. of participants | Statistical method | Effect size |
| 1 Total exacerbations per participant Show forest plot | 2 | 1137 | Mean Difference (IV, Fixed, 95% CI) | 0.01 [‐0.35, 0.37] |
| Analysis 2.1  Comparison 2 Inactivated + live virus versus inactivated virus + placebo, Outcome 1 Total exacerbations per participant. | ||||
| 2 Early exacerbations per participant Show forest plot | 1 | Mean Difference (IV, Fixed, 95% CI) | Totals not selected | |
| Analysis 2.2  Comparison 2 Inactivated + live virus versus inactivated virus + placebo, Outcome 2 Early exacerbations per participant. | ||||
| 3 Late exacerbations per participant Show forest plot | 1 | 29 | Mean Difference (IV, Fixed, 95% CI) | 0.23 [‐0.08, 0.54] |
| Analysis 2.3  Comparison 2 Inactivated + live virus versus inactivated virus + placebo, Outcome 3 Late exacerbations per participant. | ||||
| 4 Participants with improvement in exacerbations Show forest plot | 1 | 29 | Peto Odds Ratio (Peto, Fixed, 95% CI) | 1.48 [0.30, 7.42] |
| Analysis 2.4  Comparison 2 Inactivated + live virus versus inactivated virus + placebo, Outcome 4 Participants with improvement in exacerbations. | ||||
| 5 Participants with early improvements Show forest plot | 1 | Peto Odds Ratio (Peto, Fixed, 95% CI) | Totals not selected | |
| Analysis 2.5  Comparison 2 Inactivated + live virus versus inactivated virus + placebo, Outcome 5 Participants with early improvements. | ||||
| 6 Participants with late improvements Show forest plot | 1 | Peto Odds Ratio (Peto, Fixed, 95% CI) | Totals not selected | |
| Analysis 2.6  Comparison 2 Inactivated + live virus versus inactivated virus + placebo, Outcome 6 Participants with late improvements. | ||||
| 7 Mortality Show forest plot | 1 | Odds Ratio (M‐H, Fixed, 95% CI) | Totals not selected | |
| Analysis 2.7  Comparison 2 Inactivated + live virus versus inactivated virus + placebo, Outcome 7 Mortality. | ||||
| 8 Early changes in lung function (% predicted FEV¹) Show forest plot | 1 | Mean Difference (IV, Fixed, 95% CI) | Totals not selected | |
| Analysis 2.8  Comparison 2 Inactivated + live virus versus inactivated virus + placebo, Outcome 8 Early changes in lung function (% predicted FEV¹). | ||||
| 9 Early changes in lung function (FEV¹/FVC %) Show forest plot | 1 | Mean Difference (IV, Fixed, 95% CI) | Totals not selected | |
| Analysis 2.9  Comparison 2 Inactivated + live virus versus inactivated virus + placebo, Outcome 9 Early changes in lung function (FEV¹/FVC %). | ||||
| 10 Post immunisation lung function (FEV¹) Show forest plot | 1 | Mean Difference (IV, Fixed, 95% CI) | Totals not selected | |
| Analysis 2.10  Comparison 2 Inactivated + live virus versus inactivated virus + placebo, Outcome 10 Post immunisation lung function (FEV¹). | ||||
| 11 Participants with increased lung function (1 category) Show forest plot | 1 | Peto Odds Ratio (Peto, Fixed, 95% CI) | Totals not selected | |
| Analysis 2.11  Comparison 2 Inactivated + live virus versus inactivated virus + placebo, Outcome 11 Participants with increased lung function (1 category). | ||||
| 12 Participants with decreased lung function Show forest plot | 1 | Peto Odds Ratio (Peto, Fixed, 95% CI) | Totals not selected | |
| Analysis 2.12  Comparison 2 Inactivated + live virus versus inactivated virus + placebo, Outcome 12 Participants with decreased lung function. | ||||
| 13 FEV¹ at end of study Show forest plot | 1 | Mean Difference (IV, Fixed, 95% CI) | Totals not selected | |
| Analysis 2.13  Comparison 2 Inactivated + live virus versus inactivated virus + placebo, Outcome 13 FEV¹ at end of study. | ||||
| 14 Participants with adverse effects (new upper respiratory tract symptoms) Show forest plot | 1 | 29 | Peto Odds Ratio (Peto, Fixed, 95% CI) | 1.89 [0.45, 8.04] |
| Analysis 2.14  Comparison 2 Inactivated + live virus versus inactivated virus + placebo, Outcome 14 Participants with adverse effects (new upper respiratory tract symptoms). | ||||
| 15 Participants with early adverse effects Show forest plot | 2 | 2244 | Peto Odds Ratio (Peto, Fixed, 95% CI) | 0.86 [0.63, 1.17] |
| Analysis 2.15  Comparison 2 Inactivated + live virus versus inactivated virus + placebo, Outcome 15 Participants with early adverse effects. | ||||
| 16 Number of days with early symptoms and signs Show forest plot | 1 | Mean Difference (IV, Fixed, 95% CI) | Totals not selected | |
| Analysis 2.16  Comparison 2 Inactivated + live virus versus inactivated virus + placebo, Outcome 16 Number of days with early symptoms and signs. | ||||
| 17 Number of participants with early adverse effects (by type) Show forest plot | 1 | Odds Ratio (M‐H, Fixed, 95% CI) | Subtotals only | |
| Analysis 2.17  Comparison 2 Inactivated + live virus versus inactivated virus + placebo, Outcome 17 Number of participants with early adverse effects (by type). | ||||
| 17.1 COPD | 1 | 2215 | Odds Ratio (M‐H, Fixed, 95% CI) | 0.66 [0.30, 1.48] |
| 17.2 Dyspnoea | 1 | 2215 | Odds Ratio (M‐H, Fixed, 95% CI) | 1.81 [0.60, 5.41] |
| 17.3 Pharyngitis | 1 | 2215 | Odds Ratio (M‐H, Fixed, 95% CI) | 1.00 [0.35, 2.86] |
| 17.4 Flu syndrome | 1 | 2215 | Odds Ratio (M‐H, Fixed, 95% CI) | 0.62 [0.20, 1.91] |
| 17.5 Rhinitis | 1 | 2215 | Odds Ratio (M‐H, Fixed, 95% CI) | 1.50 [0.42, 5.34] |
| 17.6 Bronchitis | 1 | 2215 | Odds Ratio (M‐H, Fixed, 95% CI) | 2.01 [0.50, 8.05] |
| 17.7 Increased cough | 1 | 2215 | Odds Ratio (M‐H, Fixed, 95% CI) | 0.60 [0.14, 2.51] |
| 17.8 Myalgia | 1 | 2215 | Odds Ratio (M‐H, Fixed, 95% CI) | 2.51 [0.49, 12.96] |
| 17.9 Increased sputum | 1 | 2215 | Odds Ratio (M‐H, Fixed, 95% CI) | 0.75 [0.17, 3.36] |
| 17.10 Pneumonia | 1 | 2215 | Odds Ratio (M‐H, Fixed, 95% CI) | 2.01 [0.37, 10.97] |
| 17.11 Asthenia | 1 | 2215 | Odds Ratio (M‐H, Fixed, 95% CI) | 2.01 [0.37, 10.97] |
| 17.12 Guillain‐Barré syndrome | 1 | 2215 | Odds Ratio (M‐H, Fixed, 95% CI) | 0.33 [0.01, 8.19] |
| 17.13 Other | 1 | 2215 | Odds Ratio (M‐H, Fixed, 95% CI) | 0.49 [0.26, 0.92] |
| 18 Participants with late adverse effects Show forest plot | 2 | 2244 | Peto Odds Ratio (Peto, Fixed, 95% CI) | 2.33 [1.22, 4.46] |
| Analysis 2.18  Comparison 2 Inactivated + live virus versus inactivated virus + placebo, Outcome 18 Participants with late adverse effects. | ||||
| 19 Acute respiratory illness subsequently documented as influenza‐related Show forest plot | 1 | Odds Ratio (M‐H, Fixed, 95% CI) | Totals not selected | |
| Analysis 2.19  Comparison 2 Inactivated + live virus versus inactivated virus + placebo, Outcome 19 Acute respiratory illness subsequently documented as influenza‐related. | ||||
| 20 Participants with at least one influenza‐like illness Show forest plot | 1 | Odds Ratio (M‐H, Fixed, 95% CI) | Totals not selected | |
| Analysis 2.20  Comparison 2 Inactivated + live virus versus inactivated virus + placebo, Outcome 20 Participants with at least one influenza‐like illness. | ||||

Study flow diagram for 2018 update

Risk of bias summary: review authors' judgements about each risk of bias item for each included study

Comparison 1 Inactivated influenza vaccine versus placebo, Outcome 1 Total exacerbations per participant.
Comparison 1 Inactivated influenza vaccine versus placebo, Outcome 2 Early exacerbations per participant.
Comparison 1 Inactivated influenza vaccine versus placebo, Outcome 3 Late exacerbations per participant.
Comparison 1 Inactivated influenza vaccine versus placebo, Outcome 4 Participants with at least one exacerbation or acute respiratory illness.

Comparison 1 Inactivated influenza vaccine versus placebo, Outcome 5 Participants with early exacerbations.

Comparison 1 Inactivated influenza vaccine versus placebo, Outcome 6 Participants with late exacerbations.

Comparison 1 Inactivated influenza vaccine versus placebo, Outcome 7 Hospital admissions.

Comparison 1 Inactivated influenza vaccine versus placebo, Outcome 8 Mortality (all cause).
Comparison 1 Inactivated influenza vaccine versus placebo, Outcome 9 Mortality (acute respiratory illness‐related).

Comparison 1 Inactivated influenza vaccine versus placebo, Outcome 10 Overall change in lung function (FEV¹, L).
Comparison 1 Inactivated influenza vaccine versus placebo, Outcome 11 Change in early lung function (FEV¹, L).
Comparison 1 Inactivated influenza vaccine versus placebo, Outcome 12 Systemic adverse effects.

Comparison 1 Inactivated influenza vaccine versus placebo, Outcome 13 Local effects at injection site.

Comparison 1 Inactivated influenza vaccine versus placebo, Outcome 14 Participants with early breathlessness.
Comparison 1 Inactivated influenza vaccine versus placebo, Outcome 15 Participants with early tightness.

Comparison 1 Inactivated influenza vaccine versus placebo, Outcome 16 Participants with early wheeze.
Comparison 1 Inactivated influenza vaccine versus placebo, Outcome 17 Participants with early cough.

Comparison 1 Inactivated influenza vaccine versus placebo, Outcome 18 Acute respiratory illness subsequently documented as influenza‐related.

Comparison 1 Inactivated influenza vaccine versus placebo, Outcome 19 Early acute respiratory illness (ARI).
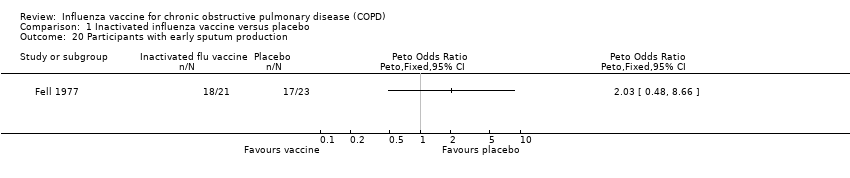
Comparison 1 Inactivated influenza vaccine versus placebo, Outcome 20 Participants with early sputum production.

Comparison 2 Inactivated + live virus versus inactivated virus + placebo, Outcome 1 Total exacerbations per participant.
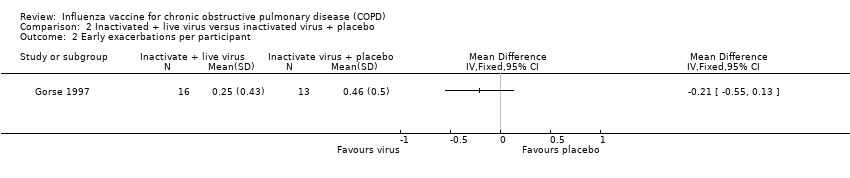
Comparison 2 Inactivated + live virus versus inactivated virus + placebo, Outcome 2 Early exacerbations per participant.

Comparison 2 Inactivated + live virus versus inactivated virus + placebo, Outcome 3 Late exacerbations per participant.

Comparison 2 Inactivated + live virus versus inactivated virus + placebo, Outcome 4 Participants with improvement in exacerbations.
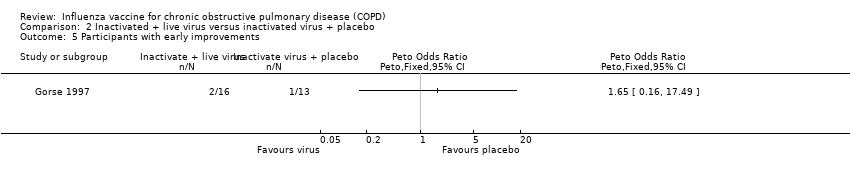
Comparison 2 Inactivated + live virus versus inactivated virus + placebo, Outcome 5 Participants with early improvements.

Comparison 2 Inactivated + live virus versus inactivated virus + placebo, Outcome 6 Participants with late improvements.

Comparison 2 Inactivated + live virus versus inactivated virus + placebo, Outcome 7 Mortality.

Comparison 2 Inactivated + live virus versus inactivated virus + placebo, Outcome 8 Early changes in lung function (% predicted FEV¹).

Comparison 2 Inactivated + live virus versus inactivated virus + placebo, Outcome 9 Early changes in lung function (FEV¹/FVC %).

Comparison 2 Inactivated + live virus versus inactivated virus + placebo, Outcome 10 Post immunisation lung function (FEV¹).

Comparison 2 Inactivated + live virus versus inactivated virus + placebo, Outcome 11 Participants with increased lung function (1 category).
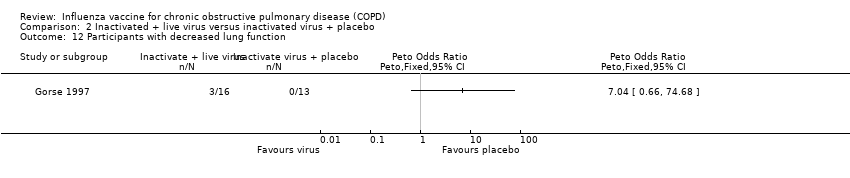
Comparison 2 Inactivated + live virus versus inactivated virus + placebo, Outcome 12 Participants with decreased lung function.
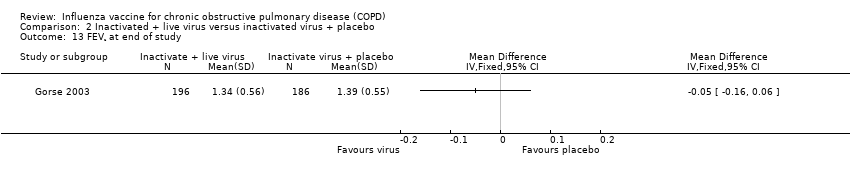
Comparison 2 Inactivated + live virus versus inactivated virus + placebo, Outcome 13 FEV¹ at end of study.

Comparison 2 Inactivated + live virus versus inactivated virus + placebo, Outcome 14 Participants with adverse effects (new upper respiratory tract symptoms).
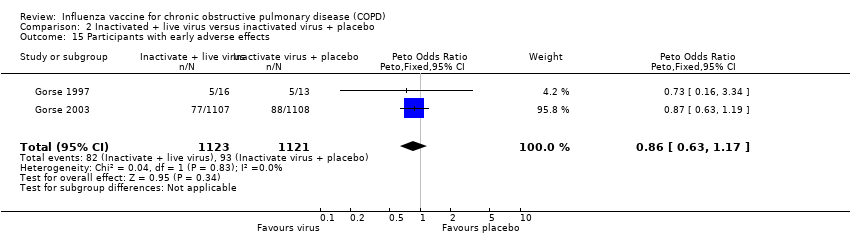
Comparison 2 Inactivated + live virus versus inactivated virus + placebo, Outcome 15 Participants with early adverse effects.
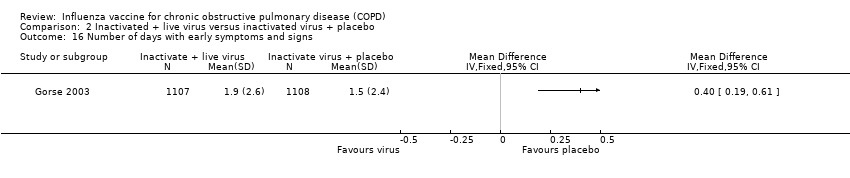
Comparison 2 Inactivated + live virus versus inactivated virus + placebo, Outcome 16 Number of days with early symptoms and signs.

Comparison 2 Inactivated + live virus versus inactivated virus + placebo, Outcome 17 Number of participants with early adverse effects (by type).

Comparison 2 Inactivated + live virus versus inactivated virus + placebo, Outcome 18 Participants with late adverse effects.

Comparison 2 Inactivated + live virus versus inactivated virus + placebo, Outcome 19 Acute respiratory illness subsequently documented as influenza‐related.
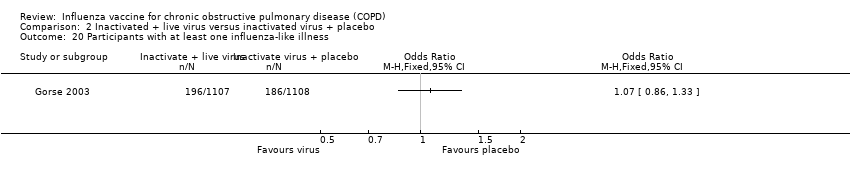
Comparison 2 Inactivated + live virus versus inactivated virus + placebo, Outcome 20 Participants with at least one influenza‐like illness.
| Influenza vaccine compared to placebo for chronic obstructive pulmonary disease (COPD) | ||||||
| Patient or population: chronic obstructive pulmonary disease (COPD) | ||||||
| Outcomes | Anticipated absolute effects* (95% CI) | Relative effect | № of participants | Certainty of the evidence | Comments | |
| Risk with placebo | Risk with Influenza vaccine | |||||
| Total exacerbations per participant | The mean number of total exacerbations per participant ranged across placebo groups from 0.83 to 1.35 | MD 0.37 lower | ‐ | 180 | ⊕⊕⊝⊝ | Despite the effect size, this is based on a very small number of trials and participants. However there was good agreement between these two studies (low I2). One study was not conducted in an epidemic year. We extrapolated some data. Ideally more trials would be done to refine these effect sizes. |
| Early exacerbations per participant | The mean number of early exacerbations per participant ranged across placebo groups from 0.14 to 0.34 | MD 0.01 higher | ‐ | 180 | ⊕⊕⊝⊝ | See above |
| Late exacerbations per participant | The mean number of late exacerbations per participant ranged across placebo groups from 0.48 to 1.21 | MD 0.39 lower | ‐ | 180 | ⊕⊕⊝⊝ | See above |
| Days disability from respiratory illness | not reported | |||||
| Hospital admissions | 76 per 1000 | 26 per 1000 | OR 0.33 | 180 | ⊕⊕⊝⊝ | |
| Mortality | 76 per 1000 | 67 per 1000 | OR 0.87 | 180 | ⊕⊕⊝⊝ | |
| Local effects at injection site | 63 per 1000 | 274 per 1000 | OR 5.57 | 125 | ⊕⊕⊝⊝ | Single study on participants who all had COPD (Wongsurakiat 2004a), but very similar findings in studies with a mixed population (Cate 1977; Govaert 1994) |
| GRADE Working Group grades of evidence | ||||||
| aSmall number of studies which are over ten years old limit our confidence in the generalisability of these findings to currently available vaccines (downgraded once for indirectness). b Studies too small and events too infrequent to detect a consistent effect (downgraded once for imprecision) | ||||||
| Outcome or subgroup title | No. of studies | No. of participants | Statistical method | Effect size |
| 1 Total exacerbations per participant Show forest plot | 2 | 180 | Mean Difference (IV, Fixed, 95% CI) | ‐0.37 [‐0.64, ‐0.11] |
| 2 Early exacerbations per participant Show forest plot | 2 | 180 | Mean Difference (IV, Fixed, 95% CI) | 0.01 [‐0.11, 0.13] |
| 3 Late exacerbations per participant Show forest plot | 2 | 180 | Mean Difference (IV, Fixed, 95% CI) | ‐0.39 [‐0.61, ‐0.18] |
| 4 Participants with at least one exacerbation or acute respiratory illness Show forest plot | 3 | 222 | Peto Odds Ratio (Peto, Fixed, 95% CI) | 0.81 [0.44, 1.48] |
| 4.1 Clinical exacerbations | 2 | 97 | Peto Odds Ratio (Peto, Fixed, 95% CI) | 1.06 [0.48, 2.33] |
| 4.2 Any acute respiratory illness | 1 | 125 | Peto Odds Ratio (Peto, Fixed, 95% CI) | 0.56 [0.22, 1.42] |
| 5 Participants with early exacerbations Show forest plot | 2 | 180 | Peto Odds Ratio (Peto, Fixed, 95% CI) | 1.08 [0.52, 2.26] |
| 6 Participants with late exacerbations Show forest plot | 1 | Peto Odds Ratio (Peto, Fixed, 95% CI) | Totals not selected | |
| 7 Hospital admissions Show forest plot | 2 | 180 | Peto Odds Ratio (Peto, Fixed, 95% CI) | 0.33 [0.09, 1.24] |
| 7.1 Clinical exacerbations | 1 | 55 | Peto Odds Ratio (Peto, Fixed, 95% CI) | 0.14 [0.01, 2.39] |
| 7.2 Influenza‐related exacerbations | 1 | 125 | Peto Odds Ratio (Peto, Fixed, 95% CI) | 0.41 [0.09, 1.89] |
| 8 Mortality (all cause) Show forest plot | 2 | 180 | Peto Odds Ratio (Peto, Fixed, 95% CI) | 0.87 [0.28, 2.70] |
| 9 Mortality (acute respiratory illness‐related) Show forest plot | 1 | Odds Ratio (M‐H, Fixed, 95% CI) | Totals not selected | |
| 10 Overall change in lung function (FEV¹, L) Show forest plot | 1 | Mean Difference (IV, Fixed, 95% CI) | Totals not selected | |
| 11 Change in early lung function (FEV¹, L) Show forest plot | 1 | Mean Difference (IV, Fixed, 95% CI) | Totals not selected | |
| 12 Systemic adverse effects Show forest plot | 1 | Odds Ratio (M‐H, Fixed, 95% CI) | Totals not selected | |
| 13 Local effects at injection site Show forest plot | 1 | Odds Ratio (M‐H, Fixed, 95% CI) | Totals not selected | |
| 14 Participants with early breathlessness Show forest plot | 1 | Peto Odds Ratio (Peto, Fixed, 95% CI) | Totals not selected | |
| 15 Participants with early tightness Show forest plot | 1 | Peto Odds Ratio (Peto, Fixed, 95% CI) | Totals not selected | |
| 16 Participants with early wheeze Show forest plot | 1 | Peto Odds Ratio (Peto, Fixed, 95% CI) | Totals not selected | |
| 17 Participants with early cough Show forest plot | 1 | Peto Odds Ratio (Peto, Fixed, 95% CI) | Totals not selected | |
| 18 Acute respiratory illness subsequently documented as influenza‐related Show forest plot | 2 | 180 | Odds Ratio (M‐H, Fixed, 95% CI) | 0.19 [0.07, 0.48] |
| 18.1 FEV¹ ≥ 70% predicted | 1 | 45 | Odds Ratio (M‐H, Fixed, 95% CI) | 0.12 [0.01, 1.11] |
| 18.2 Participants with chronic bronchitis | 1 | 55 | Odds Ratio (M‐H, Fixed, 95% CI) | 0.19 [0.04, 0.96] |
| 18.3 FEV¹ < 50% predicted | 1 | 47 | Odds Ratio (M‐H, Fixed, 95% CI) | 0.11 [0.01, 0.99] |
| 18.4 FEV¹ 50% to 69% predicted | 1 | 33 | Odds Ratio (M‐H, Fixed, 95% CI) | 0.46 [0.07, 2.98] |
| 19 Early acute respiratory illness (ARI) Show forest plot | 1 | 250 | Odds Ratio (M‐H, Fixed, 95% CI) | 0.72 [0.34, 1.50] |
| 19.1 ARI within 1 week of vaccination | 1 | 125 | Odds Ratio (M‐H, Fixed, 95% CI) | 1.02 [0.24, 4.26] |
| 19.2 ARI between 1 and 4 weeks after vaccination | 1 | 125 | Odds Ratio (M‐H, Fixed, 95% CI) | 0.63 [0.27, 1.50] |
| 20 Participants with early sputum production Show forest plot | 1 | Peto Odds Ratio (Peto, Fixed, 95% CI) | Totals not selected | |
| Outcome or subgroup title | No. of studies | No. of participants | Statistical method | Effect size |
| 1 Total exacerbations per participant Show forest plot | 2 | 1137 | Mean Difference (IV, Fixed, 95% CI) | 0.01 [‐0.35, 0.37] |
| 2 Early exacerbations per participant Show forest plot | 1 | Mean Difference (IV, Fixed, 95% CI) | Totals not selected | |
| 3 Late exacerbations per participant Show forest plot | 1 | 29 | Mean Difference (IV, Fixed, 95% CI) | 0.23 [‐0.08, 0.54] |
| 4 Participants with improvement in exacerbations Show forest plot | 1 | 29 | Peto Odds Ratio (Peto, Fixed, 95% CI) | 1.48 [0.30, 7.42] |
| 5 Participants with early improvements Show forest plot | 1 | Peto Odds Ratio (Peto, Fixed, 95% CI) | Totals not selected | |
| 6 Participants with late improvements Show forest plot | 1 | Peto Odds Ratio (Peto, Fixed, 95% CI) | Totals not selected | |
| 7 Mortality Show forest plot | 1 | Odds Ratio (M‐H, Fixed, 95% CI) | Totals not selected | |
| 8 Early changes in lung function (% predicted FEV¹) Show forest plot | 1 | Mean Difference (IV, Fixed, 95% CI) | Totals not selected | |
| 9 Early changes in lung function (FEV¹/FVC %) Show forest plot | 1 | Mean Difference (IV, Fixed, 95% CI) | Totals not selected | |
| 10 Post immunisation lung function (FEV¹) Show forest plot | 1 | Mean Difference (IV, Fixed, 95% CI) | Totals not selected | |
| 11 Participants with increased lung function (1 category) Show forest plot | 1 | Peto Odds Ratio (Peto, Fixed, 95% CI) | Totals not selected | |
| 12 Participants with decreased lung function Show forest plot | 1 | Peto Odds Ratio (Peto, Fixed, 95% CI) | Totals not selected | |
| 13 FEV¹ at end of study Show forest plot | 1 | Mean Difference (IV, Fixed, 95% CI) | Totals not selected | |
| 14 Participants with adverse effects (new upper respiratory tract symptoms) Show forest plot | 1 | 29 | Peto Odds Ratio (Peto, Fixed, 95% CI) | 1.89 [0.45, 8.04] |
| 15 Participants with early adverse effects Show forest plot | 2 | 2244 | Peto Odds Ratio (Peto, Fixed, 95% CI) | 0.86 [0.63, 1.17] |
| 16 Number of days with early symptoms and signs Show forest plot | 1 | Mean Difference (IV, Fixed, 95% CI) | Totals not selected | |
| 17 Number of participants with early adverse effects (by type) Show forest plot | 1 | Odds Ratio (M‐H, Fixed, 95% CI) | Subtotals only | |
| 17.1 COPD | 1 | 2215 | Odds Ratio (M‐H, Fixed, 95% CI) | 0.66 [0.30, 1.48] |
| 17.2 Dyspnoea | 1 | 2215 | Odds Ratio (M‐H, Fixed, 95% CI) | 1.81 [0.60, 5.41] |
| 17.3 Pharyngitis | 1 | 2215 | Odds Ratio (M‐H, Fixed, 95% CI) | 1.00 [0.35, 2.86] |
| 17.4 Flu syndrome | 1 | 2215 | Odds Ratio (M‐H, Fixed, 95% CI) | 0.62 [0.20, 1.91] |
| 17.5 Rhinitis | 1 | 2215 | Odds Ratio (M‐H, Fixed, 95% CI) | 1.50 [0.42, 5.34] |
| 17.6 Bronchitis | 1 | 2215 | Odds Ratio (M‐H, Fixed, 95% CI) | 2.01 [0.50, 8.05] |
| 17.7 Increased cough | 1 | 2215 | Odds Ratio (M‐H, Fixed, 95% CI) | 0.60 [0.14, 2.51] |
| 17.8 Myalgia | 1 | 2215 | Odds Ratio (M‐H, Fixed, 95% CI) | 2.51 [0.49, 12.96] |
| 17.9 Increased sputum | 1 | 2215 | Odds Ratio (M‐H, Fixed, 95% CI) | 0.75 [0.17, 3.36] |
| 17.10 Pneumonia | 1 | 2215 | Odds Ratio (M‐H, Fixed, 95% CI) | 2.01 [0.37, 10.97] |
| 17.11 Asthenia | 1 | 2215 | Odds Ratio (M‐H, Fixed, 95% CI) | 2.01 [0.37, 10.97] |
| 17.12 Guillain‐Barré syndrome | 1 | 2215 | Odds Ratio (M‐H, Fixed, 95% CI) | 0.33 [0.01, 8.19] |
| 17.13 Other | 1 | 2215 | Odds Ratio (M‐H, Fixed, 95% CI) | 0.49 [0.26, 0.92] |
| 18 Participants with late adverse effects Show forest plot | 2 | 2244 | Peto Odds Ratio (Peto, Fixed, 95% CI) | 2.33 [1.22, 4.46] |
| 19 Acute respiratory illness subsequently documented as influenza‐related Show forest plot | 1 | Odds Ratio (M‐H, Fixed, 95% CI) | Totals not selected | |
| 20 Participants with at least one influenza‐like illness Show forest plot | 1 | Odds Ratio (M‐H, Fixed, 95% CI) | Totals not selected | |