Inhibidores de la fosfodiesterasa 4 para la enfermedad pulmonar obstructiva crónica
Información
- DOI:
- https://doi.org/10.1002/14651858.CD002309.pub5Copiar DOI

- Base de datos:
-
- Cochrane Database of Systematic Reviews
- Versión publicada:
-
- 19 septiembre 2017see what's new
- Tipo:
-
- Intervention
- Etapa:
-
- Review
- Grupo Editorial Cochrane:
-
Grupo Cochrane de Vías respiratorias
- Copyright:
-
- Copyright © 2017 The Cochrane Collaboration. Published by John Wiley & Sons, Ltd.
Cifras del artículo
Altmetric:
Citado por:
Autores
Contributions of authors
Jimmy Chong: study selection, data extraction, review write up, leading update of review.
Phillippa Poole: protocol initiation and development, study selection, data extraction, review write up, all stages of update, corresponding author.
Bonnie Leung: study selection, data extraction, review write up.
Sources of support
Internal sources
-
University of Auckland provided salary support for Professor Phillippa Poole, New Zealand.
External sources
-
No sources of support supplied
Declarations of interest
Jimmy Chong: none known
Phillippa Poole: none known
Bonnie Leung: none known
Acknowledgements
This review is dedicated to Professor Peter Black (deceased January 2010) who led the development of the protocol and the early part of the review. Peter made significant contributions through research, teaching and clinical practice to the furthering of evidence‐based management of airways diseases.
We thank Claire Arandjus for her contribution to protocol development.
We thank Professor Milo Puhan for assistance in locating reports on the FDA website.
To Nycomed and Forest Laboratories for confirming some study details and results extracted from published articles and abstracts.
GlaxoSmithKline (GSK) for study summaries available via the GSK online clinical study register.
Chris Cates was the Editor for this review and commented critically on the review.
This project was supported by the National Institute for Health Research (NIHR), via Cochrane Infrastructure funding to Cochrane Airways. The views and opinions expressed therein are those of the authors and do not necessarily reflect those of the Systematic Reviews Programme, NIHR, NHS, or the Department of Health.
The University of Auckland pays the salary of Phillippa Poole who conducted this during work time. The other two authors did not receive any financial support.
Version history
| Published | Title | Stage | Authors | Version |
| 2020 May 01 | Phosphodiesterase‐4 inhibitors for chronic obstructive pulmonary disease | Review | Sadia Janjua, Rebecca Fortescue, Phillippa Poole | |
| 2017 Sep 19 | Phosphodiesterase 4 inhibitors for chronic obstructive pulmonary disease | Review | Jimmy Chong, Bonnie Leung, Phillippa Poole | |
| 2013 Nov 04 | Phosphodiesterase 4 inhibitors for chronic obstructive pulmonary disease | Review | Jimmy Chong, Bonnie Leung, Phillippa Poole | |
| 2011 May 11 | Phosphodiesterase 4 inhibitors for chronic obstructive pulmonary disease | Review | Jimmy Chong, Phillippa Poole, Bonnie Leung, Peter N Black | |
| 2007 Jan 24 | Phosphodiesterase 4 inhibitors for chronic obstructive pulmonary disease | Protocol | Claire Arandjus, Peter N Black, Phillippa Poole | |
| 2000 Jul 24 | Phosphodiasterase inhibitors for chronic obstructive pulmonary disease | Protocol | Felix S F Ram, K Parameswaren, Krishnan Parameswaran | |
Differences between protocol and review
We added the comparison between published and unpublished results when we discovered the large number of unpublished studies, but before we extracted the data from the studies and carried out the analysis.
We have excluded cross‐over trials as carry‐over effects and disease progression cannot be adequately controlled for in people with chronic obstructive pulmonary disease.
Keywords
MeSH
Medical Subject Headings (MeSH) Keywords
- Administration, Oral;
- Aminopyridines [*administration & dosage, adverse effects];
- Benzamides [*administration & dosage, adverse effects];
- Cyclohexanecarboxylic Acids [*administration & dosage, adverse effects];
- Cyclopropanes [administration & dosage, adverse effects];
- Diarrhea [chemically induced];
- Disease Progression;
- Forced Expiratory Volume [drug effects];
- Nitriles [*administration & dosage, adverse effects];
- Peak Expiratory Flow Rate [drug effects];
- Phosphodiesterase 4 Inhibitors [*administration & dosage, adverse effects];
- Pulmonary Disease, Chronic Obstructive [*drug therapy, mortality];
- Quality of Life;
- Randomized Controlled Trials as Topic;
- Thiazoles [*administration & dosage, adverse effects];
- Vital Capacity [drug effects];
Medical Subject Headings Check Words
Humans; Middle Aged;
PICO

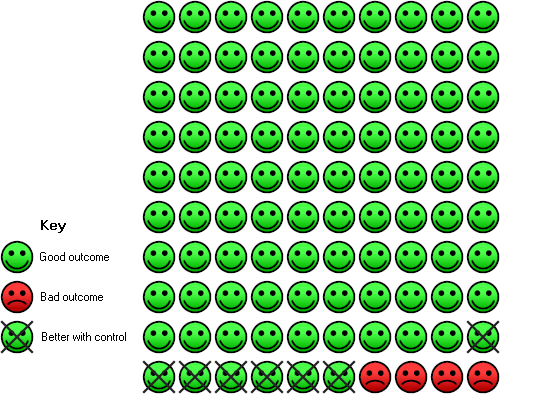
In the control group 33 people out of 100 had an exacerbation of COPD over 6‐52 weeks, compared to 28 (95% CI 27 to 29) out of 100 for the active treatment group.
In the control group 4 people out of 100 had diarrhoea over 6‐52 weeks, compared to 11 (95% CI 10 to 12) out of 100 for the active treatment group.
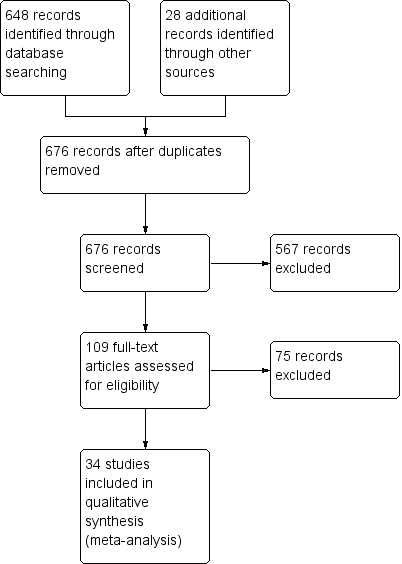
Study flow diagram

Methodological quality summary: review authors' judgements about each methodological quality item for each included study.
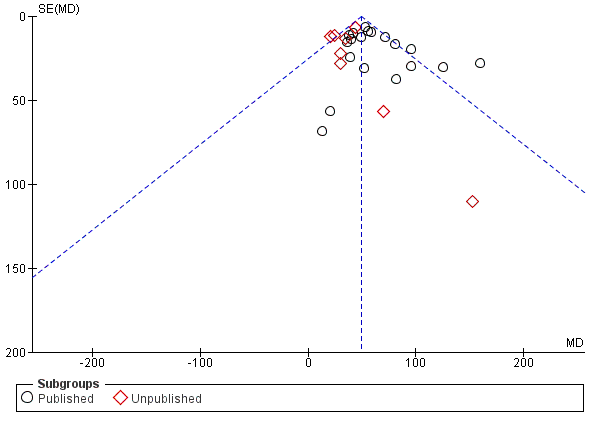
Funnel plot of comparison: 1 PDE4 inhibitor versus placebo, outcome: 1.6 FEV1 (published versus unpublished).

Comparison 1 PDE4 inhibitor versus placebo, Outcome 1 FEV1 (by drug).

Comparison 1 PDE4 inhibitor versus placebo, Outcome 2 FEV1 (by mean COPD severity).

Comparison 1 PDE4 inhibitor versus placebo, Outcome 3 FEV1 (Roflumilast 500 μg by mean COPD severity).
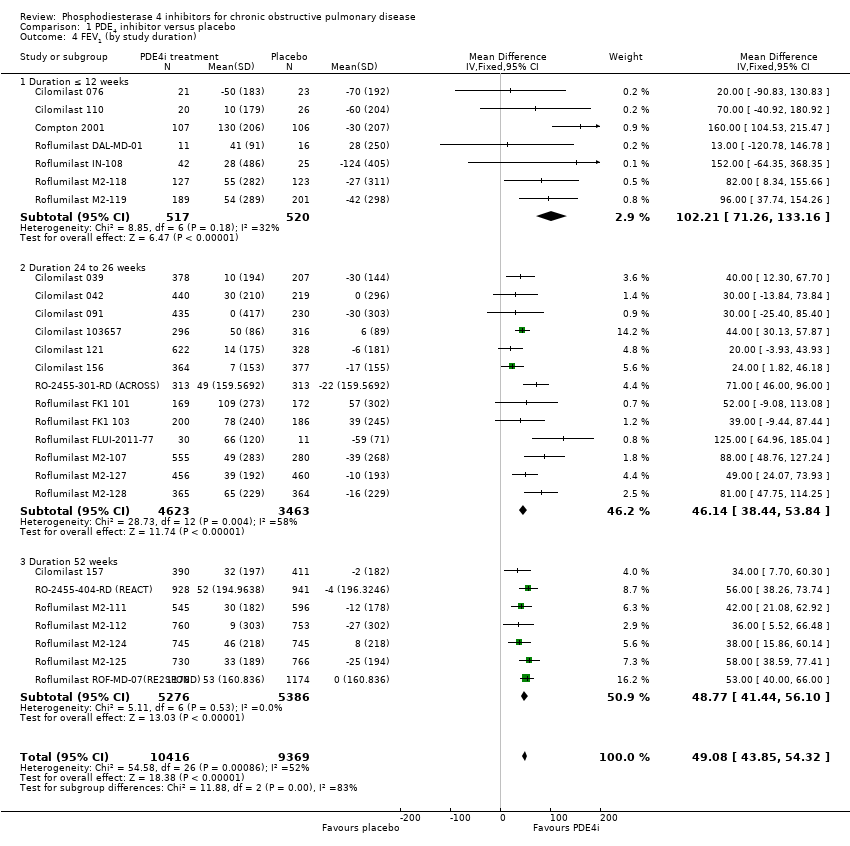
Comparison 1 PDE4 inhibitor versus placebo, Outcome 4 FEV1 (by study duration).

Comparison 1 PDE4 inhibitor versus placebo, Outcome 5 FEV1 (additional medication).

Comparison 1 PDE4 inhibitor versus placebo, Outcome 6 FEV1 (published versus unpublished).
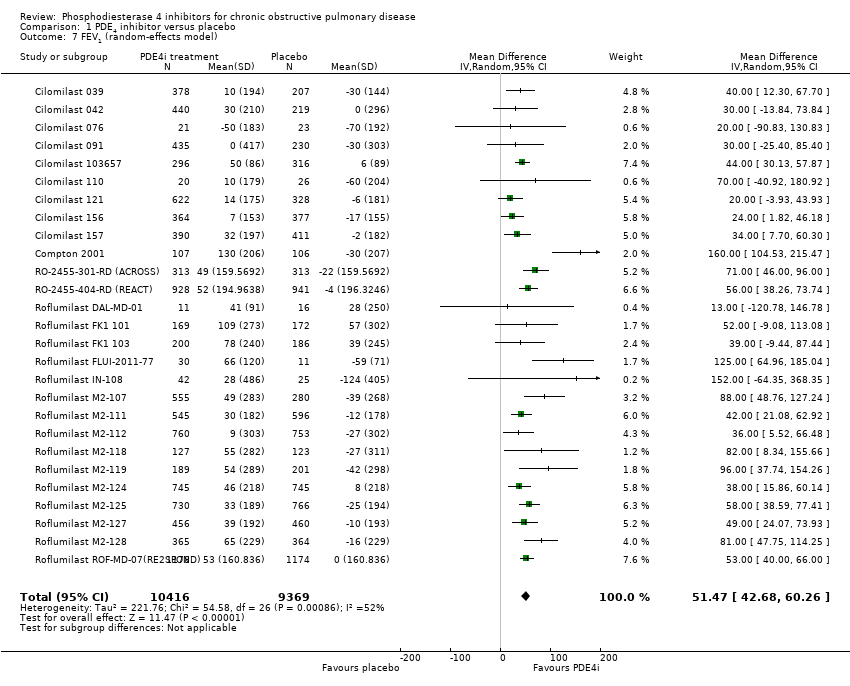
Comparison 1 PDE4 inhibitor versus placebo, Outcome 7 FEV1 (random‐effects model).
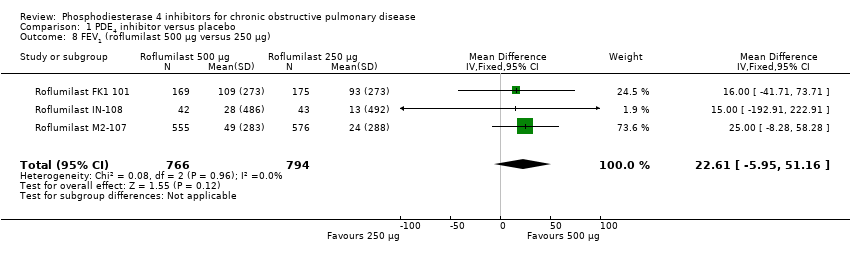
Comparison 1 PDE4 inhibitor versus placebo, Outcome 8 FEV1 (roflumilast 500 μg versus 250 μg).
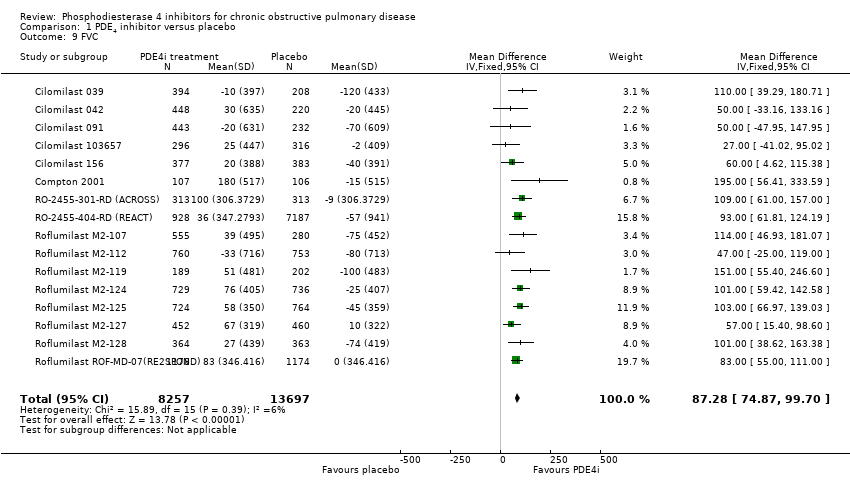
Comparison 1 PDE4 inhibitor versus placebo, Outcome 9 FVC.
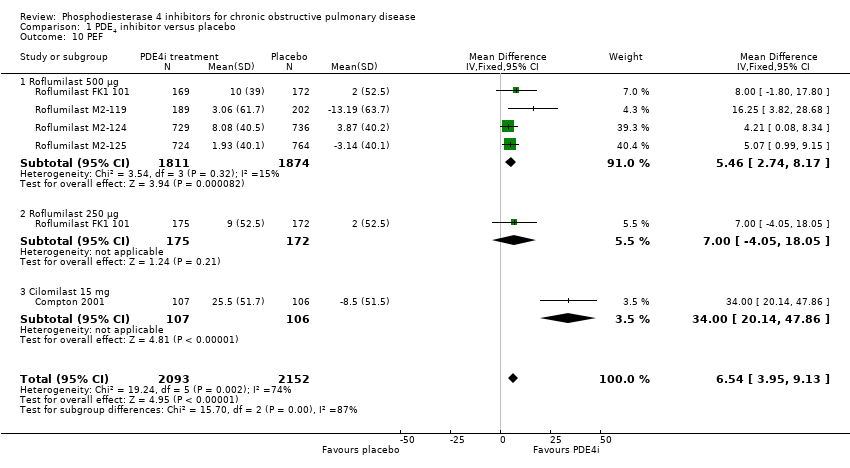
Comparison 1 PDE4 inhibitor versus placebo, Outcome 10 PEF.

Comparison 1 PDE4 inhibitor versus placebo, Outcome 11 SGRQ total score.
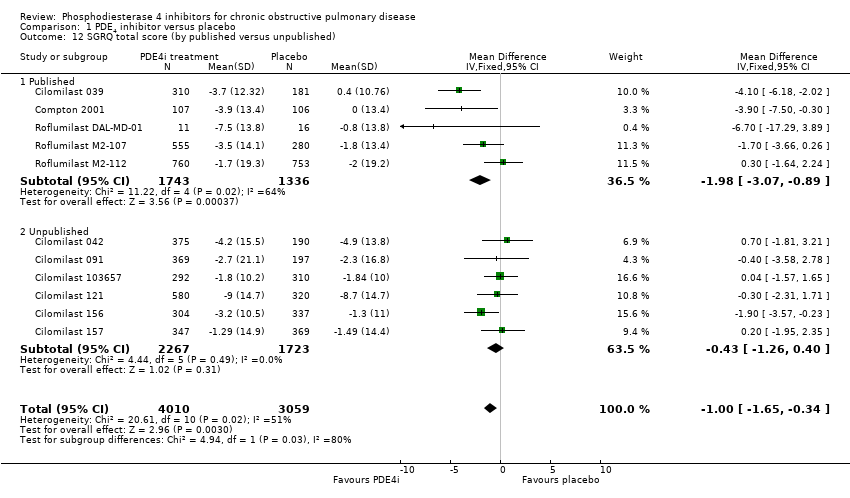
Comparison 1 PDE4 inhibitor versus placebo, Outcome 12 SGRQ total score (by published versus unpublished).

Comparison 1 PDE4 inhibitor versus placebo, Outcome 13 SGRQ total score (by duration).

Comparison 1 PDE4 inhibitor versus placebo, Outcome 14 SGRQ total score (by mean COPD severity).
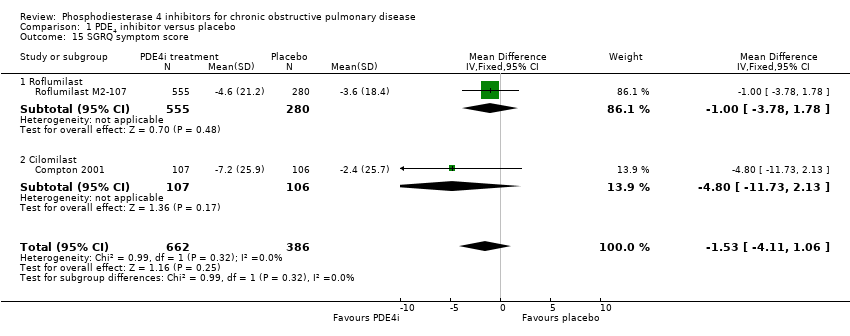
Comparison 1 PDE4 inhibitor versus placebo, Outcome 15 SGRQ symptom score.

Comparison 1 PDE4 inhibitor versus placebo, Outcome 16 Number of participants with one or more exacerbations (by drug).

Comparison 1 PDE4 inhibitor versus placebo, Outcome 17 Number of participants on roflumilast with one or more exacerbations (additional medication).
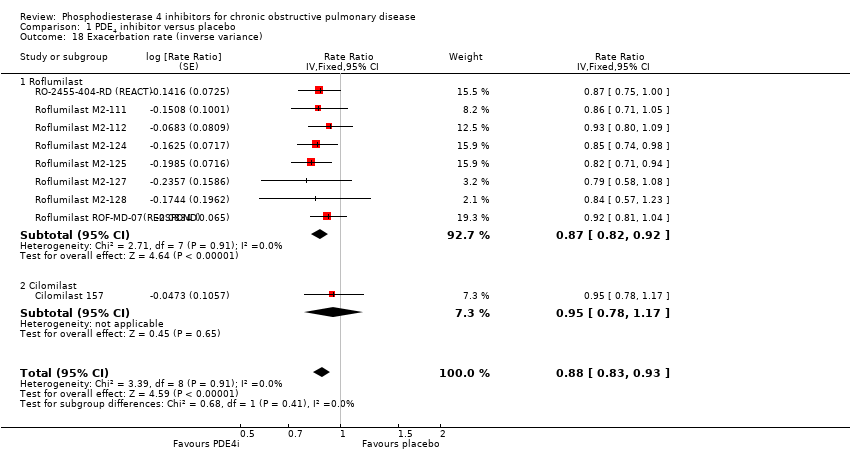
Comparison 1 PDE4 inhibitor versus placebo, Outcome 18 Exacerbation rate (inverse variance).

Comparison 1 PDE4 inhibitor versus placebo, Outcome 19 Borg Scale.

Comparison 1 PDE4 inhibitor versus placebo, Outcome 20 Summary symptom score.

Comparison 1 PDE4 inhibitor versus placebo, Outcome 21 Shortness of breath questionnaire.
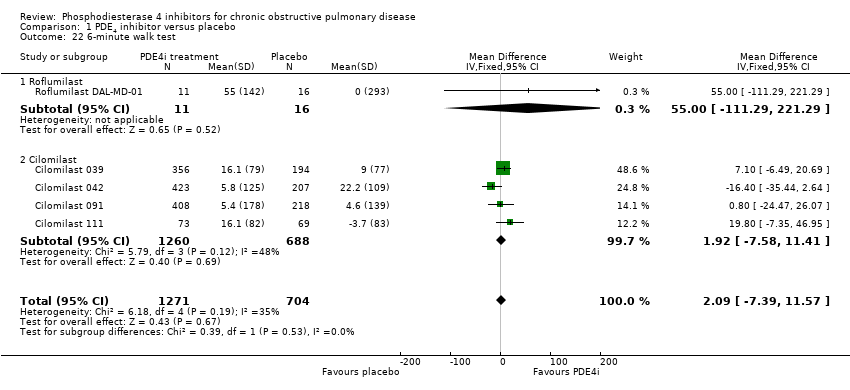
Comparison 1 PDE4 inhibitor versus placebo, Outcome 22 6‐minute walk test.

Comparison 1 PDE4 inhibitor versus placebo, Outcome 23 Number of participants experiencing an adverse effect.
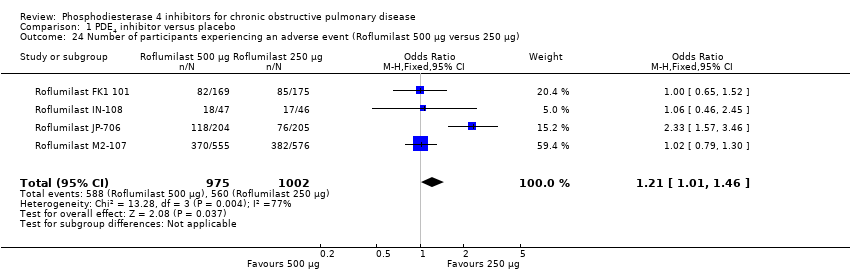
Comparison 1 PDE4 inhibitor versus placebo, Outcome 24 Number of participants experiencing an adverse event (Roflumilast 500 μg versus 250 μg).
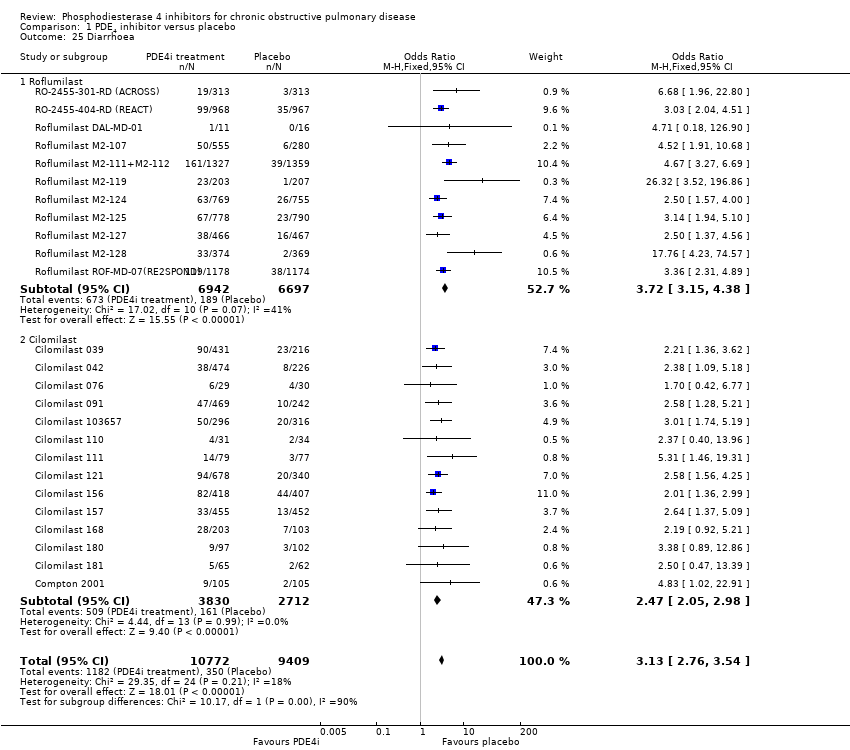
Comparison 1 PDE4 inhibitor versus placebo, Outcome 25 Diarrhoea.

Comparison 1 PDE4 inhibitor versus placebo, Outcome 26 Nausea.
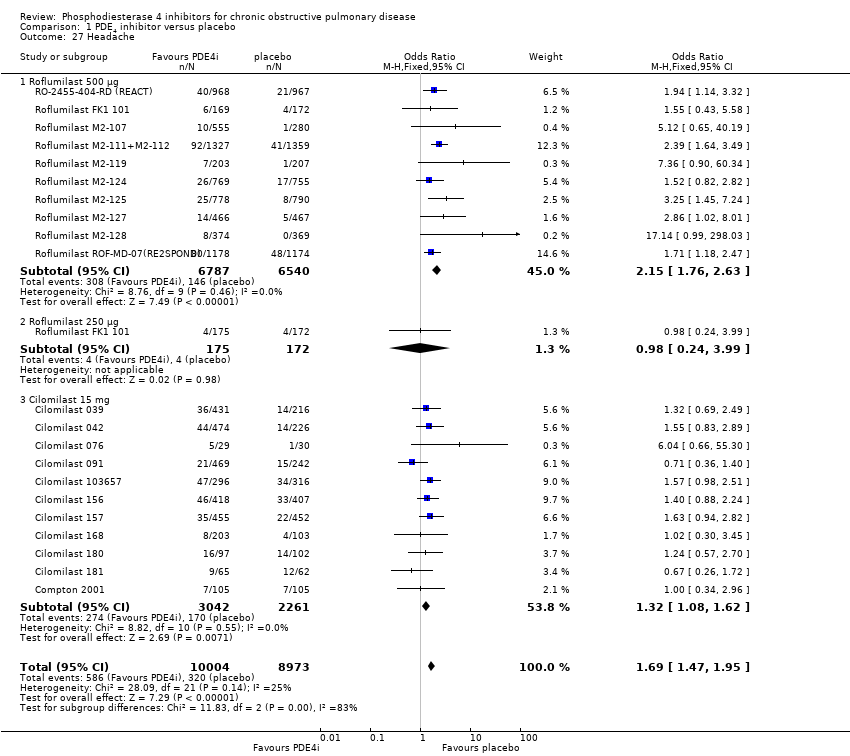
Comparison 1 PDE4 inhibitor versus placebo, Outcome 27 Headache.

Comparison 1 PDE4 inhibitor versus placebo, Outcome 28 Vomiting.
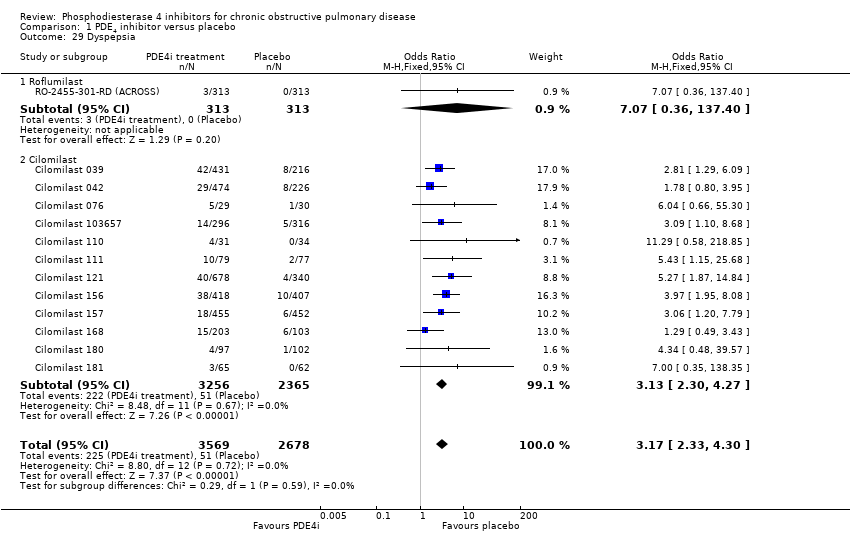
Comparison 1 PDE4 inhibitor versus placebo, Outcome 29 Dyspepsia.
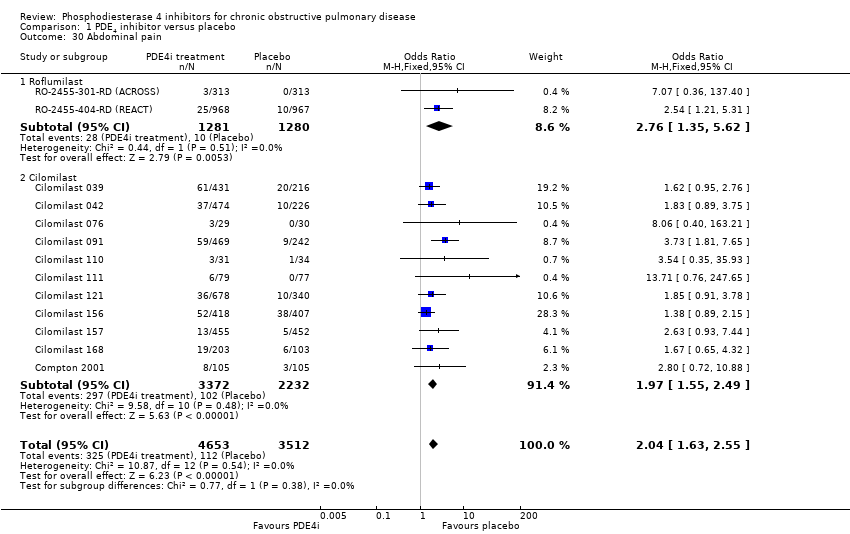
Comparison 1 PDE4 inhibitor versus placebo, Outcome 30 Abdominal pain.

Comparison 1 PDE4 inhibitor versus placebo, Outcome 31 Weight loss.

Comparison 1 PDE4 inhibitor versus placebo, Outcome 32 Influenza‐like symptoms.

Comparison 1 PDE4 inhibitor versus placebo, Outcome 33 Upper respiratory tract infection.
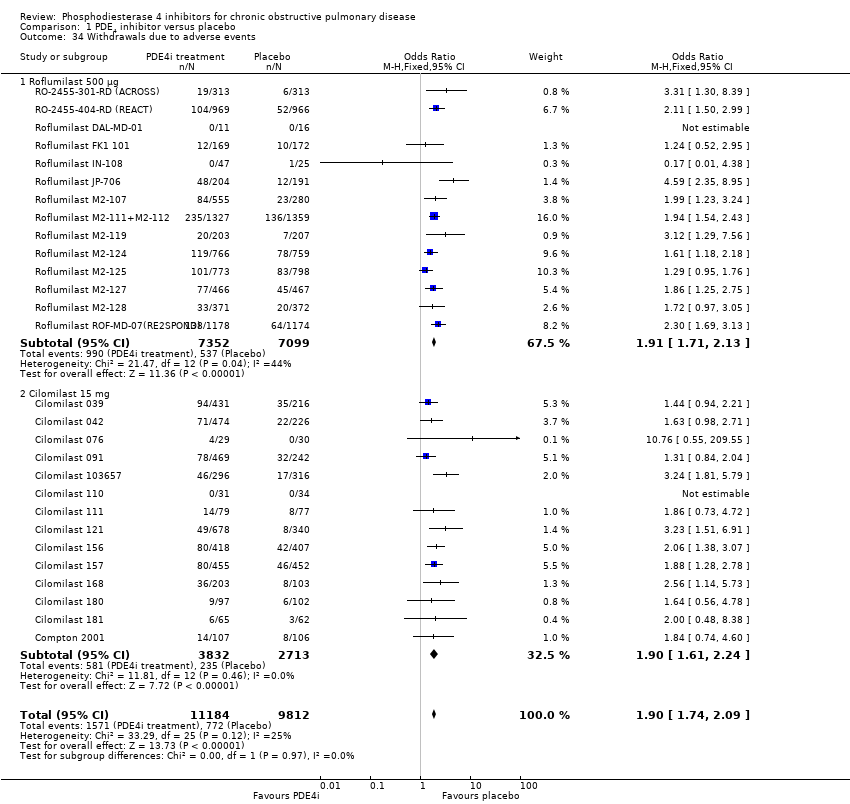
Comparison 1 PDE4 inhibitor versus placebo, Outcome 34 Withdrawals due to adverse events.

Comparison 1 PDE4 inhibitor versus placebo, Outcome 35 Non‐fatal serious adverse events.

Comparison 1 PDE4 inhibitor versus placebo, Outcome 36 Mortality.

Comparison 1 PDE4 inhibitor versus placebo, Outcome 37 All psychiatric disorders (roflumilast).
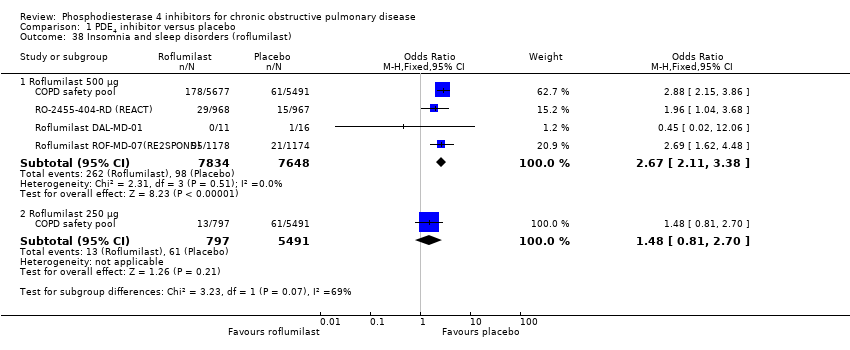
Comparison 1 PDE4 inhibitor versus placebo, Outcome 38 Insomnia and sleep disorders (roflumilast).

Comparison 1 PDE4 inhibitor versus placebo, Outcome 39 Anxiety or anxiety disorder (roflumilast).

Comparison 1 PDE4 inhibitor versus placebo, Outcome 40 Depression (roflumilast).
| Phosphodiesterase 4 inhibitors compared to placebo for chronic obstructive pulmonary disease | ||||||
| Patient or population: people with stable chronic obstructive pulmonary disease | ||||||
| Outcomes | Illustrative comparative risks* (95% CI) | Relative effect | No of participants | Quality of the evidence | Comments | |
| Assumed risk | Corresponding risk | |||||
| Placebo | Phosphodiesterase IV inhibitors | |||||
| Change in FEV1 lung function | The mean change in FEV1 lung function in the control groups was | The mean change in FEV1 lung function in the intervention groups was | 20,585 | ⊕⊕⊕⊝ | ||
| Change in quality of life | The mean change in quality of life in the control groups was an improvement of | The mean change in quality of life in the intervention groups was | 7645 | ⊕⊕⊕⊝ | Lower scores on SGRQ represent improved quality of life. This result does not reach the minimum clinically important difference for this scale. | |
| COPD exacerbations | 33 per 100 | 28 per 100 | OR 0.78 | 19,948 | ⊕⊕⊕⊕ | See Figure 1 |
| Adverse events | 64 per 100 | 69 per 100 | OR 1.29 | 20,988 | ⊕⊕⊕⊝ | This outcome includes participants who reported COPD exacerbations as an adverse event |
| Gastrointestinal side effects | 4 per 100 | 11 per 100 | OR 3.13 | 20,181 | ⊕⊕⊕⊕ | Diarrhoea was the most commonly reported gastrointestinal side effect. See Figure 2 Weight loss was more common, and may be a result of diarrhoea |
| Psychiatric adverse events (roflumilast 500 µg) | 35 per 1000 | 71 per 1000 | OR 2.13 | 11,168 | ⊕⊕⊕⊝ | Pooled data from FDA website, not individual trial reports |
| Mortality (all‐cause) | 1 per 100 | 1 per 100 | OR 0.97 | 19,344 | ⊕⊕⊕⊝ | |
| *The basis for the assumed risk (e.g. the median control group risk across studies) is provided in footnotes. The corresponding risk (and its 95% confidence interval) is based on the assumed risk in the comparison group and the relative effect of the intervention (and its 95% CI). | ||||||
| GRADE Working Group grades of evidence | ||||||
| 1There was a greater proportion of participant withdrawals in the treatment (24%) compared with the control group (19%), but not sufficient to warrant downgrading the quality of evidence. 6There were very few events, leading to wide confidence intervals. | ||||||
| Search date: | No. of references for which we sought full text |
| December 2008 | 53 |
| January 2010 | 5 |
| August 2010 | 12 |
| June 2013 | 20 |
| October 2016 | 28 |
| Outcome or subgroup title | No. of studies | No. of participants | Statistical method | Effect size |
| 1 FEV1 (by drug) Show forest plot | 27 | 20585 | Mean Difference (IV, Random, 95% CI) | 51.53 [43.17, 59.90] |
| 1.1 Roflumilast 500 μg | 17 | 14230 | Mean Difference (IV, Random, 95% CI) | 56.45 [48.01, 64.89] |
| 1.2 Roflumilast 250 μg | 3 | 1033 | Mean Difference (IV, Random, 95% CI) | 56.88 [24.38, 89.38] |
| 1.3 Cilomilast 15 mg | 10 | 5322 | Mean Difference (IV, Random, 95% CI) | 41.03 [23.93, 58.13] |
| 2 FEV1 (by mean COPD severity) Show forest plot | 21 | 16659 | Mean Difference (IV, Fixed, 95% CI) | 52.77 [46.73, 58.82] |
| 2.1 GOLD grade I + II (FEV1 ≥ 50% predicted) | 9 | 4647 | Mean Difference (IV, Fixed, 95% CI) | 51.79 [38.99, 64.59] |
| 2.2 GOLD grade III + IV (FEV1 < 50% predicted) | 12 | 12012 | Mean Difference (IV, Fixed, 95% CI) | 53.06 [46.19, 59.92] |
| 3 FEV1 (Roflumilast 500 μg by mean COPD severity) Show forest plot | 15 | 13742 | Mean Difference (IV, Fixed, 95% CI) | 55.51 [48.88, 62.14] |
| 3.1 GOLD grade I + II (FEV1 ≥ 50% predicted) | 6 | 3187 | Mean Difference (IV, Fixed, 95% CI) | 69.86 [53.34, 86.38] |
| 3.2 GOLD grade III + IV (FEV1 < 50% predicted) | 9 | 10555 | Mean Difference (IV, Fixed, 95% CI) | 52.75 [45.52, 59.99] |
| 4 FEV1 (by study duration) Show forest plot | 27 | 19785 | Mean Difference (IV, Fixed, 95% CI) | 49.08 [43.85, 54.32] |
| 4.1 Duration ≤ 12 weeks | 7 | 1037 | Mean Difference (IV, Fixed, 95% CI) | 102.21 [71.26, 133.16] |
| 4.2 Duration 24 to 26 weeks | 13 | 8086 | Mean Difference (IV, Fixed, 95% CI) | 46.14 [38.44, 53.84] |
| 4.3 Duration 52 weeks | 7 | 10662 | Mean Difference (IV, Fixed, 95% CI) | 48.77 [41.44, 56.10] |
| 5 FEV1 (additional medication) Show forest plot | 27 | 19565 | Mean Difference (IV, Fixed, 95% CI) | 49.08 [43.84, 54.31] |
| 5.1 Long‐acting bronchodilator | 2 | 1645 | Mean Difference (IV, Fixed, 95% CI) | 60.52 [40.57, 80.46] |
| 5.2 Corticosteroids | 3 | 2904 | Mean Difference (IV, Fixed, 95% CI) | 42.26 [25.46, 59.05] |
| 5.3 PDE4i treatment only | 19 | 10169 | Mean Difference (IV, Fixed, 95% CI) | 44.78 [37.67, 51.90] |
| 5.4 Various concomitant treatments | 3 | 4847 | Mean Difference (IV, Fixed, 95% CI) | 56.58 [46.91, 66.25] |
| 6 FEV1 (published versus unpublished) Show forest plot | 27 | 19785 | Mean Difference (IV, Fixed, 95% CI) | 49.23 [43.99, 54.46] |
| 6.1 Published | 19 | 15244 | Mean Difference (IV, Fixed, 95% CI) | 55.75 [49.44, 62.06] |
| 6.2 Unpublished | 8 | 4541 | Mean Difference (IV, Fixed, 95% CI) | 34.82 [25.44, 44.19] |
| 7 FEV1 (random‐effects model) Show forest plot | 27 | 19785 | Mean Difference (IV, Random, 95% CI) | 51.47 [42.68, 60.26] |
| 8 FEV1 (roflumilast 500 μg versus 250 μg) Show forest plot | 3 | 1560 | Mean Difference (IV, Fixed, 95% CI) | 22.61 [‐5.95, 51.16] |
| 9 FVC Show forest plot | 16 | 21954 | Mean Difference (IV, Fixed, 95% CI) | 87.28 [74.87, 99.70] |
| 10 PEF Show forest plot | 5 | 4245 | Mean Difference (IV, Fixed, 95% CI) | 6.54 [3.95, 9.13] |
| 10.1 Roflumilast 500 μg | 4 | 3685 | Mean Difference (IV, Fixed, 95% CI) | 5.46 [2.74, 8.17] |
| 10.2 Roflumilast 250 μg | 1 | 347 | Mean Difference (IV, Fixed, 95% CI) | 7.0 [‐4.05, 18.05] |
| 10.3 Cilomilast 15 mg | 1 | 213 | Mean Difference (IV, Fixed, 95% CI) | 34.0 [20.14, 47.86] |
| 11 SGRQ total score Show forest plot | 11 | 7645 | Mean Difference (IV, Fixed, 95% CI) | ‐1.06 [‐1.68, ‐0.43] |
| 11.1 Roflumilast 500 μg | 3 | 2235 | Mean Difference (IV, Fixed, 95% CI) | ‐0.79 [‐2.16, 0.58] |
| 11.2 Roflumilast 250 μg | 1 | 716 | Mean Difference (IV, Fixed, 95% CI) | ‐1.60 [‐3.56, 0.36] |
| 11.3 Cilomilast 15 mg | 8 | 4694 | Mean Difference (IV, Fixed, 95% CI) | ‐1.06 [‐1.81, ‐0.31] |
| 12 SGRQ total score (by published versus unpublished) Show forest plot | 11 | 7069 | Mean Difference (IV, Fixed, 95% CI) | 1.00 [‐1.65, ‐0.34] |
| 12.1 Published | 5 | 3079 | Mean Difference (IV, Fixed, 95% CI) | ‐1.98 [‐3.07, ‐0.89] |
| 12.2 Unpublished | 6 | 3990 | Mean Difference (IV, Fixed, 95% CI) | ‐0.43 [‐1.26, 0.40] |
| 13 SGRQ total score (by duration) Show forest plot | 11 | 7069 | Mean Difference (IV, Fixed, 95% CI) | ‐0.99 [‐1.65, ‐0.33] |
| 13.1 Duration < 12 weeks | 2 | 240 | Mean Difference (IV, Fixed, 95% CI) | ‐4.19 [‐7.60, ‐0.78] |
| 13.2 Duration 24 to 26 weeks | 7 | 4600 | Mean Difference (IV, Fixed, 95% CI) | ‐1.18 [‐1.94, ‐0.42] |
| 13.3 Duration 52 weeks | 2 | 2229 | Mean Difference (IV, Fixed, 95% CI) | 0.26 [‐1.18, 1.69] |
| 14 SGRQ total score (by mean COPD severity) Show forest plot | 8 | 4851 | Mean Difference (IV, Fixed, 95% CI) | ‐1.56 [‐2.39, ‐0.74] |
| 14.1 GOLD grade I and II | 3 | 2042 | Mean Difference (IV, Fixed, 95% CI) | ‐1.62 [‐2.80, ‐0.44] |
| 14.2 GOLD grade III and IV | 5 | 2809 | Mean Difference (IV, Fixed, 95% CI) | ‐1.51 [‐2.67, ‐0.34] |
| 15 SGRQ symptom score Show forest plot | 2 | 1048 | Mean Difference (IV, Fixed, 95% CI) | ‐1.53 [‐4.11, 1.06] |
| 15.1 Roflumilast | 1 | 835 | Mean Difference (IV, Fixed, 95% CI) | 1.00 [‐3.78, 1.78] |
| 15.2 Cilomilast | 1 | 213 | Mean Difference (IV, Fixed, 95% CI) | ‐4.80 [‐11.73, 2.13] |
| 16 Number of participants with one or more exacerbations (by drug) Show forest plot | 23 | 19948 | Odds Ratio (M‐H, Fixed, 95% CI) | 0.78 [0.73, 0.83] |
| 16.1 Roflumilast 500 μg | 13 | 14420 | Odds Ratio (M‐H, Fixed, 95% CI) | 0.79 [0.73, 0.86] |
| 16.2 Cilomilast | 10 | 5528 | Odds Ratio (M‐H, Fixed, 95% CI) | 0.76 [0.67, 0.85] |
| 17 Number of participants on roflumilast with one or more exacerbations (additional medication) Show forest plot | 13 | 14420 | Odds Ratio (M‐H, Fixed, 95% CI) | 0.79 [0.73, 0.86] |
| 17.1 Long‐acting bronchodilators | 2 | 1676 | Odds Ratio (M‐H, Fixed, 95% CI) | 0.69 [0.54, 0.88] |
| 17.2 Corticosteroids | 1 | 2686 | Odds Ratio (M‐H, Fixed, 95% CI) | 0.81 [0.70, 0.95] |
| 17.3 Treatment only | 7 | 5145 | Odds Ratio (M‐H, Fixed, 95% CI) | 0.79 [0.67, 0.93] |
| 17.4 Various concomitant treatments | 3 | 4913 | Odds Ratio (M‐H, Fixed, 95% CI) | 0.81 [0.72, 0.91] |
| 18 Exacerbation rate (inverse variance) Show forest plot | 9 | Rate Ratio (Fixed, 95% CI) | 0.88 [0.83, 0.93] | |
| 18.1 Roflumilast | 8 | Rate Ratio (Fixed, 95% CI) | 0.87 [0.82, 0.92] | |
| 18.2 Cilomilast | 1 | Rate Ratio (Fixed, 95% CI) | 0.95 [0.78, 1.17] | |
| 19 Borg Scale Show forest plot | 6 | 2860 | Mean Difference (IV, Fixed, 95% CI) | ‐0.19 [‐0.33, ‐0.05] |
| 19.1 Cilomilast | 6 | 2860 | Mean Difference (IV, Fixed, 95% CI) | ‐0.19 [‐0.33, ‐0.05] |
| 20 Summary symptom score Show forest plot | 5 | 6186 | Std. Mean Difference (IV, Fixed, 95% CI) | ‐0.02 [‐0.07, 0.03] |
| 20.1 Roflumilast | 2 | 4287 | Std. Mean Difference (IV, Fixed, 95% CI) | ‐0.02 [‐0.08, 0.04] |
| 20.2 Cilomilast | 3 | 1899 | Std. Mean Difference (IV, Fixed, 95% CI) | ‐0.04 [‐0.13, 0.06] |
| 21 Shortness of breath questionnaire Show forest plot | 2 | 1633 | Mean Difference (IV, Fixed, 95% CI) | ‐1.09 [‐2.47, 0.28] |
| 22 6‐minute walk test Show forest plot | 5 | 1975 | Mean Difference (IV, Fixed, 95% CI) | 2.09 [‐7.39, 11.57] |
| 22.1 Roflumilast | 1 | 27 | Mean Difference (IV, Fixed, 95% CI) | 55.0 [‐111.29, 221.29] |
| 22.2 Cilomilast | 4 | 1948 | Mean Difference (IV, Fixed, 95% CI) | 1.92 [‐7.58, 11.41] |
| 23 Number of participants experiencing an adverse effect Show forest plot | 27 | 20988 | Odds Ratio (M‐H, Fixed, 95% CI) | 1.29 [1.22, 1.37] |
| 23.1 Roflumilast 500 μg | 13 | 14446 | Odds Ratio (M‐H, Fixed, 95% CI) | 1.33 [1.24, 1.42] |
| 23.2 Cilomilast 15 mg | 14 | 6542 | Odds Ratio (M‐H, Fixed, 95% CI) | 1.21 [1.08, 1.36] |
| 24 Number of participants experiencing an adverse event (Roflumilast 500 μg versus 250 μg) Show forest plot | 4 | 1977 | Odds Ratio (M‐H, Fixed, 95% CI) | 1.21 [1.01, 1.46] |
| 25 Diarrhoea Show forest plot | 25 | 20181 | Odds Ratio (M‐H, Fixed, 95% CI) | 3.13 [2.76, 3.54] |
| 25.1 Roflumilast | 11 | 13639 | Odds Ratio (M‐H, Fixed, 95% CI) | 3.72 [3.15, 4.38] |
| 25.2 Cilomilast | 14 | 6542 | Odds Ratio (M‐H, Fixed, 95% CI) | 2.47 [2.05, 2.98] |
| 26 Nausea Show forest plot | 24 | 20627 | Odds Ratio (M‐H, Fixed, 95% CI) | 3.78 [3.23, 4.43] |
| 26.1 Roflumilast 500 μg | 10 | 13229 | Odds Ratio (M‐H, Fixed, 95% CI) | 3.21 [2.57, 4.03] |
| 26.2 Roflumilast 250 μg | 1 | 856 | Odds Ratio (M‐H, Fixed, 95% CI) | 3.97 [0.91, 17.39] |
| 26.3 Cilomilast 15 mg | 14 | 6542 | Odds Ratio (M‐H, Fixed, 95% CI) | 4.37 [3.49, 5.47] |
| 27 Headache Show forest plot | 21 | 18977 | Odds Ratio (M‐H, Fixed, 95% CI) | 1.69 [1.47, 1.95] |
| 27.1 Roflumilast 500 μg | 10 | 13327 | Odds Ratio (M‐H, Fixed, 95% CI) | 2.15 [1.76, 2.63] |
| 27.2 Roflumilast 250 μg | 1 | 347 | Odds Ratio (M‐H, Fixed, 95% CI) | 0.98 [0.24, 3.99] |
| 27.3 Cilomilast 15 mg | 11 | 5303 | Odds Ratio (M‐H, Fixed, 95% CI) | 1.32 [1.08, 1.62] |
| 28 Vomiting Show forest plot | 11 | 5828 | Odds Ratio (M‐H, Fixed, 95% CI) | 4.01 [2.80, 5.74] |
| 28.1 Roflumilast | 1 | 835 | Odds Ratio (M‐H, Fixed, 95% CI) | 1.52 [0.06, 37.37] |
| 28.2 Cilomilast | 10 | 4993 | Odds Ratio (M‐H, Fixed, 95% CI) | 4.06 [2.83, 5.82] |
| 29 Dyspepsia Show forest plot | 13 | 6247 | Odds Ratio (M‐H, Fixed, 95% CI) | 3.17 [2.33, 4.30] |
| 29.1 Roflumilast | 1 | 626 | Odds Ratio (M‐H, Fixed, 95% CI) | 7.07 [0.36, 137.40] |
| 29.2 Cilomilast | 12 | 5621 | Odds Ratio (M‐H, Fixed, 95% CI) | 3.13 [2.30, 4.27] |
| 30 Abdominal pain Show forest plot | 13 | 8165 | Odds Ratio (M‐H, Fixed, 95% CI) | 2.04 [1.63, 2.55] |
| 30.1 Roflumilast | 2 | 2561 | Odds Ratio (M‐H, Fixed, 95% CI) | 2.76 [1.35, 5.62] |
| 30.2 Cilomilast | 11 | 5604 | Odds Ratio (M‐H, Fixed, 95% CI) | 1.97 [1.55, 2.49] |
| 31 Weight loss Show forest plot | 9 | 12178 | Odds Ratio (M‐H, Fixed, 95% CI) | 3.76 [3.11, 4.54] |
| 31.1 Roflumilast | 9 | 12178 | Odds Ratio (M‐H, Fixed, 95% CI) | 3.76 [3.11, 4.54] |
| 32 Influenza‐like symptoms Show forest plot | 9 | 11460 | Odds Ratio (M‐H, Fixed, 95% CI) | 1.09 [0.87, 1.36] |
| 32.1 Roflumilast 500 μg | 7 | 10147 | Odds Ratio (M‐H, Fixed, 95% CI) | 1.11 [0.87, 1.41] |
| 32.2 Roflumilast 250 μg | 1 | 347 | Odds Ratio (M‐H, Fixed, 95% CI) | 1.98 [0.18, 22.00] |
| 32.3 Cilomilast 15 mg | 2 | 966 | Odds Ratio (M‐H, Fixed, 95% CI) | 0.88 [0.44, 1.75] |
| 33 Upper respiratory tract infection Show forest plot | 20 | 16902 | Odds Ratio (M‐H, Fixed, 95% CI) | 0.90 [0.79, 1.02] |
| 33.1 Roflumilast 500 μg | 10 | 11419 | Odds Ratio (M‐H, Fixed, 95% CI) | 0.90 [0.75, 1.07] |
| 33.2 Roflumilast 250 μg | 2 | 1203 | Odds Ratio (M‐H, Fixed, 95% CI) | 0.84 [0.54, 1.31] |
| 33.3 Cilomilast 15 mg | 10 | 4280 | Odds Ratio (M‐H, Fixed, 95% CI) | 0.92 [0.75, 1.13] |
| 34 Withdrawals due to adverse events Show forest plot | 28 | 20996 | Odds Ratio (M‐H, Fixed, 95% CI) | 1.90 [1.74, 2.09] |
| 34.1 Roflumilast 500 μg | 14 | 14451 | Odds Ratio (M‐H, Fixed, 95% CI) | 1.91 [1.71, 2.13] |
| 34.2 Cilomilast 15 mg | 14 | 6545 | Odds Ratio (M‐H, Fixed, 95% CI) | 1.90 [1.61, 2.24] |
| 35 Non‐fatal serious adverse events Show forest plot | 24 | 18689 | Odds Ratio (M‐H, Fixed, 95% CI) | 0.99 [0.91, 1.07] |
| 35.1 Roflumilast 500 μg | 10 | 12144 | Odds Ratio (M‐H, Fixed, 95% CI) | 1.01 [0.93, 1.11] |
| 35.2 Cilomilast 15 mg | 14 | 6545 | Odds Ratio (M‐H, Fixed, 95% CI) | 0.87 [0.72, 1.06] |
| 36 Mortality Show forest plot | 23 | 19344 | Odds Ratio (M‐H, Fixed, 95% CI) | 0.97 [0.76, 1.23] |
| 36.1 Roflumilast | 10 | 13012 | Odds Ratio (M‐H, Fixed, 95% CI) | 1.01 [0.78, 1.29] |
| 36.2 Cilomilast | 13 | 6332 | Odds Ratio (M‐H, Fixed, 95% CI) | 0.70 [0.34, 1.45] |
| 37 All psychiatric disorders (roflumilast) Show forest plot | 1 | Odds Ratio (M‐H, Fixed, 95% CI) | Subtotals only | |
| 37.1 Roflumilast 500 μg | 1 | 11168 | Odds Ratio (M‐H, Fixed, 95% CI) | 2.13 [1.79, 2.54] |
| 37.2 Roflumilast 250 μg | 1 | 6288 | Odds Ratio (M‐H, Fixed, 95% CI) | 0.87 [0.56, 1.33] |
| 38 Insomnia and sleep disorders (roflumilast) Show forest plot | 4 | Odds Ratio (M‐H, Fixed, 95% CI) | Subtotals only | |
| 38.1 Roflumilast 500 μg | 4 | 15482 | Odds Ratio (M‐H, Fixed, 95% CI) | 2.67 [2.11, 3.38] |
| 38.2 Roflumilast 250 μg | 1 | 6288 | Odds Ratio (M‐H, Fixed, 95% CI) | 1.48 [0.81, 2.70] |
| 39 Anxiety or anxiety disorder (roflumilast) Show forest plot | 1 | Odds Ratio (M‐H, Fixed, 95% CI) | Subtotals only | |
| 39.1 Roflumilast 500 μg | 1 | 11168 | Odds Ratio (M‐H, Fixed, 95% CI) | 1.81 [1.26, 2.62] |
| 39.2 Roflumilast 250 μg | 1 | 6288 | Odds Ratio (M‐H, Fixed, 95% CI) | 0.94 [0.40, 2.21] |
| 40 Depression (roflumilast) Show forest plot | 1 | Odds Ratio (M‐H, Fixed, 95% CI) | Subtotals only | |
| 40.1 Roflumilast 500 μg | 1 | 11168 | Odds Ratio (M‐H, Fixed, 95% CI) | 1.59 [1.11, 2.27] |
| 40.2 Roflumilast 250 μg | 1 | 6288 | Odds Ratio (M‐H, Fixed, 95% CI) | 0.56 [0.20, 1.56] |