Clomifeno y otros antiestrógenos para la inducción de la ovulación en el síndrome de ovarios poliquísticos
Información
- DOI:
- https://doi.org/10.1002/14651858.CD002249.pub5Copiar DOI

- Base de datos:
-
- Cochrane Database of Systematic Reviews
- Versión publicada:
-
- 15 diciembre 2016see what's new
- Tipo:
-
- Intervention
- Etapa:
-
- Review
- Grupo Editorial Cochrane:
-
Grupo Cochrane de Ginecología y fertilidad
- Copyright:
-
- Copyright © 2017 The Cochrane Collaboration. Published by John Wiley & Sons, Ltd.
Cifras del artículo
Altmetric:
Citado por:
Autores
Contributions of authors
Julie Brown: wrote the updated version of the review, including identification of new trials, data extraction, and analysis.
Cindy Farquhar: initiated and conceptualised the protocol, commented on drafts of the original and updated review, and assisted in the identification of new trials and data extraction for the review update.
Sources of support
Internal sources
-
University of Auckland, New Zealand.
Provided salary support for Julie Brown to update this review
External sources
-
None, Other.
Declarations of interest
Julie Brown: None known.
Cindy Farquhar is a director/shareholder of a gynaecology clinic and undertakes private practice within those premises.
Acknowledgements
The authors of the 2016 update thank Drs James Beck, Clare Boothroyd, J Collins, P Vandekerckhove and Edward Hughes for their contributions to previous versions of the review.
Version history
| Published | Title | Stage | Authors | Version |
| 2016 Dec 15 | Clomiphene and other antioestrogens for ovulation induction in polycystic ovarian syndrome | Review | Julie Brown, Cindy Farquhar | |
| 2009 Oct 07 | Clomiphene and anti‐oestrogens for ovulation induction in PCOS | Review | Julie Brown, Cindy Farquhar, James Beck, Clare Boothroyd, Edward Hughes | |
| 2009 Jul 08 | Oral anti‐oestrogens and medical adjuncts for subfertility associated with anovulation | Review | Julie Brown , Cindy Farquhar, James Beck, Clare Boothroyd, Michelle Proctor, Edward Hughes | |
| 2004 Jul 19 | Oral anti‐oestrogens and medical adjuncts for subfertility associated with polycystic ovary syndrome | Protocol | James I Beck, Clare Boothroyd, Cindy M Farquhar | |
| 2000 Jul 24 | Oral agents for ovulation induction in subfertility associated with PCOS | Protocol | C Boothroyd, C Farquhar | |
Differences between protocol and review
In the 2009 review we widened the inclusion criteria of this review from that of the original protocol (women with anovulation attributed to polycystic ovarian syndrome (PCOS)) to include all World Health Organization (WHO) group 2 causes of anovulation, but excluding hyperprolactinaemia. We included trials that were non‐specific but appeared to describe PCOS‐like anovulation (e.g. women with progestin‐induced withdrawal bleeding). Due to the age of many of the trials, particularly for the comparison of clomiphene versus placebo, the most likely cause of anovulation was not fully described. In particular, the currently utilised diagnostic criteria for PCOS were not able to be met. These trials would have been excluded under the criteria of the protocol. We felt that their results were valid and important, and so widened the background and inclusion criteria sections of this review.
In the 2009 review we removed aromatase inhibitor comparisons from this review, as they have been addressed within a separate review (Franik 2014)
In the 2009 review we changed the title from 'Oral anti‐oestrogens and medical adjuncts for subfertility associated with anovulation' to 'Clomiphene and antioestrogens for ovulation induction in polycystic ovarian syndrome'.
In the 2016 update we removed as an outcome 'ovulation rate (per woman), where ovulation was defined as evidence of serum progesterone in the luteal range for the reference laboratory or a basal body temperature rise by > 0.4 ºC for 10 days or more as measured by a basal body temperature chart'.
Keywords
MeSH
Medical Subject Headings (MeSH) Keywords
- Anovulation [*complications, drug therapy];
- Clomiphene [adverse effects, *therapeutic use];
- Contraceptives, Oral, Combined [therapeutic use];
- Dexamethasone [therapeutic use];
- Drug Therapy, Combination [methods];
- Estrogen Antagonists [adverse effects, *therapeutic use];
- Gonadotropins [therapeutic use];
- Infertility, Female [*drug therapy, etiology];
- Live Birth;
- Polycystic Ovary Syndrome [complications];
- Randomized Controlled Trials as Topic;
- Tamoxifen [therapeutic use];
Medical Subject Headings Check Words
Female; Humans;
PICO

Study flow diagram for update 2016.
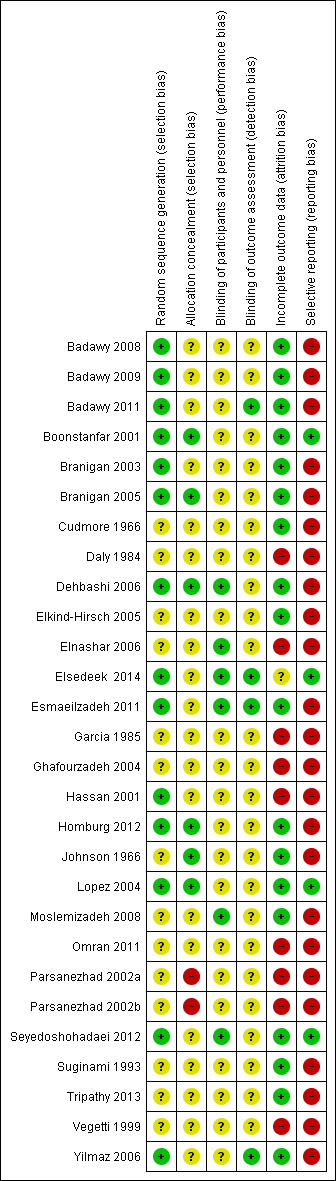
Methodological quality summary: review authors' judgements about each methodological quality item for each included study.
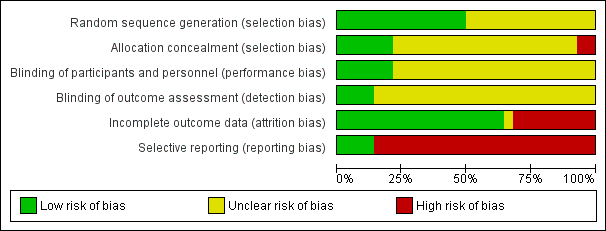
Methodological quality graph: review authors' judgements about each methodological quality item presented as percentages across all included studies.
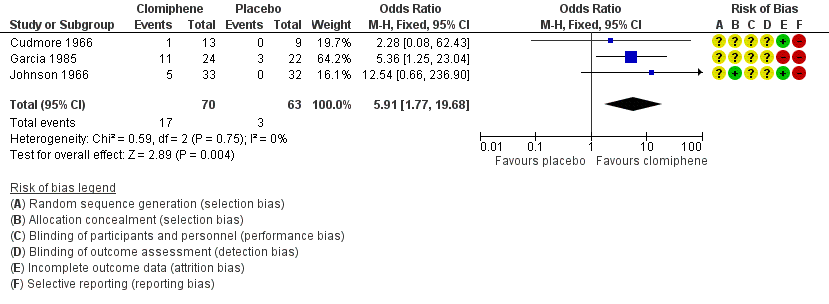
Forest plot of comparison: 1 Antioestrogen versus no treatment or placebo, outcome: 1.1 Clinical pregnancy rate (per woman randomised).

Forest plot of comparison: 2 Antioestrogen versus antioestrogen, outcome: 2.1 Live birth rate (per woman).
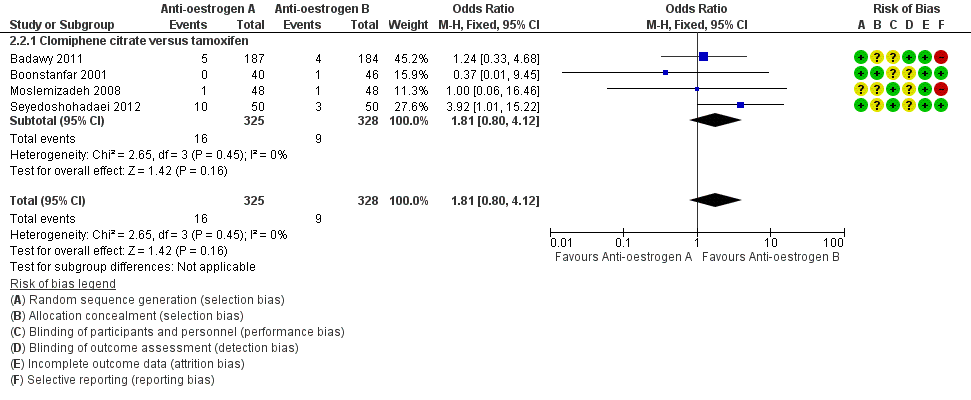
Forest plot of comparison: 2 Antioestrogen versus antioestrogen, outcome: 2.2 Miscarriage rate (per woman).

Forest plot of comparison: 3 Antioestrogen versus gonadotropin, outcome: 3.1 Live birth/ongoing pregnancy.

Forest plot of comparison: 3 Antioestrogen versus gonadotropin, outcome: 3.2 Miscarriage rate (per woman).
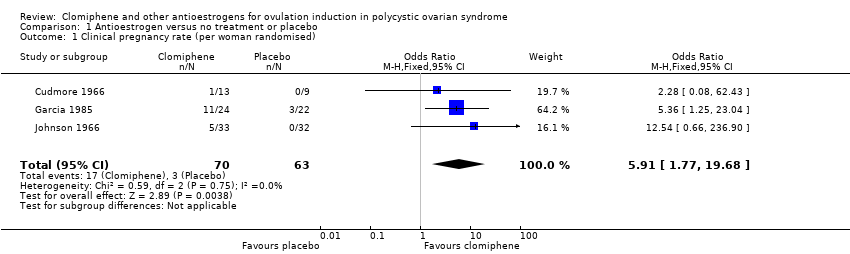
Comparison 1 Antioestrogen versus no treatment or placebo, Outcome 1 Clinical pregnancy rate (per woman randomised).
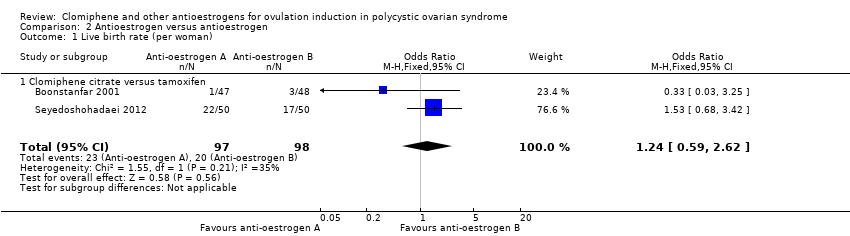
Comparison 2 Antioestrogen versus antioestrogen, Outcome 1 Live birth rate (per woman).

Comparison 2 Antioestrogen versus antioestrogen, Outcome 2 Miscarriage rate (per woman).

Comparison 2 Antioestrogen versus antioestrogen, Outcome 3 Clinical pregnancy rate (per woman).
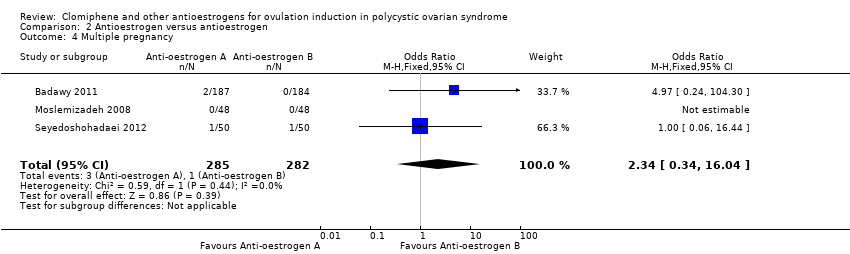
Comparison 2 Antioestrogen versus antioestrogen, Outcome 4 Multiple pregnancy.

Comparison 2 Antioestrogen versus antioestrogen, Outcome 5 OHSS.
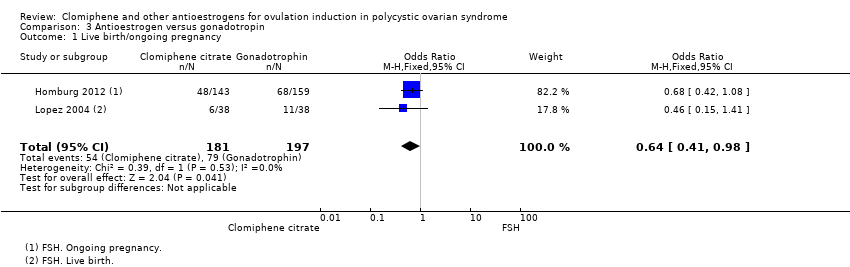
Comparison 3 Antioestrogen versus gonadotropin, Outcome 1 Live birth/ongoing pregnancy.

Comparison 3 Antioestrogen versus gonadotropin, Outcome 2 Miscarriage rate (per woman).

Comparison 3 Antioestrogen versus gonadotropin, Outcome 3 Clinical pregnancy rate (per woman).
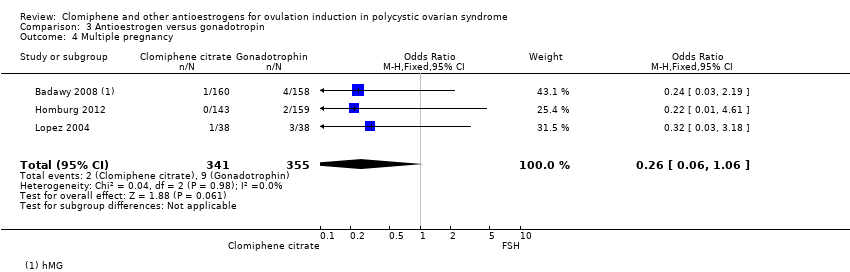
Comparison 3 Antioestrogen versus gonadotropin, Outcome 4 Multiple pregnancy.

Comparison 3 Antioestrogen versus gonadotropin, Outcome 5 OHSS.

Comparison 4 Antioestrogen plus medical adjunct versus antioestrogen alone, Outcome 1 Clomiphene citrate plus ketoconazole versus clomiphene citrate.

Comparison 4 Antioestrogen plus medical adjunct versus antioestrogen alone, Outcome 2 Clomiphene citrate plus bromocriptine versus clomiphene citrate.

Comparison 4 Antioestrogen plus medical adjunct versus antioestrogen alone, Outcome 3 Clomiphene citrate plus dexamethasone versus clomiphene citrate.

Comparison 4 Antioestrogen plus medical adjunct versus antioestrogen alone, Outcome 4 Clomiphene citrate plus combined oral contraceptive versus clomiphene citrate.

Comparison 4 Antioestrogen plus medical adjunct versus antioestrogen alone, Outcome 5 Clomiphene citrate plus hCG versus clomiphene citrate alone.

Comparison 4 Antioestrogen plus medical adjunct versus antioestrogen alone, Outcome 6 Clomiphene citrate plus hormone supplementation versus clomiphene citrate alone.

Comparison 5 Clomiphene citrate regimens, Outcome 1 Live birth.

Comparison 5 Clomiphene citrate regimens, Outcome 2 Miscarriage rate.
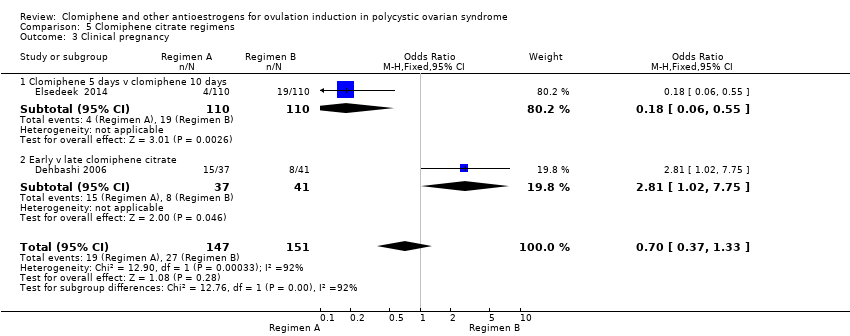
Comparison 5 Clomiphene citrate regimens, Outcome 3 Clinical pregnancy.

Comparison 5 Clomiphene citrate regimens, Outcome 4 Multiple pregnancy.
| Antioestrogen versus placebo | ||||||
| Patient or population: ovulation induction in polycystic ovarian syndrome Setting: USA/Canada. 1 trial took place in a department of obstetrics and gynaecology; details of setting for 2 trials not provided. | ||||||
| Outcomes | Anticipated absolute effects* (95% CI) | Relative effect | № of participants | Quality of the evidence | Comments | |
| Risk with no treatment or placebo | Risk with antioestrogen | |||||
| Live birth rate ‐ not reported | See comment | See comment | Not estimable | ‐ | ‐ | No data for live birth reported for this comparison |
| Miscarriage rate ‐ not reported | See comment | See comment | Not estimable | ‐ | ‐ | No data for miscarriage reported for this comparison |
| Clinical pregnancy rate | 48 per 1000 | 228 per 1000 | OR 5.91 | 133 | ⊕⊕⊝⊝ | Low event rates and small sample size observed in included trials |
| Multiple pregnancy rate ‐ not reported | See comment | See comment | Not estimable | ‐ | ‐ | No data for multiple pregnancy reported for this comparison |
| Ovarian hyperstimulation syndrome (OHSS) ‐ not reported | See comment | See comment | Not estimable | ‐ | ‐ | No data for OHSS reported for this comparison |
| *The risk in the intervention group (and its 95% confidence interval) is based on the assumed risk in the comparison group and the relative effect of the intervention (and its 95% CI). | ||||||
| GRADE Working Group grades of evidence | ||||||
| 1Wide confidence intervals with low event rates and small sample size suggest imprecision ‐ downgraded one level. | ||||||
| Antioestrogen versus antioestrogen | ||||||
| Patient or population: ovulation induction in polycystic ovarian syndrome Setting: Egypt, USA/Canada, Iran (2 trials), Italy. Trials conducted in outpatient department, infertility clinic (2 trials), private clinic, and 1 trial did not report setting. | ||||||
| Outcomes | Anticipated absolute effects* (95% CI) | Relative effect | № of participants | Quality of the evidence | Comments | |
| Risk with antioestrogen | Risk with antioestrogen | |||||
| Clomiphene citrate versus tamoxifen ‐ Live birth rate | 204 per 1000 | 241 per 1000 | OR 1.24 | 195 | ⊕⊕⊝⊝ | Low event rates and small sample size observed in the included studies |
| Clomiphene citrate versus tamoxifen ‐ Miscarriage rate | 27 per 1000 | 49 per 1000 | OR 1.81 | 653 | ⊕⊕⊝⊝ | Low event rates observed in included studies |
| Clomiphene citrate versus tamoxifen ‐ Clinical pregnancy rate | 221 per 1000 | 270 per 1000 | OR 1.30 | 757 | ⊕⊕⊝⊝ | |
| Clomiphene citrate versus tamoxifen ‐ Multiple pregnancy | 4 per 1000 | 8 per 1000 | OR 2.34 | 567 | ⊕⊝⊝⊝ | Low event rates observed in included studies |
| Clomiphene citrate versus tamoxifen ‐ ovarian hyperstimulation syndrome (OHSS) | Not pooled | Not pooled | Not estimable | 567 | ‐ | No events of OHSS reported in either intervention or control group in the included studies |
| Clomiphene citrate plus tamoxifen versus clomiphene citrate ‐ Clinical pregnancy rate | 0 per 1000 | 0 per 1000 | OR 3.32 | 20 | ⊕⊝⊝⊝ | Very low event rates and very small sample size (n = 20 women) observed in this study |
| *The risk in the intervention group (and its 95% confidence interval) is based on the assumed risk in the comparison group and the relative effect of the intervention (and its 95% CI). | ||||||
| GRADE Working Group grades of evidence | ||||||
| 1Low event rates and small sample size increase the chance of imprecision ‐ downgraded one level. | ||||||
| Antioestrogen plus medical adjunct versus antioestrogen alone | ||||||
| Patient or population: ovulation induction in polycystic ovarian syndrome Setting: Four studies from Iran, three from USA, two from Egypt, one from Turkey and one from India. Studies conducted in a University clinic, infertility outpatient clinic, Women's hospital clinic, Infertility and Reproductive Health Centre, private infertility clinic, Women's Health Research Institute, Infertiltiy Clinic and Research Clinic; three studies provided no information. | ||||||
| Comparison | Anticipated absolute effects* (95% CI) | Relative effect | № of participants | Quality of the evidence | Comments | |
| Risk with antioestrogen alone | Risk with antioestrogen plus medical adjunct | |||||
| Clomiphene citrate plus ketoconazole versus clomiphene citrate | Miscarriage rate | ⊕⊝⊝⊝ | Low event rates and small sample size in this single study | |||
| 27 per 1000 | 8 per 1000 | OR 0.28 | 80 | |||
| Clinical pregnancy rate | ⊕⊝⊝⊝ | Low event rates and small sample size in this single study | ||||
| 216 per 1000 | 395 per 1000 | OR 2.37 | 80 | |||
| Multiple pregnancy | ⊕⊝⊝⊝ | Low event rates and small sample size in this single study | ||||
| 162 per 1000 | 186 per 1000 | OR 1.18 | 80 | |||
| Clomiphene citrate plus bromocriptine versus clomiphene citrate ‐ Clinical pregnancy rate | 187 per 1000 | 191 per 1000 | OR 1.03 | 174 | ⊕⊕⊝⊝ | Low event rates and small sample size observed in the included studies |
| Clomiphene citrate plus dexamethasone versus clomiphene citrate | Clinical pregnancy rate | ⊕⊝⊝⊝ | ||||
| 81 per 1000 | 355 per 1000 | OR 6.20 | 434 | |||
| Multiple pregnancy rate | ⊕⊕⊝⊝ | Low event rates and small sample size observed in these studies. One study had no events in the intervention or the control group. | ||||
| 0 per 1000 | 0 per 1000 | OR 7.71 | 144 | |||
| Clomiphene citrate plus combined oral contraceptive versus clomiphene citrate ‐ Miscarriage rate | Miscarriage rate | ⊕⊝⊝⊝ | Low event rates and small sample size observed in this single study | |||
| 42 per 1000 | 42 per 1000 | OR 1.00 | 48 | |||
| Clinical pregnancy rate | ⊕⊝⊝⊝ | Low event rates and small sample size observed in this single study | ||||
| 42 per 1000 | 542 per 1000 | OR 27.18 | 48 | |||
| Multiple pregnancy | ⊕⊝⊝⊝ | Low event rates and small sample size observed in this single study | ||||
| 0 per 1000 | 0 per 1000 | OR 7.98 | 48 | |||
| Clomiphene citrate plus hCG versus clomiphene citrate alone | Ongoing pregnancy rate | ⊕⊝⊝⊝ | Low event rates and small sample size observed in this single study | |||
| 277 per 1000 | 334 per 1000 | OR 1.31 | 125 | |||
| Miscarriage rate | ⊕⊕⊕⊝ | Low event rates and small sample size observed in the included studies | ||||
| 61 per 1000 | 44 per 1000 | OR 0.70 | 192 | |||
| Clinical pregnancy rate | ⊕⊕⊕⊝ | Low event rates and small sample size observed in the included studies | ||||
| 235 per 1000 | 266 per 1000 | OR 1.18 | 192 | |||
| Multiple pregnancies | ⊕⊝⊝⊝ | Low event rates and small sample size observed in this single study | ||||
| 15 per 1000 | 33 per 1000 | OR 2.21 | 125 | |||
| Clomiphene citrate plus hormone supplementation versus clomiphene citrate alone | Miscarriage rate | ⊕⊝⊝⊝ | Low event rates and small sample size observed in this single study | |||
| 21 per 1000 | 21 per 1000 | OR 1.00 | 96 | |||
| Clinical pregnancy rate | ⊕⊕⊝⊝ | Low event rates and small sample size observed in these studies | ||||
| 220 per 1000 | 186 per 1000 | OR 0.81 | 161 | |||
| Multiple pregnancy rate | ‐ | No events of multiple pregnancy were observed in either the intervention or control group in this single study. | ||||
| 0 per 1000 | 0 per 1000 | Not estimable | 96 | |||
| OHSS | ‐ | No events of OHSS were observed in either the intervention or control group in this single study. | ||||
| 0 per 1000 | 0 per 1000 | Not estimable | 96 | |||
| *The risk in the intervention group (and its 95% confidence interval) is based on the assumed risk in the comparison group and the relative effect of the intervention (and its 95% CI). | ||||||
| GRADE Working Group grades of evidence | ||||||
| 1Evidence is based on data from a single small study ‐ downgraded one level. | ||||||
| Antioestrogen regimens | ||||||
| Patient or population: ovulation induction in polycystic ovarian syndrome Setting: Three studies took place in Egypt and one in Iran. One was conducted in a University Fertility Clinic, one in an Infertility Research Centre and one in a gynaecology outpatient department. The fourth research setting was not specified. | ||||||
| Outcomes | Anticipated absolute effects* (95% CI) | Relative effect | № of participants | Quality of the evidence | Comments | |
| Risk with clomiphene citrate regimen B | Risk with clomiphene citrate regimen A | |||||
| Live birth ‐ Clomiphene citrate 5 days versus clomiphene citrate 10 days | 155 per 1000 | 18 per 1000 | OR 0.10 | 220 | ⊕⊕⊝⊝ | |
| Clinical pregnancy ‐ Clomiphene citrate 5 days versus clomiphene citrate 10 days | 173 per 1000 | 36 per 1000 | OR 0.18 | 220 | ⊕⊕⊝⊝ | |
| Multiple pregnancy ‐ Clomiphene citrate 5 days versus clomiphene citrate 10 days | 27 per 1000 | 9 per 1000 | OR 0.33 | 220 | ⊕⊝⊝⊝ | |
| Miscarriage rate ‐ Early versus late clomiphene citrate | 29 per 1000 | 36 per 1000 | OR 1.25 | 212 | ⊕⊝⊝⊝ | |
| Clinical pregnancy ‐ Early versus late clomiphene citrate | 195 per 1000 | 405 per 1000 | OR 2.81 | 78 | ⊕⊕⊝⊝ | |
| *The risk in the intervention group (and its 95% confidence interval) is based on the assumed risk in the comparison group and the relative effect of the intervention (and its 95% CI). | ||||||
| GRADE Working Group grades of evidence | ||||||
| 1Evidence is based on a single study ‐ downgraded one level for serious imprecision. | ||||||
| Outcome or subgroup title | No. of studies | No. of participants | Statistical method | Effect size |
| 1 Clinical pregnancy rate (per woman randomised) Show forest plot | 3 | 133 | Odds Ratio (M‐H, Fixed, 95% CI) | 5.91 [1.77, 19.68] |
| Outcome or subgroup title | No. of studies | No. of participants | Statistical method | Effect size |
| 1 Live birth rate (per woman) Show forest plot | 2 | 195 | Odds Ratio (M‐H, Fixed, 95% CI) | 1.24 [0.59, 2.62] |
| 1.1 Clomiphene citrate versus tamoxifen | 2 | 195 | Odds Ratio (M‐H, Fixed, 95% CI) | 1.24 [0.59, 2.62] |
| 2 Miscarriage rate (per woman) Show forest plot | 4 | 653 | Odds Ratio (M‐H, Fixed, 95% CI) | 1.81 [0.80, 4.12] |
| 2.1 Clomiphene citrate versus tamoxifen | 4 | 653 | Odds Ratio (M‐H, Fixed, 95% CI) | 1.81 [0.80, 4.12] |
| 3 Clinical pregnancy rate (per woman) Show forest plot | 6 | Odds Ratio (M‐H, Fixed, 95% CI) | Subtotals only | |
| 3.1 Clomiphene citrate versus tamoxifen | 5 | 757 | Odds Ratio (M‐H, Fixed, 95% CI) | 1.30 [0.92, 1.85] |
| 3.2 Clomiphene citrate plus tamoxifen versus clomiphene citrate | 1 | 20 | Odds Ratio (M‐H, Fixed, 95% CI) | 3.32 [0.12, 91.60] |
| 4 Multiple pregnancy Show forest plot | 3 | 567 | Odds Ratio (M‐H, Fixed, 95% CI) | 2.34 [0.34, 16.04] |
| 5 OHSS Show forest plot | 3 | 567 | Odds Ratio (M‐H, Fixed, 95% CI) | 0.0 [0.0, 0.0] |
| Outcome or subgroup title | No. of studies | No. of participants | Statistical method | Effect size |
| 1 Live birth/ongoing pregnancy Show forest plot | 2 | 378 | Odds Ratio (M‐H, Fixed, 95% CI) | 0.64 [0.41, 0.98] |
| 2 Miscarriage rate (per woman) Show forest plot | 3 | 696 | Odds Ratio (M‐H, Fixed, 95% CI) | 0.84 [0.39, 1.78] |
| 3 Clinical pregnancy rate (per woman) Show forest plot | 2 | 378 | Odds Ratio (M‐H, Fixed, 95% CI) | 0.61 [0.40, 0.93] |
| 4 Multiple pregnancy Show forest plot | 3 | 696 | Odds Ratio (M‐H, Fixed, 95% CI) | 0.26 [0.06, 1.06] |
| 5 OHSS Show forest plot | 2 | 394 | Odds Ratio (M‐H, Fixed, 95% CI) | 0.19 [0.02, 1.67] |
| Outcome or subgroup title | No. of studies | No. of participants | Statistical method | Effect size |
| 1 Clomiphene citrate plus ketoconazole versus clomiphene citrate Show forest plot | 1 | Odds Ratio (M‐H, Fixed, 95% CI) | Subtotals only | |
| 1.1 Clinical pregnancy rate (per woman) | 1 | 80 | Odds Ratio (M‐H, Fixed, 95% CI) | 2.37 [0.88, 6.40] |
| 1.2 Multiple pregnancy (per woman) | 1 | 80 | Odds Ratio (M‐H, Fixed, 95% CI) | 1.18 [0.37, 3.78] |
| 1.3 Miscarriage rate | 1 | 80 | Odds Ratio (M‐H, Fixed, 95% CI) | 0.28 [0.01, 7.08] |
| 2 Clomiphene citrate plus bromocriptine versus clomiphene citrate Show forest plot | 2 | Odds Ratio (M‐H, Fixed, 95% CI) | Subtotals only | |
| 2.1 Clinical pregnancy rate (per woman) | 2 | 174 | Odds Ratio (M‐H, Fixed, 95% CI) | 1.03 [0.48, 2.21] |
| 3 Clomiphene citrate plus dexamethasone versus clomiphene citrate Show forest plot | 4 | Odds Ratio (M‐H, Random, 95% CI) | Subtotals only | |
| 3.1 Clinical pregnancy rate (per woman) | 4 | 434 | Odds Ratio (M‐H, Random, 95% CI) | 6.20 [2.20, 17.48] |
| 3.2 Multiple pregnancy (per woman) | 2 | 144 | Odds Ratio (M‐H, Random, 95% CI) | 7.71 [0.38, 155.64] |
| 4 Clomiphene citrate plus combined oral contraceptive versus clomiphene citrate Show forest plot | 1 | Odds Ratio (M‐H, Fixed, 95% CI) | Subtotals only | |
| 4.1 Miscarriage rate (per woman) | 1 | 48 | Odds Ratio (M‐H, Fixed, 95% CI) | 1.0 [0.06, 16.97] |
| 4.2 Clinical pregnancy rate (per woman) | 1 | 48 | Odds Ratio (M‐H, Fixed, 95% CI) | 27.18 [3.14, 235.02] |
| 4.3 Multiple pregnancy (per woman) | 1 | 48 | Odds Ratio (M‐H, Fixed, 95% CI) | 7.98 [0.39, 163.33] |
| 5 Clomiphene citrate plus hCG versus clomiphene citrate alone Show forest plot | 2 | Odds Ratio (M‐H, Fixed, 95% CI) | Subtotals only | |
| 5.1 Ongoing pregnancy rate (per woman) | 1 | 125 | Odds Ratio (M‐H, Fixed, 95% CI) | 1.31 [0.61, 2.80] |
| 5.2 Miscarriage | 2 | 192 | Odds Ratio (M‐H, Fixed, 95% CI) | 0.70 [0.19, 2.62] |
| 5.3 Clinical pregnancy rate (per woman) | 2 | 192 | Odds Ratio (M‐H, Fixed, 95% CI) | 1.18 [0.59, 2.36] |
| 5.4 Multiple pregnancies (per woman) | 1 | 125 | Odds Ratio (M‐H, Fixed, 95% CI) | 2.21 [0.19, 24.98] |
| 6 Clomiphene citrate plus hormone supplementation versus clomiphene citrate alone Show forest plot | 2 | Odds Ratio (M‐H, Fixed, 95% CI) | Subtotals only | |
| 6.1 Miscarriage | 1 | 96 | Odds Ratio (M‐H, Fixed, 95% CI) | 1.0 [0.06, 16.46] |
| 6.2 Clinical pregnancy rate (per woman) | 2 | 161 | Odds Ratio (M‐H, Fixed, 95% CI) | 0.81 [0.37, 1.76] |
| 6.3 Multiple pregnancy | 1 | 96 | Odds Ratio (M‐H, Fixed, 95% CI) | 0.0 [0.0, 0.0] |
| 6.4 OHSS | 1 | 96 | Odds Ratio (M‐H, Fixed, 95% CI) | 0.0 [0.0, 0.0] |
| 6.5 Adverse events | 1 | 65 | Odds Ratio (M‐H, Fixed, 95% CI) | 0.21 [0.01, 4.47] |
| Outcome or subgroup title | No. of studies | No. of participants | Statistical method | Effect size |
| 1 Live birth Show forest plot | 1 | 220 | Odds Ratio (M‐H, Fixed, 95% CI) | 0.10 [0.02, 0.45] |
| 1.1 Clomiphene citrate 5 days versus clomiphene citrate 10 days | 1 | 220 | Odds Ratio (M‐H, Fixed, 95% CI) | 0.10 [0.02, 0.45] |
| 2 Miscarriage rate Show forest plot | 1 | 212 | Odds Ratio (M‐H, Fixed, 95% CI) | 1.25 [0.27, 5.70] |
| 2.1 Early versus late clomiphene citrate | 1 | 212 | Odds Ratio (M‐H, Fixed, 95% CI) | 1.25 [0.27, 5.70] |
| 3 Clinical pregnancy Show forest plot | 2 | 298 | Odds Ratio (M‐H, Fixed, 95% CI) | 0.70 [0.37, 1.33] |
| 3.1 Clomiphene 5 days v clomiphene 10 days | 1 | 220 | Odds Ratio (M‐H, Fixed, 95% CI) | 0.18 [0.06, 0.55] |
| 3.2 Early v late clomiphene citrate | 1 | 78 | Odds Ratio (M‐H, Fixed, 95% CI) | 2.81 [1.02, 7.75] |
| 4 Multiple pregnancy Show forest plot | 1 | 220 | Odds Ratio (M‐H, Fixed, 95% CI) | 0.33 [0.03, 3.20] |
| 4.1 Clomiphene 5 days v clomiphene 10 days | 1 | 220 | Odds Ratio (M‐H, Fixed, 95% CI) | 0.33 [0.03, 3.20] |