| 1 Clomiphene plus ketoconazole versus clomiphene Show forest plot | 1 | | Odds Ratio (M‐H, Fixed, 95% CI) | Subtotals only |
|
| 1.1 Pregnancy rate (per woman) | 1 | 80 | Odds Ratio (M‐H, Fixed, 95% CI) | 2.37 [0.88, 6.40] |
| 1.2 Multiple pregnancy (per woman) | 1 | 80 | Odds Ratio (M‐H, Fixed, 95% CI) | 1.18 [0.37, 3.78] |
| 1.3 Spontaneous abortion (after cord pulse) | 1 | 80 | Odds Ratio (M‐H, Fixed, 95% CI) | 0.28 [0.01, 7.08] |
| 2 Clomiphene plus bromocriptine versus clomiphene Show forest plot | 1 | | Odds Ratio (M‐H, Fixed, 95% CI) | Subtotals only |
|
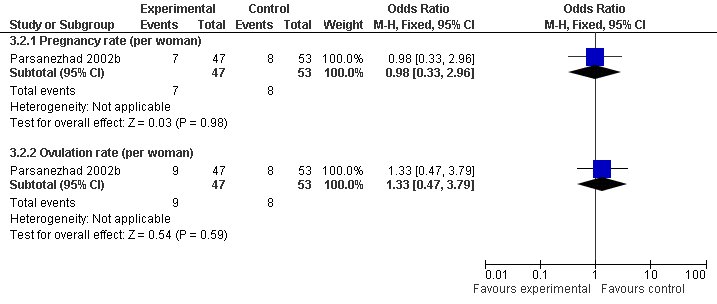
| 2.1 Pregnancy rate (per woman) | 1 | 100 | Odds Ratio (M‐H, Fixed, 95% CI) | 0.98 [0.33, 2.96] |
| 2.2 Ovulation rate (per woman) | 1 | 100 | Odds Ratio (M‐H, Fixed, 95% CI) | 1.33 [0.47, 3.79] |
| 3 Clomiphene plus dexamethasone versus clomiphene Show forest plot | 3 | | Odds Ratio (M‐H, Fixed, 95% CI) | Subtotals only |
|
| 3.1 Pregnancy rate (per woman) | 3 | 374 | Odds Ratio (M‐H, Fixed, 95% CI) | 9.46 [5.05, 17.70] |
| 3.2 Ovulation rate (per woman) | 3 | 374 | Odds Ratio (M‐H, Fixed, 95% CI) | 14.65 [8.76, 24.49] |
| 3.3 Multiple pregnancy (per woman) | 2 | 144 | Odds Ratio (M‐H, Fixed, 95% CI) | 7.71 [0.38, 155.64] |
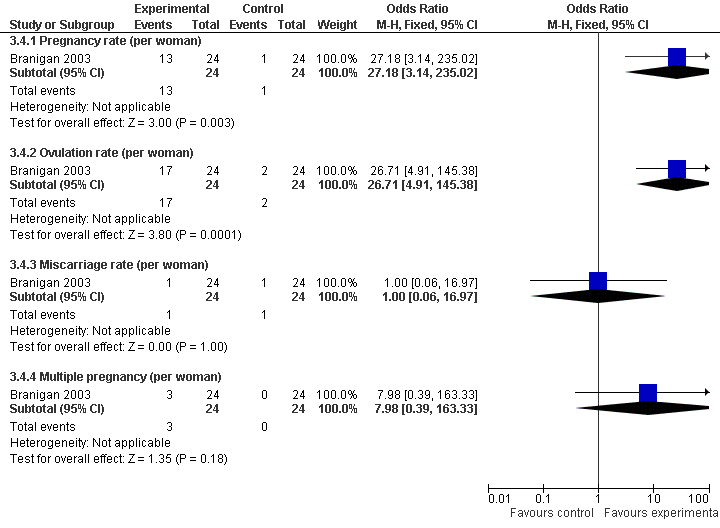
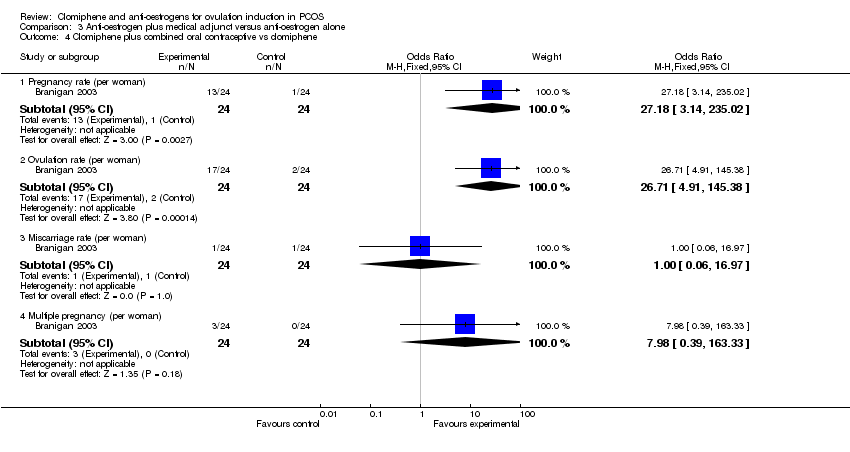
| 4 Clomiphene plus combined oral contraceptive vs clomiphene Show forest plot | 1 | | Odds Ratio (M‐H, Fixed, 95% CI) | Subtotals only |
|
| 4.1 Pregnancy rate (per woman) | 1 | 48 | Odds Ratio (M‐H, Fixed, 95% CI) | 27.18 [3.14, 235.02] |
| 4.2 Ovulation rate (per woman) | 1 | 48 | Odds Ratio (M‐H, Fixed, 95% CI) | 26.71 [4.91, 145.38] |
| 4.3 Miscarriage rate (per woman) | 1 | 48 | Odds Ratio (M‐H, Fixed, 95% CI) | 1.0 [0.06, 16.97] |
| 4.4 Multiple pregnancy (per woman) | 1 | 48 | Odds Ratio (M‐H, Fixed, 95% CI) | 7.98 [0.39, 163.33] |
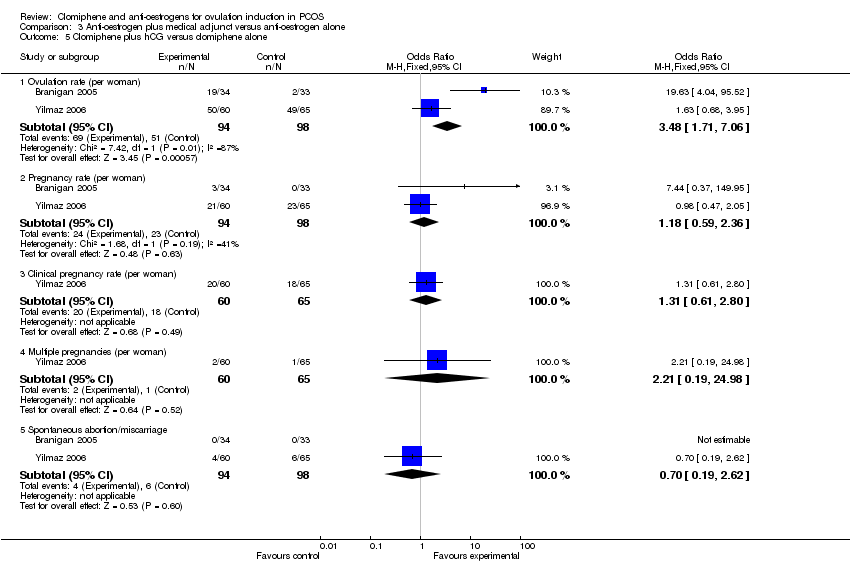
| 5 Clomiphene plus hCG versus clomiphene alone Show forest plot | 2 | | Odds Ratio (M‐H, Fixed, 95% CI) | Subtotals only |
|
| 5.1 Ovulation rate (per woman) | 2 | 192 | Odds Ratio (M‐H, Fixed, 95% CI) | 3.48 [1.71, 7.06] |
| 5.2 Pregnancy rate (per woman) | 2 | 192 | Odds Ratio (M‐H, Fixed, 95% CI) | 1.18 [0.59, 2.36] |
| 5.3 Clinical pregnancy rate (per woman) | 1 | 125 | Odds Ratio (M‐H, Fixed, 95% CI) | 1.31 [0.61, 2.80] |
| 5.4 Multiple pregnancies (per woman) | 1 | 125 | Odds Ratio (M‐H, Fixed, 95% CI) | 2.21 [0.19, 24.98] |
| 5.5 Spontaneous abortion/miscarriage | 2 | 192 | Odds Ratio (M‐H, Fixed, 95% CI) | 0.70 [0.19, 2.62] |
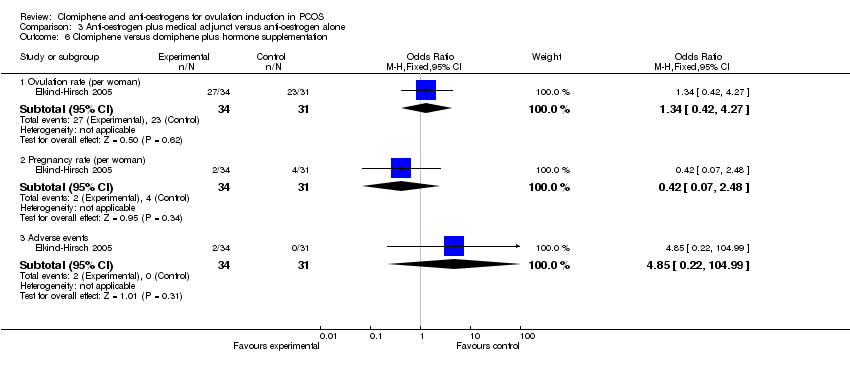
| 6 Clomiphene versus clomiphene plus hormone supplementation Show forest plot | 1 | | Odds Ratio (M‐H, Fixed, 95% CI) | Subtotals only |
|
| 6.1 Ovulation rate (per woman) | 1 | 65 | Odds Ratio (M‐H, Fixed, 95% CI) | 1.34 [0.42, 4.27] |
| 6.2 Pregnancy rate (per woman) | 1 | 65 | Odds Ratio (M‐H, Fixed, 95% CI) | 0.42 [0.07, 2.48] |
| 6.3 Adverse events | 1 | 65 | Odds Ratio (M‐H, Fixed, 95% CI) | 4.85 [0.22, 104.99] |