| 1 Inpatient mortality Show forest plot | 7 | 953 | Odds Ratio (M‐H, Random, 95% CI) | 1.10 [0.56, 2.16] |
|
| 1.1 Stronger studies | 4 | 607 | Odds Ratio (M‐H, Random, 95% CI) | 1.52 [0.86, 2.68] |
| 1.2 Weaker studies | 3 | 346 | Odds Ratio (M‐H, Random, 95% CI) | 0.68 [0.13, 3.46] |
| 2 Early post discharge death (4‐6 weeks) Show forest plot | 4 | 892 | Odds Ratio (M‐H, Random, 95% CI) | 0.63 [0.25, 1.62] |
|
| 2.1 Stronger studies | 1 | 153 | Odds Ratio (M‐H, Random, 95% CI) | 0.44 [0.08, 2.49] |
| 2.2 Weaker studies | 3 | 739 | Odds Ratio (M‐H, Random, 95% CI) | 0.74 [0.24, 2.24] |
| 3 Mortality within 3 months of admission (12 weeks / 90 days) Show forest plot | 3 | 885 | Odds Ratio (M‐H, Random, 95% CI) | 1.60 [0.93, 2.75] |
|
| 3.1 Stronger studies | 2 | 352 | Odds Ratio (M‐H, Random, 95% CI) | 1.52 [0.82, 2.82] |
| 3.2 Weaker studies | 1 | 533 | Odds Ratio (M‐H, Random, 95% CI) | 1.88 [0.61, 5.80] |
| 4 Mortality within 6 months of admission (24 weeks / 180 days) Show forest plot | 3 | 946 | Odds Ratio (M‐H, Random, 95% CI) | 0.96 [0.63, 1.47] |
|
| 4.1 Stronger studies | 2 | 413 | Odds Ratio (M‐H, Random, 95% CI) | 0.95 [0.58, 1.56] |
| 4.2 Weaker studies | 1 | 533 | Odds Ratio (M‐H, Random, 95% CI) | 1.00 [0.46, 2.20] |
| 5 Mortality to longest follow up (within 6 months) Show forest plot | 6 | 1350 | Odds Ratio (M‐H, Random, 95% CI) | 0.92 [0.65, 1.29] |
|
| 5.1 Stronger studies | 3 | 590 | Odds Ratio (M‐H, Random, 95% CI) | 1.08 [0.71, 1.65] |
| 5.2 Weaker studies | 3 | 760 | Odds Ratio (M‐H, Random, 95% CI) | 0.70 [0.37, 1.34] |
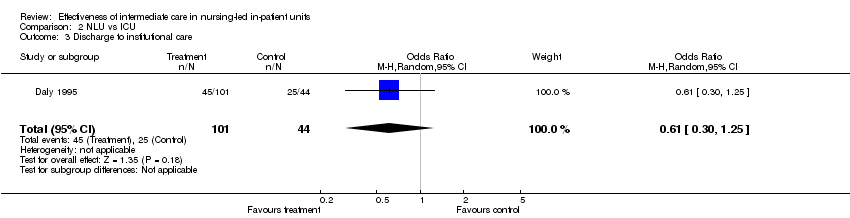
| 6 Discharge to institutional care Show forest plot | 7 | 952 | Odds Ratio (M‐H, Random, 95% CI) | 0.44 [0.22, 0.89] |
|
| 6.1 stronger studies | 4 | 529 | Odds Ratio (M‐H, Random, 95% CI) | 0.83 [0.41, 1.67] |
| 6.2 Weaker studies | 3 | 423 | Odds Ratio (M‐H, Random, 95% CI) | 0.24 [0.12, 0.49] |
| 7 Independent at discharge Show forest plot | 6 | 861 | Odds Ratio (M‐H, Fixed, 95% CI) | 0.71 [0.53, 0.95] |
|
| 7.1 stronger studies | 4 | 586 | Odds Ratio (M‐H, Fixed, 95% CI) | 1.04 [0.72, 1.50] |
| 7.2 Weaker studies | 2 | 275 | Odds Ratio (M‐H, Fixed, 95% CI) | 0.36 [0.22, 0.59] |
| 8 Institutional care to longest follow up Show forest plot | 3 | 411 | Odds Ratio (M‐H, Random, 95% CI) | 0.97 [0.60, 1.58] |
|
| 8.1 Stronger studies | 3 | 411 | Odds Ratio (M‐H, Random, 95% CI) | 0.97 [0.60, 1.58] |
| 9 Functional Status at discharge Show forest plot | 6 | 762 | Std. Mean Difference (IV, Random, 95% CI) | 0.37 [0.20, 0.54] |
|
| 9.1 Stronger studies | 4 | 540 | Std. Mean Difference (IV, Random, 95% CI) | 0.27 [0.10, 0.44] |
| 9.2 Weaker studies | 2 | 222 | Std. Mean Difference (IV, Random, 95% CI) | 0.61 [0.34, 0.88] |
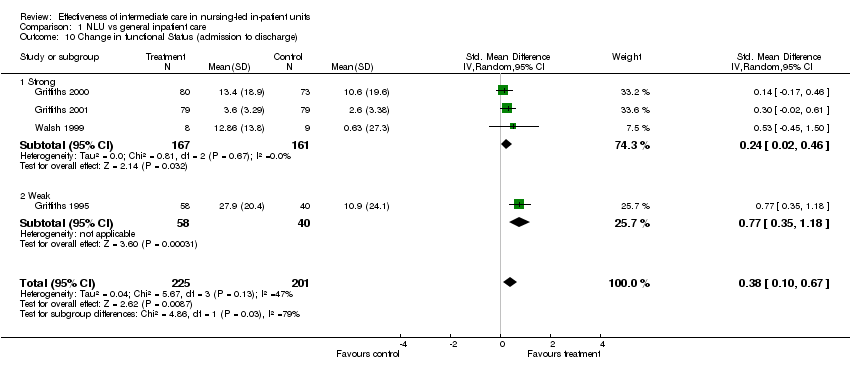
| 10 Change in functional Status (admission to discharge) Show forest plot | 4 | 426 | Std. Mean Difference (IV, Random, 95% CI) | 0.38 [0.10, 0.67] |
|
| 10.1 Strong | 3 | 328 | Std. Mean Difference (IV, Random, 95% CI) | 0.24 [0.02, 0.46] |
| 10.2 Weak | 1 | 98 | Std. Mean Difference (IV, Random, 95% CI) | 0.77 [0.35, 1.18] |
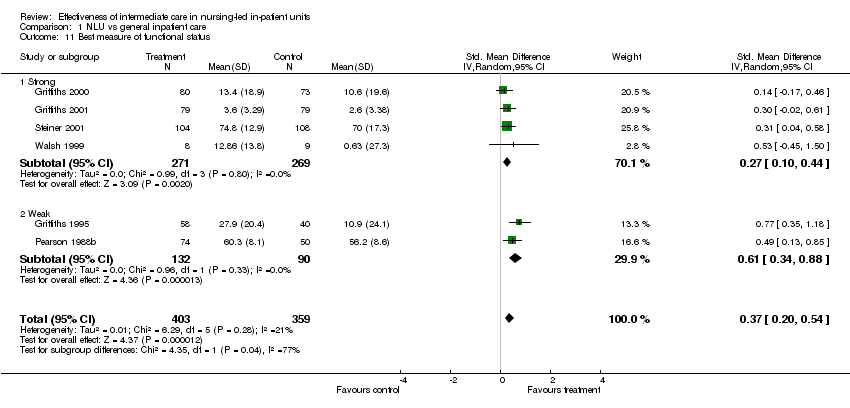
| 11 Best measure of functional status Show forest plot | 6 | 762 | Std. Mean Difference (IV, Random, 95% CI) | 0.37 [0.20, 0.54] |
|
| 11.1 Strong | 4 | 540 | Std. Mean Difference (IV, Random, 95% CI) | 0.27 [0.10, 0.44] |
| 11.2 Weak | 2 | 222 | Std. Mean Difference (IV, Random, 95% CI) | 0.61 [0.34, 0.88] |
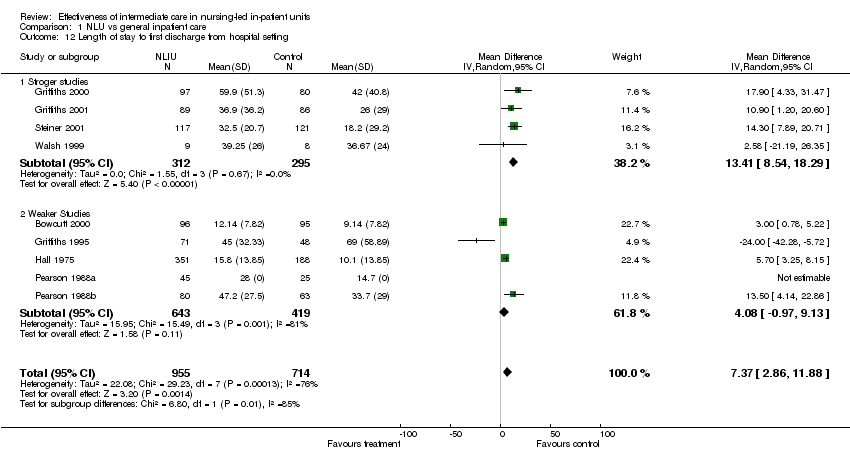
| 12 Length of stay to first discharge from hospital setting Show forest plot | 9 | 1669 | Mean Difference (IV, Random, 95% CI) | 7.37 [2.86, 11.88] |
|
| 12.1 Stroger studies | 4 | 607 | Mean Difference (IV, Random, 95% CI) | 13.41 [8.54, 18.29] |
| 12.2 Weaker Studies | 5 | 1062 | Mean Difference (IV, Random, 95% CI) | 4.08 [‐0.97, 9.13] |
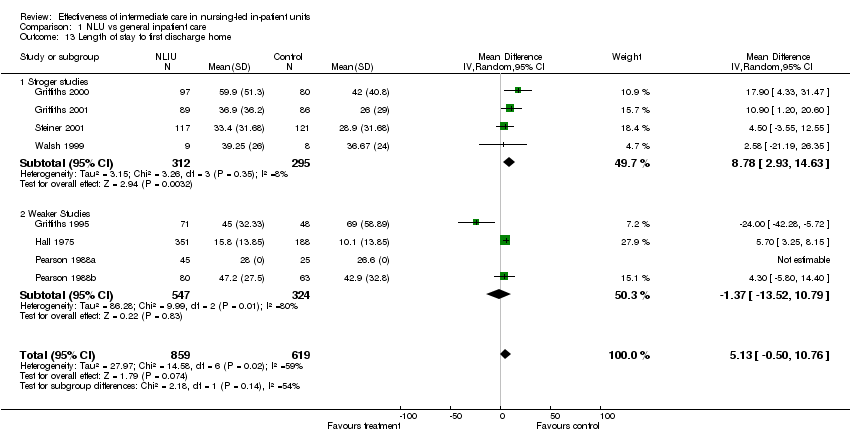
| 13 Length of stay to first discharge home Show forest plot | 8 | 1478 | Mean Difference (IV, Random, 95% CI) | 5.13 [‐0.50, 10.76] |
|
| 13.1 Stroger studies | 4 | 607 | Mean Difference (IV, Random, 95% CI) | 8.78 [2.93, 14.63] |
| 13.2 Weaker Studies | 4 | 871 | Mean Difference (IV, Random, 95% CI) | ‐1.37 [‐13.52, 10.79] |
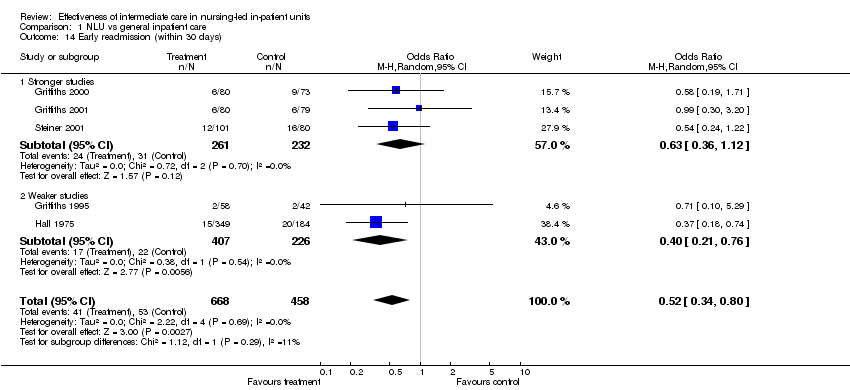
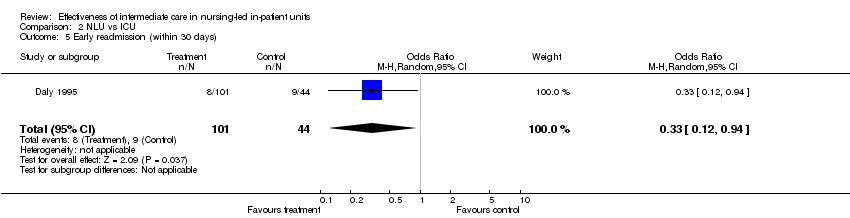
| 14 Early readmission (within 30 days) Show forest plot | 5 | 1126 | Odds Ratio (M‐H, Random, 95% CI) | 0.52 [0.34, 0.80] |
|
| 14.1 Stronger studies | 3 | 493 | Odds Ratio (M‐H, Random, 95% CI) | 0.63 [0.36, 1.12] |
| 14.2 Weaker studies | 2 | 633 | Odds Ratio (M‐H, Random, 95% CI) | 0.40 [0.21, 0.76] |
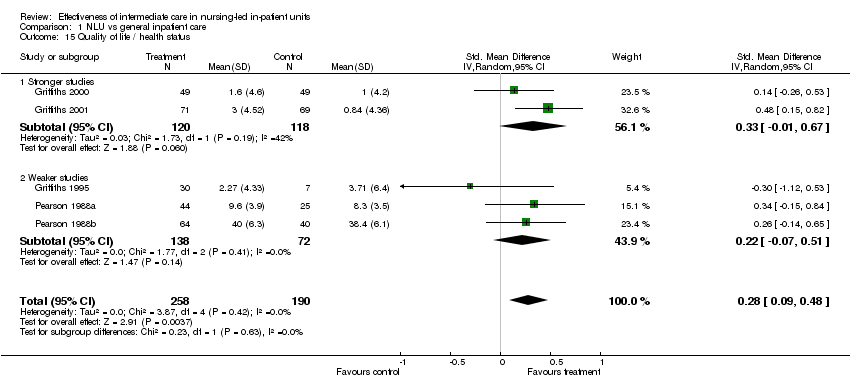
| 15 Quality of life / health status Show forest plot | 5 | 448 | Std. Mean Difference (IV, Random, 95% CI) | 0.28 [0.09, 0.48] |
|
| 15.1 Stronger studies | 2 | 238 | Std. Mean Difference (IV, Random, 95% CI) | 0.33 [‐0.01, 0.67] |
| 15.2 Weaker studies | 3 | 210 | Std. Mean Difference (IV, Random, 95% CI) | 0.22 [‐0.07, 0.51] |
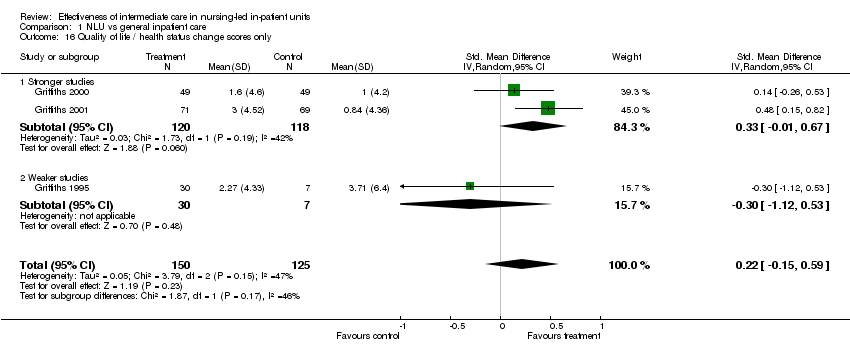
| 16 Quality of life / health status change scores only Show forest plot | 3 | 275 | Std. Mean Difference (IV, Random, 95% CI) | 0.22 [‐0.15, 0.59] |
|
| 16.1 Stronger studies | 2 | 238 | Std. Mean Difference (IV, Random, 95% CI) | 0.33 [‐0.01, 0.67] |
| 16.2 Weaker studies | 1 | 37 | Std. Mean Difference (IV, Random, 95% CI) | ‐0.30 [‐1.12, 0.53] |
| 17 Psychological wellbeing Show forest plot | 3 | 280 | Std. Mean Difference (IV, Random, 95% CI) | 0.36 [‐0.03, 0.74] |
|
| 17.1 Stronger studies | 2 | 244 | Std. Mean Difference (IV, Random, 95% CI) | 0.25 [‐0.03, 0.52] |
| 17.2 Weaker studies | 1 | 36 | Std. Mean Difference (IV, Random, 95% CI) | 1.04 [0.17, 1.90] |
| 18 Satisfaction Show forest plot | 4 | 335 | Std. Mean Difference (IV, Random, 95% CI) | 0.22 [‐0.03, 0.46] |
|
| 18.1 Stronger studies | 2 | 175 | Std. Mean Difference (IV, Random, 95% CI) | 0.19 [‐0.11, 0.48] |
| 18.2 Weaker Studies | 2 | 160 | Std. Mean Difference (IV, Random, 95% CI) | 0.29 [‐0.15, 0.72] |