| 1 Pain crises Show forest plot | 2 | | Mean Difference (IV, Fixed, 95% CI) | Totals not selected |
|
| 1.1 Mean annual crisis rate at 2 years (all crises) | 1 | | Mean Difference (IV, Fixed, 95% CI) | ‐2.80 [‐4.74, ‐0.86] |
| 1.2 Mean annual crisis rate at 2 years (all crises requiring hospitalisation) | 1 | | Mean Difference (IV, Fixed, 95% CI) | ‐1.50 [‐2.58, ‐0.42] |
| 1.3 Number of vaso‐occlusive crises after 18 months of treatment | 1 | | Mean Difference (IV, Fixed, 95% CI) | ‐9.6 [‐10.86, ‐8.34] |
| 2 Proportion experiencing pain Show forest plot | 1 | | Risk Ratio (M‐H, Fixed, 95% CI) | Totals not selected |
|
| 3 Proportion experiencing life threatening events during study Show forest plot | 2 | | Risk Ratio (M‐H, Fixed, 95% CI) | Subtotals only |
|
| 3.1 Acute chest syndrome | 2 | 492 | Risk Ratio (M‐H, Fixed, 95% CI) | 0.43 [0.29, 0.63] |
| 3.2 Hepatic sequestration | 1 | 299 | Risk Ratio (M‐H, Fixed, 95% CI) | 0.32 [0.03, 3.06] |
| 3.3 Stroke | 2 | 492 | Risk Ratio (M‐H, Fixed, 95% CI) | 0.54 [0.12, 2.53] |
| 3.4 Patients transfused | 2 | 492 | Risk Ratio (M‐H, Fixed, 95% CI) | 0.66 [0.52, 0.82] |
| 3.5 Splenic sequestration | 1 | 193 | Risk Ratio (M‐H, Fixed, 95% CI) | 0.90 [0.36, 2.23] |
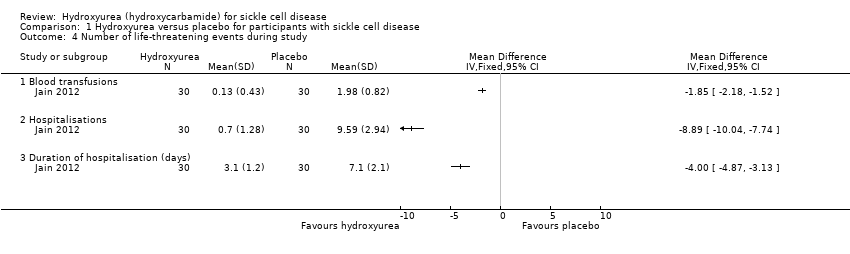
| 4 Number of life‐threatening events during study Show forest plot | 1 | | Mean Difference (IV, Fixed, 95% CI) | Totals not selected |
|
| 4.1 Blood transfusions | 1 | | Mean Difference (IV, Fixed, 95% CI) | ‐1.85 [‐2.18, ‐1.52] |
| 4.2 Hospitalisations | 1 | | Mean Difference (IV, Fixed, 95% CI) | ‐8.89 [‐10.04, ‐7.74] |
| 4.3 Duration of hospitalisation (days) | 1 | | Mean Difference (IV, Fixed, 95% CI) | ‐2.00 [‐4.87, ‐3.13] |
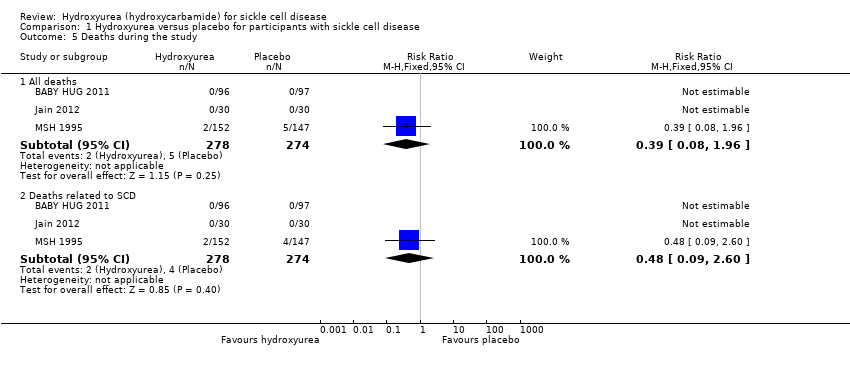
| 5 Deaths during the study Show forest plot | 3 | | Risk Ratio (M‐H, Fixed, 95% CI) | Subtotals only |
|
| 5.1 All deaths | 3 | 552 | Risk Ratio (M‐H, Fixed, 95% CI) | 0.39 [0.08, 1.96] |
| 5.2 Deaths related to SCD | 3 | 552 | Risk Ratio (M‐H, Fixed, 95% CI) | 0.48 [0.09, 2.60] |
| 6 Change from baseline in fetal haemoglobin (HbF %) Show forest plot | 1 | | Mean Difference (Fixed, 95% CI) | Totals not selected |
|
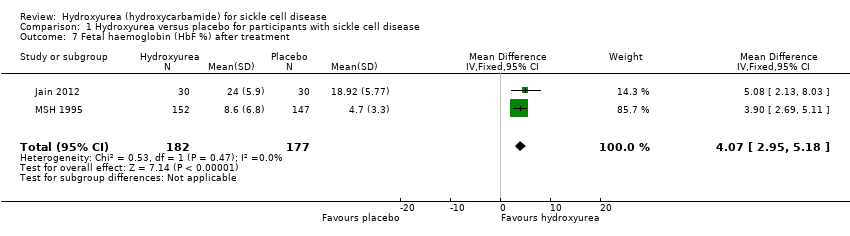
| 7 Fetal haemoglobin (HbF %) after treatment Show forest plot | 2 | 359 | Mean Difference (IV, Fixed, 95% CI) | 4.07 [2.95, 5.18] |
|
| 8 Change from baseline in absolute neutrophil count (x10³ per μL) Show forest plot | 1 | | Mean Difference (Fixed, 95% CI) | Totals not selected |
|
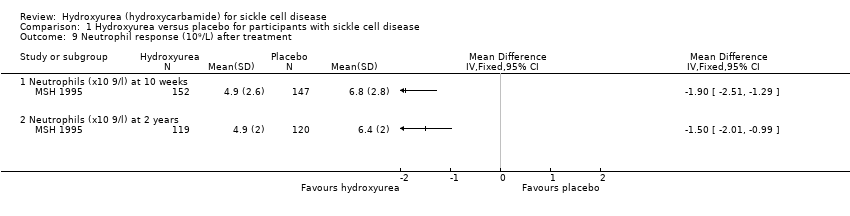
| 9 Neutrophil response (10⁹/L) after treatment Show forest plot | 1 | | Mean Difference (IV, Fixed, 95% CI) | Totals not selected |
|
| 9.1 Neutrophils (x10 9/l) at 10 weeks | 1 | | Mean Difference (IV, Fixed, 95% CI) | ‐1.90 [‐2.51, ‐1.29] |
| 9.2 Neutrophils (x10 9/l) at 2 years | 1 | | Mean Difference (IV, Fixed, 95% CI) | ‐1.50 [‐2.01, ‐0.99] |
| 10 Change from baseline in haemoglobin (g/L) Show forest plot | 1 | | Mean Difference (Fixed, 95% CI) | Totals not selected |
|
| 11 Change from baseline in m corpuscular volume (fL) Show forest plot | 1 | | Mean Difference (Fixed, 95% CI) | Totals not selected |
|
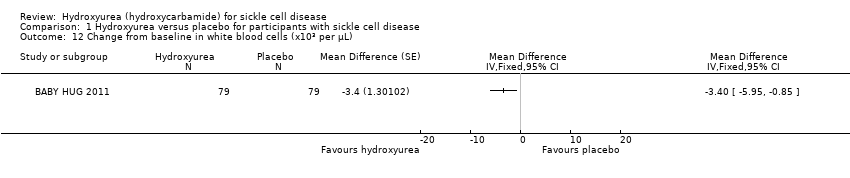
| 12 Change from baseline in white blood cells (x10³ per μL) Show forest plot | 1 | | Mean Difference (Fixed, 95% CI) | Totals not selected |
|
| 13 Change from baseline in absolute reticulocyte count (x10³ per μL) Show forest plot | 1 | | Mean Difference (Fixed, 95% CI) | Totals not selected |
|
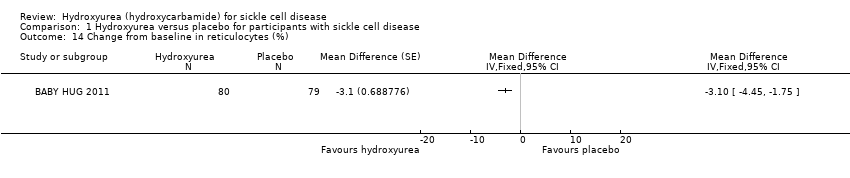
| 14 Change from baseline in reticulocytes (%) Show forest plot | 1 | | Mean Difference (Fixed, 95% CI) | Totals not selected |
|
| 15 Change from baseline in total bilirubin (mg/L) Show forest plot | 1 | | Mean Difference (Fixed, 95% CI) | Totals not selected |
|
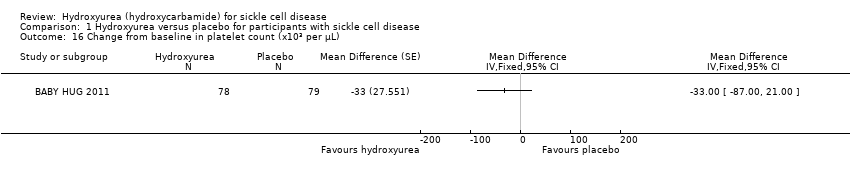
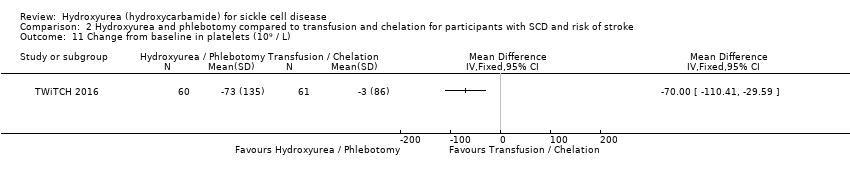
| 16 Change from baseline in platelet count (x10³ per μL) Show forest plot | 1 | | Mean Difference (Fixed, 95% CI) | Totals not selected |
|
| 17 Haemoglobin (g/dL) Show forest plot | 2 | | Mean Difference (IV, Fixed, 95% CI) | Subtotals only |
|
| 17.1 At 10 weeks | 1 | 299 | Mean Difference (IV, Fixed, 95% CI) | 0.5 [0.19, 0.81] |
| 17.2 At the end of the study | 2 | 359 | Mean Difference (IV, Fixed, 95% CI) | 1.04 [0.82, 1.25] |
| 18 Mean corpuscular volume (fL) Show forest plot | 1 | | Mean Difference (IV, Fixed, 95% CI) | Totals not selected |
|
| 18.1 At 10 weeks | 1 | | Mean Difference (IV, Fixed, 95% CI) | 12.30 [9.69, 14.91] |
| 18.2 At 2 years | 1 | | Mean Difference (IV, Fixed, 95% CI) | 10.0 [7.34, 12.66] |
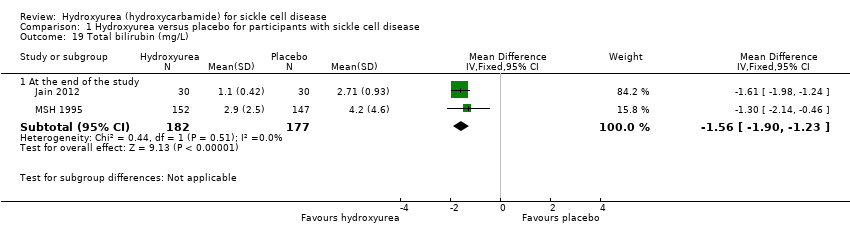
| 19 Total bilirubin (mg/L) Show forest plot | 2 | | Mean Difference (IV, Fixed, 95% CI) | Subtotals only |
|
| 19.1 At the end of the study | 2 | 359 | Mean Difference (IV, Fixed, 95% CI) | ‐1.56 [‐1.90, ‐1.23] |
| 20 Reticulocytes Show forest plot | 2 | | Mean Difference (IV, Fixed, 95% CI) | Totals not selected |
|
| 20.1 Reticulocytes (10⁵/mm³) at 18 months | 1 | | Mean Difference (IV, Fixed, 95% CI) | ‐0.66 [‐0.90, ‐0.42] |
| 20.2 Reticulocytes (10⁹/L) at 10 weeks | 1 | | Mean Difference (IV, Fixed, 95% CI) | ‐130.0 [‐152.17, ‐107.83] |
| 20.3 Reticulocytes (10⁹/L) at 2 years | 1 | | Mean Difference (IV, Fixed, 95% CI) | ‐69.0 [‐91.56, ‐46.44] |
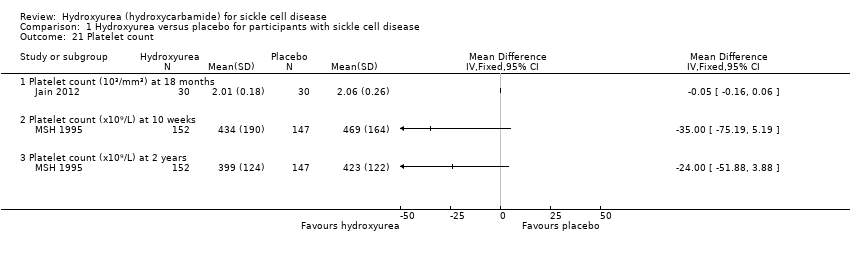
| 21 Platelet count Show forest plot | 2 | | Mean Difference (IV, Fixed, 95% CI) | Totals not selected |
|
| 21.1 Platelet count (10³/mm³) at 18 months | 1 | | Mean Difference (IV, Fixed, 95% CI) | ‐0.05 [‐0.16, 0.06] |
| 21.2 Platelet count (x10⁹/L) at 10 weeks | 1 | | Mean Difference (IV, Fixed, 95% CI) | ‐35.0 [‐75.19, 5.19] |
| 21.3 Platelet count (x10⁹/L) at 2 years | 1 | | Mean Difference (IV, Fixed, 95% CI) | ‐24.0 [‐51.88, 3.88] |
| 22 Packed cell volume Show forest plot | 1 | | Mean Difference (IV, Fixed, 95% CI) | Totals not selected |
|
| 22.1 Packed cell volume (%) at 2 years | 1 | | Mean Difference (IV, Fixed, 95% CI) | 1.90 [0.85, 2.95] |
| 23 F reticulocytes Show forest plot | 1 | | Mean Difference (IV, Fixed, 95% CI) | Totals not selected |
|
| 23.1 F reticulocytes at 2 years | 1 | | Mean Difference (IV, Fixed, 95% CI) | 2.0 [0.18, 3.82] |
| 24 F cells Show forest plot | 1 | | Mean Difference (IV, Fixed, 95% CI) | Totals not selected |
|
| 24.1 F cells (%) at 2 years | 1 | | Mean Difference (IV, Fixed, 95% CI) | 13.0 [8.33, 17.67] |
| 25 Red blood count Show forest plot | 1 | | Mean Difference (IV, Fixed, 95% CI) | Totals not selected |
|
| 25.1 Red blood count (10⁶/mm³) at 18 months | 1 | | Mean Difference (IV, Fixed, 95% CI) | ‐1.13 [‐1.24, ‐1.02] |
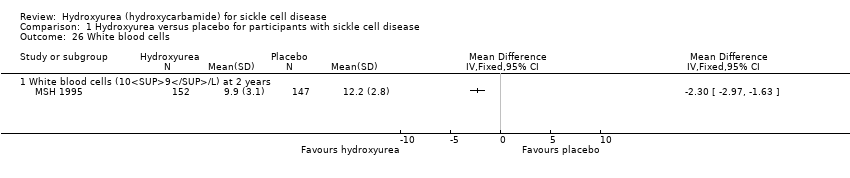
| 26 White blood cells Show forest plot | 1 | | Mean Difference (IV, Fixed, 95% CI) | Totals not selected |
|
| 26.1 White blood cells (109/L) at 2 years | 1 | | Mean Difference (IV, Fixed, 95% CI) | ‐2.30 [‐2.97, ‐1.63] |
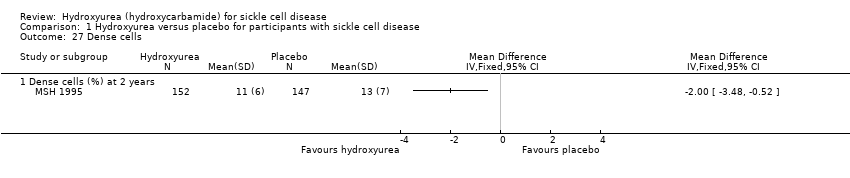
| 27 Dense cells Show forest plot | 1 | | Mean Difference (IV, Fixed, 95% CI) | Totals not selected |
|
| 27.1 Dense cells (%) at 2 years | 1 | | Mean Difference (IV, Fixed, 95% CI) | ‐2.0 [‐3.48, ‐0.52] |
| 28 Leucocytes Show forest plot | 1 | | Mean Difference (IV, Fixed, 95% CI) | Totals not selected |
|
| 28.1 Leucocytes (10³/mm³) at 18 months | 1 | | Mean Difference (IV, Fixed, 95% CI) | ‐0.84 [‐3.07, 1.39] |
| 29 Creatinine Show forest plot | 1 | | Mean Difference (IV, Fixed, 95% CI) | Totals not selected |
|
| 29.1 Creatinine (mg/dL) at 2 years | 1 | | Mean Difference (IV, Fixed, 95% CI) | 0.0 [‐0.11, 0.11] |
| 30 Aspartate aminotransferase Show forest plot | 1 | | Mean Difference (IV, Fixed, 95% CI) | Totals not selected |
|
| 30.1 Aspartate aminotransferase at 2 years | 1 | | Mean Difference (IV, Fixed, 95% CI) | ‐4.0 [‐9.40, 1.40] |
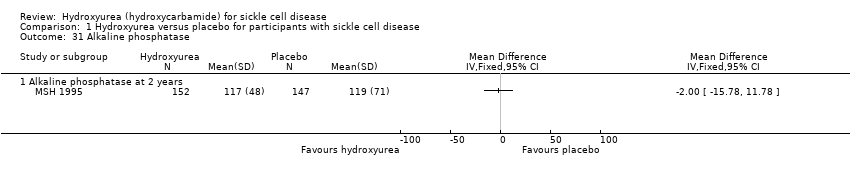
| 31 Alkaline phosphatase Show forest plot | 1 | | Mean Difference (IV, Fixed, 95% CI) | Totals not selected |
|
| 31.1 Alkaline phosphatase at 2 years | 1 | | Mean Difference (IV, Fixed, 95% CI) | ‐2.0 [‐15.78, 11.78] |
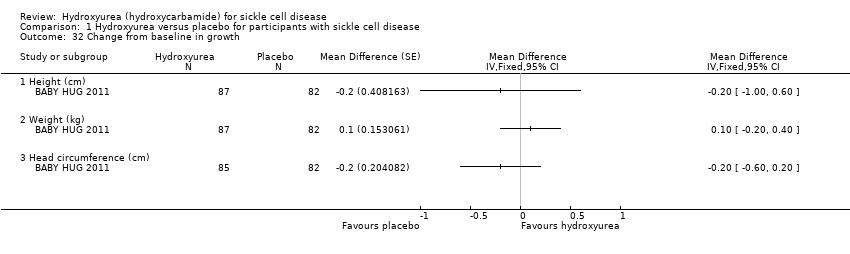
| 32 Change from baseline in growth Show forest plot | 1 | | Mean Difference (Fixed, 95% CI) | Totals not selected |
|
| 32.1 Height (cm) | 1 | | Mean Difference (Fixed, 95% CI) | ‐0.2 [1.00, 0.60] |
| 32.2 Weight (kg) | 1 | | Mean Difference (Fixed, 95% CI) | 0.10 [‐0.20, 0.40] |
| 32.3 Head circumference (cm) | 1 | | Mean Difference (Fixed, 95% CI) | ‐0.2 [‐0.60, 0.20] |
| 33 Quality of life: general health perception Show forest plot | 1 | | Mean Difference (IV, Fixed, 95% CI) | Totals not selected |
|
| 33.1 General health perception at 6 months | 1 | | Mean Difference (IV, Fixed, 95% CI) | 0.30 [‐0.54, 1.14] |
| 33.2 General health perception at 1 year | 1 | | Mean Difference (IV, Fixed, 95% CI) | 0.60 [‐0.18, 1.38] |
| 33.3 General health perception at 18 months | 1 | | Mean Difference (IV, Fixed, 95% CI) | 0.9 [0.08, 1.72] |
| 33.4 General health perception at 2 years | 1 | | Mean Difference (IV, Fixed, 95% CI) | 0.4 [‐0.51, 1.31] |
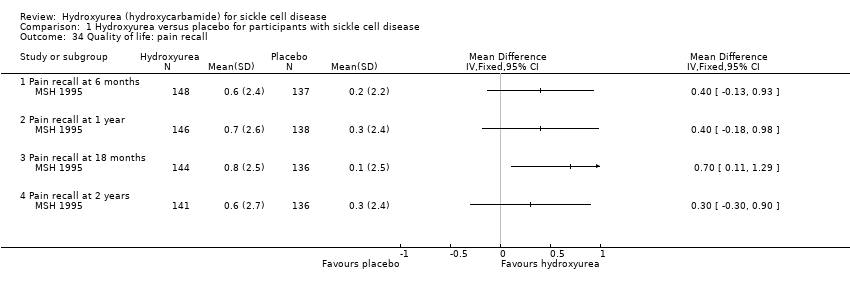
| 34 Quality of life: pain recall Show forest plot | 1 | | Mean Difference (IV, Fixed, 95% CI) | Totals not selected |
|
| 34.1 Pain recall at 6 months | 1 | | Mean Difference (IV, Fixed, 95% CI) | 0.40 [‐0.13, 0.93] |
| 34.2 Pain recall at 1 year | 1 | | Mean Difference (IV, Fixed, 95% CI) | 0.40 [‐0.18, 0.98] |
| 34.3 Pain recall at 18 months | 1 | | Mean Difference (IV, Fixed, 95% CI) | 0.70 [0.11, 1.29] |
| 34.4 Pain recall at 2 years | 1 | | Mean Difference (IV, Fixed, 95% CI) | 0.3 [‐0.30, 0.90] |
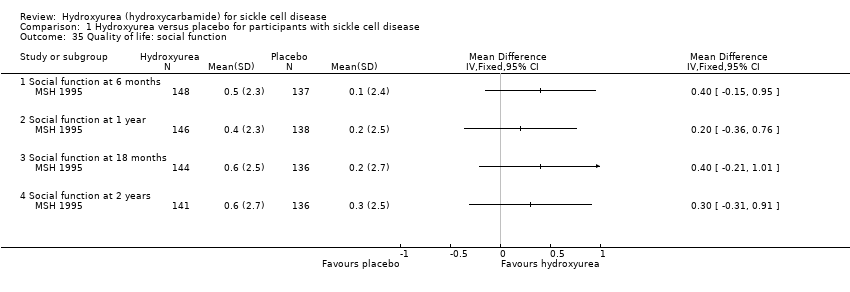
| 35 Quality of life: social function Show forest plot | 1 | | Mean Difference (IV, Fixed, 95% CI) | Totals not selected |
|
| 35.1 Social function at 6 months | 1 | | Mean Difference (IV, Fixed, 95% CI) | 0.4 [‐0.15, 0.95] |
| 35.2 Social function at 1 year | 1 | | Mean Difference (IV, Fixed, 95% CI) | 0.2 [‐0.36, 0.76] |
| 35.3 Social function at 18 months | 1 | | Mean Difference (IV, Fixed, 95% CI) | 0.40 [‐0.21, 1.01] |
| 35.4 Social function at 2 years | 1 | | Mean Difference (IV, Fixed, 95% CI) | 0.3 [‐0.31, 0.91] |
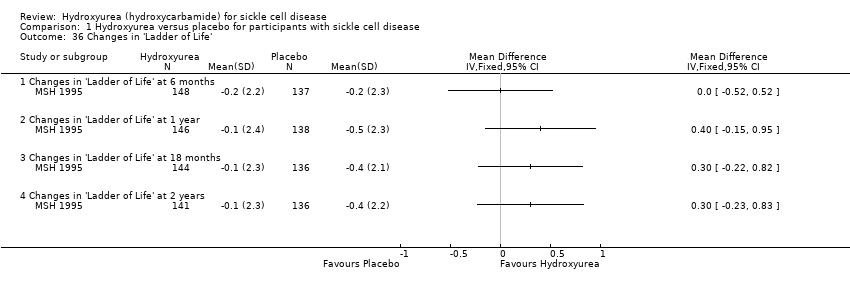
| 36 Changes in 'Ladder of Life' Show forest plot | 1 | | Mean Difference (IV, Fixed, 95% CI) | Totals not selected |
|
| 36.1 Changes in 'Ladder of Life' at 6 months | 1 | | Mean Difference (IV, Fixed, 95% CI) | 0.0 [‐0.52, 0.52] |
| 36.2 Changes in 'Ladder of Life' at 1 year | 1 | | Mean Difference (IV, Fixed, 95% CI) | 0.4 [‐0.15, 0.95] |
| 36.3 Changes in 'Ladder of Life' at 18 months | 1 | | Mean Difference (IV, Fixed, 95% CI) | 0.30 [‐0.22, 0.82] |
| 36.4 Changes in 'Ladder of Life' at 2 years | 1 | | Mean Difference (IV, Fixed, 95% CI) | 0.3 [‐0.23, 0.83] |
| 37 Proportion of participants with signs of organ damage Show forest plot | 2 | | Risk Ratio (M‐H, Fixed, 95% CI) | Totals not selected |
|
| 37.1 New leg ulcers | 1 | | Risk Ratio (M‐H, Fixed, 95% CI) | 0.85 [0.44, 1.64] |
| 37.2 Aseptic necrosis (humerus or femur) | 1 | | Risk Ratio (M‐H, Fixed, 95% CI) | 0.97 [0.39, 2.37] |
| 37.3 Decreased spleen function at exit (compared to baseline) | 1 | | Risk Ratio (M‐H, Fixed, 95% CI) | 0.72 [0.44, 1.16] |
| 38 Signs of organ damage ‐ change from baseline in DTPA GFR Show forest plot | 1 | | Mean Difference (Fixed, 95% CI) | Totals not selected |
|
| 39 Signs of organ damage ‐ change from baseline in Howell‐Jolley body (per 106 red blood cells) Show forest plot | 1 | | Mean Difference (Fixed, 95% CI) | Totals not selected |
|
| 40 Signs of organ damage ‐ change from baseline in pitted cells (%) Show forest plot | 1 | | Mean Difference (Fixed, 95% CI) | Totals not selected |
|
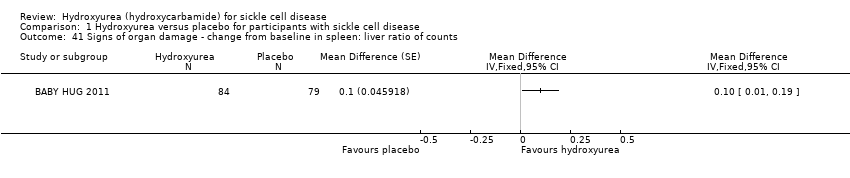
| 41 Signs of organ damage ‐ change from baseline in spleen: liver ratio of counts Show forest plot | 1 | | Mean Difference (Fixed, 95% CI) | Totals not selected |
|
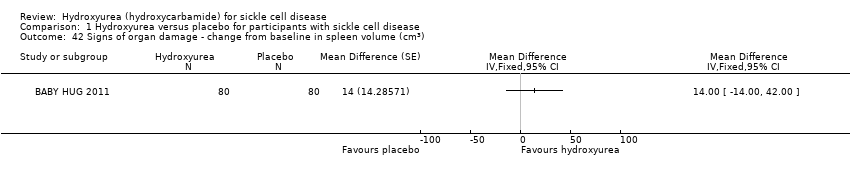
| 42 Signs of organ damage ‐ change from baseline in spleen volume (cm3) Show forest plot | 1 | | Mean Difference (Fixed, 95% CI) | Totals not selected |
|
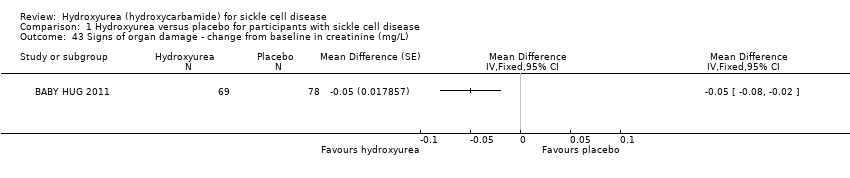
| 43 Signs of organ damage ‐ change from baseline in creatinine (mg/L) Show forest plot | 1 | | Mean Difference (Fixed, 95% CI) | Totals not selected |
|
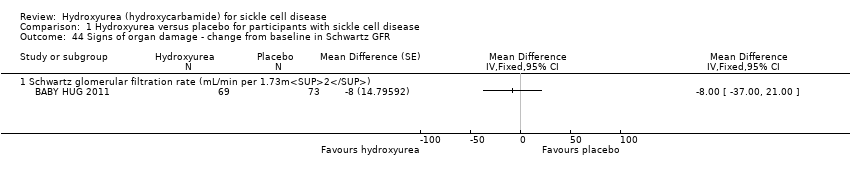
| 44 Signs of organ damage ‐ change from baseline in Schwartz GFR Show forest plot | 1 | | Mean Difference (Fixed, 95% CI) | Totals not selected |
|
| 44.1 Schwartz glomerular filtration rate (mL/min per 1.73m2) | 1 | | Mean Difference (Fixed, 95% CI) | ‐8.0 [‐35.00, 21.00] |
| 45 Signs of organ damage ‐ change from baseline in cystatin C Show forest plot | 1 | | Mean Difference (Fixed, 95% CI) | Totals not selected |
|
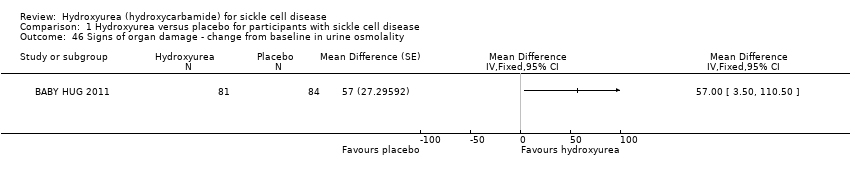
| 46 Signs of organ damage ‐ change from baseline in urine osmolality Show forest plot | 1 | | Mean Difference (Fixed, 95% CI) | Totals not selected |
|
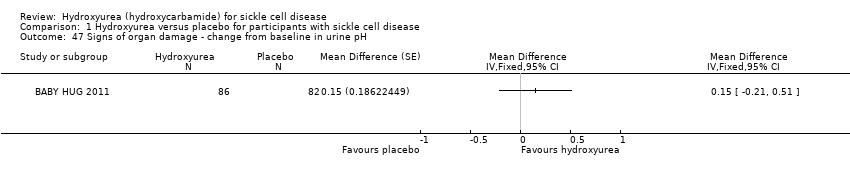
| 47 Signs of organ damage ‐ change from baseline in urine pH Show forest plot | 1 | | Mean Difference (Fixed, 95% CI) | Totals not selected |
|
| 48 Signs of organ damage ‐ change from baseline in urine‐specific gravity Show forest plot | 1 | | Mean Difference (Fixed, 95% CI) | Totals not selected |
|
| 49 Signs of organ damage ‐ change from baseline in total kidney volume Show forest plot | 1 | | Mean Difference (Fixed, 95% CI) | Totals not selected |
|
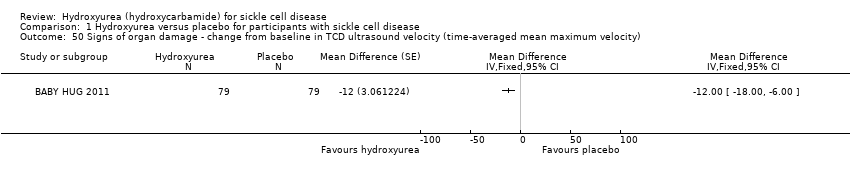
| 50 Signs of organ damage ‐ change from baseline in TCD ultrasound velocity (time‐averaged mean maximum velocity) Show forest plot | 1 | | Mean Difference (Fixed, 95% CI) | Totals not selected |
|
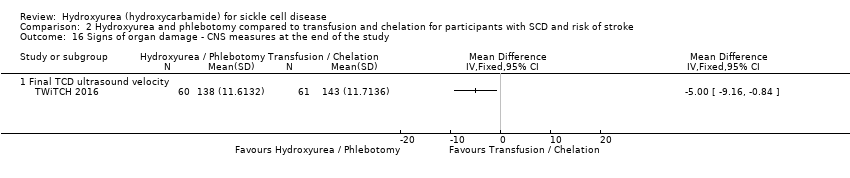
| 51 Signs of organ damage ‐ change from baseline in CNS measures Show forest plot | 1 | | Mean Difference (Fixed, 95% CI) | Totals not selected |
|
| 51.1 Bayley Mental Development Index | 1 | | Mean Difference (Fixed, 95% CI) | 3.0 [0.00, 8.00] |
| 51.2 Bayley motor performance development index | 1 | | Mean Difference (Fixed, 95% CI) | 2.0 [‐1.00, 7.00] |
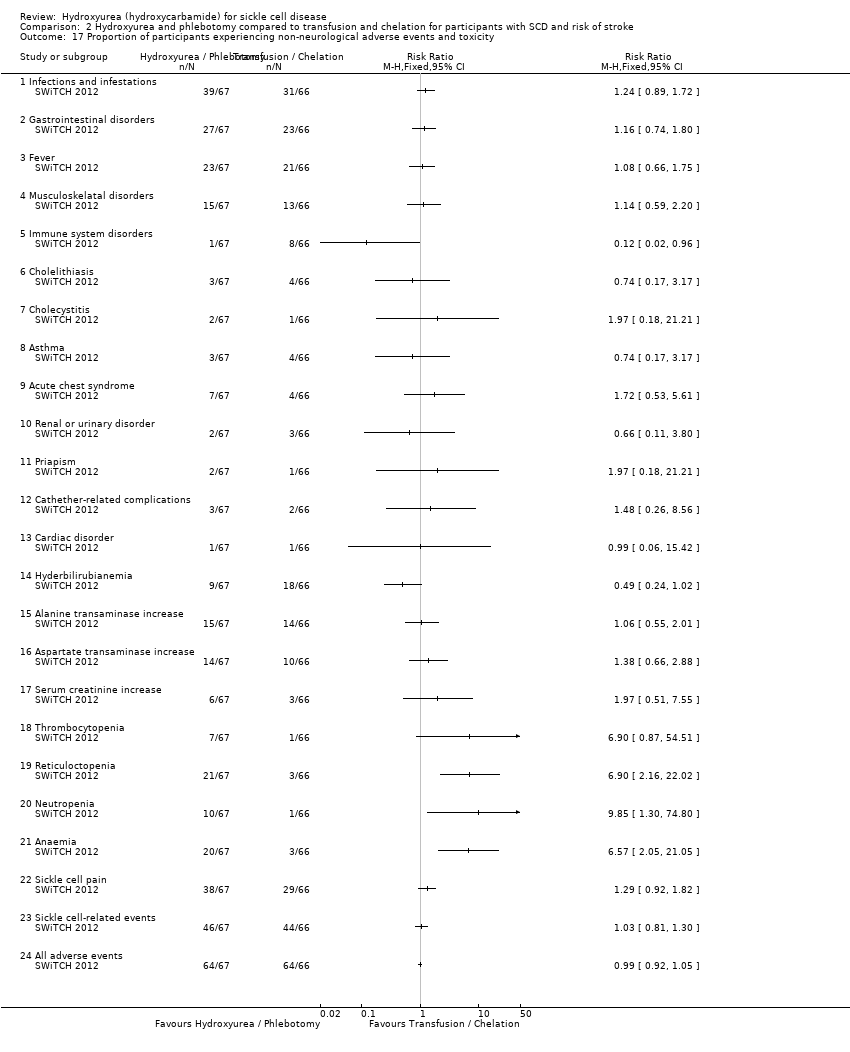
| 52 Proportion of participants experiencing adverse events and toxicity Show forest plot | 3 | | Risk Ratio (M‐H, Fixed, 95% CI) | Totals not selected |
|
| 52.1 hair loss at 1 or 2 visits | 1 | | Risk Ratio (M‐H, Fixed, 95% CI) | 1.25 [0.69, 2.26] |
| 52.2 hair loss at 3 or more visits | 1 | | Risk Ratio (M‐H, Fixed, 95% CI) | 0.61 [0.31, 1.21] |
| 52.3 skin rash at 1 or 2 visits | 1 | | Risk Ratio (M‐H, Fixed, 95% CI) | 0.97 [0.62, 1.51] |
| 52.4 skin rash at 3 or more visits | 1 | | Risk Ratio (M‐H, Fixed, 95% CI) | 0.97 [0.58, 1.60] |
| 52.5 fever at 1 or 2 visits | 1 | | Risk Ratio (M‐H, Fixed, 95% CI) | 0.97 [0.55, 1.69] |
| 52.6 fever at 3 or more visits | 1 | | Risk Ratio (M‐H, Fixed, 95% CI) | 0.89 [0.68, 1.17] |
| 52.7 Gastroinestinal disturbance at 1 or 2 visits | 1 | | Risk Ratio (M‐H, Fixed, 95% CI) | 0.83 [0.50, 1.36] |
| 52.8 Gastrointestinal disturbance at 3 or more visits | 1 | | Risk Ratio (M‐H, Fixed, 95% CI) | 0.98 [0.74, 1.31] |
| 52.9 Other abnormalities at 1 or 2 visits | 1 | | Risk Ratio (M‐H, Fixed, 95% CI) | 0.60 [0.33, 1.11] |
| 52.10 Other abnormalities at 3 or more visits | 1 | | Risk Ratio (M‐H, Fixed, 95% CI) | 1.08 [0.83, 1.40] |
| 52.11 Hospitalisation (for any reason) | 1 | | Risk Ratio (M‐H, Fixed, 95% CI) | 0.83 [0.72, 0.96] |
| 52.12 Dactylitis | 1 | | Risk Ratio (M‐H, Fixed, 95% CI) | 0.34 [0.20, 0.58] |
| 52.13 Priapism | 1 | | Risk Ratio (M‐H, Fixed, 95% CI) | 1.52 [0.26, 8.87] |
| 52.14 Sepsis or bacteraemia | 1 | | Risk Ratio (M‐H, Fixed, 95% CI) | 0.40 [0.08, 2.03] |
| 52.15 Splenomegaly | 1 | | Risk Ratio (M‐H, Fixed, 95% CI) | 0.90 [0.61, 1.32] |
| 52.16 Absolute Neutrophil Count < 500 | 1 | | Risk Ratio (M‐H, Fixed, 95% CI) | 2.53 [0.50, 12.71] |
| 52.17 Absolute Neutrophil 500 ‐ 1250 | 1 | | Risk Ratio (M‐H, Fixed, 95% CI) | 2.53 [1.58, 4.03] |
| 52.18 Thrombocytopaenia | 1 | | Risk Ratio (M‐H, Fixed, 95% CI) | 1.59 [0.64, 3.92] |
| 52.19 Alanine transaminase > 150 U/L | 1 | | Risk Ratio (M‐H, Fixed, 95% CI) | 2.02 [0.19, 21.92] |
| 52.20 Severe anaemia | 1 | | Risk Ratio (M‐H, Fixed, 95% CI) | 0.51 [0.05, 5.48] |
| 52.21 Bilirubin | 1 | | Risk Ratio (M‐H, Fixed, 95% CI) | 0.34 [0.01, 8.17] |
| 52.22 Creatinine | 1 | | Risk Ratio (M‐H, Fixed, 95% CI) | 0.0 [0.0, 0.0] |
| 52.23 Skin and subcutaneous disorders | 1 | | Risk Ratio (M‐H, Fixed, 95% CI) | 0.91 [0.75, 1.10] |
| 52.24 Splenic sequestration | 1 | | Risk Ratio (M‐H, Fixed, 95% CI) | 0.90 [0.36, 2.23] |
| 52.25 Gastroenteritis | 1 | | Risk Ratio (M‐H, Fixed, 95% CI) | 0.44 [0.28, 0.71] |
| 52.26 Nausea | 1 | | Risk Ratio (M‐H, Fixed, 95% CI) | 5.0 [0.25, 99.95] |
| 52.27 Skin Rash | 1 | | Risk Ratio (M‐H, Fixed, 95% CI) | 7.0 [0.38, 129.93] |