Suplementos de ácidos grasos omega‐3 para la fibrosis quística
Resumen
Antecedentes
Los estudios indican que una dieta rica en ácidos grasos esenciales omega‐3 puede tener efectos antiinflamatorios beneficiosos para las enfermedades crónicas como la fibrosis quística. Esta es una versión actualizada de una revisión publicada anteriormente.
Objetivos
Determinar si hay evidencia de que la administración de suplementos de ácidos grasos no saturados omega‐3 reduce la morbilidad y la mortalidad, e identificar los eventos adversos asociados con esta administración.
Métodos de búsqueda
Se realizaron búsquedas en el Registro Especializado de Ensayos Controlados del Grupo Cochrane de Fibrosis Quística y Trastornos Genéticos (Cochrane Cystic Fibrosis and Genetic Disorders Group's Trials Register) que incluye referencias identificadas de búsquedas exhaustivas en bases de datos electrónicas o búsquedas manuales en revistas pertinentes y libros de actas de congresos. Fecha de la última búsqueda: 01 de abril de 2020.
También se realizaron búsquedas en los registros de estudios en línea y se estableció contacto con los autores. Fecha de la última búsqueda: 12 de febrero de 2020.
Criterios de selección
Ensayos controlados aleatorizados realizados en pacientes con fibrosis quística que compararon suplementos de ácidos grasos omega‐3 con placebo.
Obtención y análisis de los datos
Dos autores de la revisión, de forma independiente, seleccionaron los estudios para la inclusión, extrajeron los datos y evaluaron el riesgo de sesgo de los estudios. La calidad de la evidencia se evaluó mediante GRADE.
Resultados principales
Las búsquedas identificaron 23 estudios y se incluyeron cinco estudios con 106 participantes (niños y adultos); la duración de los estudios y las intervenciones fueron diferentes. Dos estudios compararon los ácidos grasos omega‐3 con el aceite de oliva durante seis semanas; un estudio comparó ácidos grasos omega‐3 y ácidos grasos omega‐6 con cápsulas control (mezclas personalizadas de ácidos grasos) durante tres meses; un estudio comparó un suplemento dietético líquido que contenía ácidos grasos omega‐3 con uno sin ellos durante seis meses; y un estudio comparó los ácidos grasos omega‐3 con placebo durante 12 meses. Tres estudios tuvieron bajo riesgo de sesgo en la asignación al azar, pero el riesgo fue incierto en los dos estudios restantes; todos los estudios tuvieron riesgo incierto de sesgo en el ocultamiento de la asignación. Tres de los estudios cegaron adecuadamente a los participantes; el riesgo de sesgo de informe selectivo fue alto en un estudio e incierto en cuatro estudios.
Dos estudios informaron sobre el número de exacerbaciones respiratorias. A los tres meses, un estudio (43 participantes) no informó de cambios en el uso de antibióticos. A los 12 meses, el segundo estudio (15 participantes) informó de una reducción del número de exacerbaciones pulmonares y de días acumulados de antibióticos en el grupo de suplementos, en comparación con el año anterior (no hay datos del grupo control); evidencia de calidad muy baja significa que no hay seguridad de que los suplementos tengan algún efecto sobre este resultado.
Con respecto a los eventos adversos, un estudio de seis semanas (12 participantes) no informó de diferencias en la diarrea entre las cápsulas de omega‐3 o placebo; la evidencia de calidad muy baja significa que no hay seguridad de que la administración de suplementos tenga algún efecto sobre este resultado. Además, un estudio informó de un aumento de la esteatorrea que requirió que los participantes aumentaran la dosis diaria de enzimas pancreáticas, pero tres estudios ya habían aumentado la dosis de enzimas pancreáticas al comienzo del estudio para reducir la incidencia de esteatorrea. Un estudio (43 participantes) informó de dolores estomacales a los tres meses (no se especifica el grupo de tratamiento o control). En un estudio de seis semanas de duración (19 participantes) se informaron tres exacerbaciones del asma que provocaron la exclusión de los participantes, ya que el tratamiento con corticosteroides podía afectar al metabolismo de los ácidos grasos esenciales.
Cuatro estudios informaron sobre la función pulmonar. Un estudio de seis semanas (19 participantes) informó de un aumento del volumen espiratorio forzado en un segundo (VEF1) (L) y de la capacidad vital forzada (CVF) (L), pero la evidencia de calidad muy baja significa que no hay seguridad de que la administración de suplementos tenga algún efecto sobre la función pulmonar. Los estudios restantes no informaron de una diferencia en la función pulmonar a los tres meses (unidad de medida no especificada) o a los seis meses y al año (VEF1 % previsto y CVF % previsto).
No se informaron muertes en los estudios. Cuatro estudios informaron sobre variables clínicas. Un estudio informó de un aumento en la puntuación Schwachman y el peso junto con una reducción del volumen de esputo con la administración de suplementos en comparación con placebo a los tres meses (datos no analizables). Sin embargo, tres estudios no informaron de diferencias en el peso a las seis semanas, en la desviación estándar (DE) del índice de masa corporal (IMC) a los seis meses (evidencia de calidad muy baja) o en la puntuación Z del IMC a los 12 meses.
Tres estudios informaron de marcadores bioquímicos del estado de los ácidos grasos. Un estudio mostró un aumento a partir del inicio en el contenido de EPA y DHA de los fosfolípidos séricos en el grupo de omega‐3 en comparación con placebo a los tres meses y también una disminución significativa en el cociente n‐6/n‐3 en el grupo de suplementos en comparación con placebo; debido a que la calidad de la evidencia es muy baja, no hay seguridad de que estos cambios se deban a los suplementos. Un estudio cruzado de seis meses mostró un mayor contenido de EPA en la membrana de los neutrófilos en el grupo del suplemento en comparación con el grupo placebo, pero no hubo diferencias en la concentración de DHA de la membrana. Además, la proporción de leucotrieno B4 a leucotrieno B5 fue menor a los seis meses en el grupo de omega‐3 en comparación con placebo. Un estudio de un año informó de un mayor aumento del perfil de ácidos grasos esenciales y una disminución de los niveles de AA en el brazo de tratamiento en comparación con placebo.
Conclusiones de los autores
Esta revisión encontró que los suplementos regulares de omega‐3 pueden proporcionar algunos efectos beneficiosos limitados a los pacientes con fibrosis quística con relativamente pocos efectos adversos; sin embargo, la calidad de la evidencia en todos los resultados fue muy baja. La evidencia actual no es suficiente para establecer conclusiones firmes o recomendar el uso habitual de estos suplementos en los pacientes con fibrosis quística. Se necesita un estudio controlado aleatorizado grande, a largo plazo y multicéntrico para determinar si existe un efecto terapéutico significativo, y para evaluar la influencia de la gravedad de la enfermedad, la dosis y la duración del tratamiento. Los futuros investigadores deben tener en cuenta la necesidad de enzimas pancreáticas adicionales al proporcionar suplementos de omega‐3 o cápsulas placebo de aceite de oliva. Se requieren más estudios de investigación para determinar la dosis exacta necesaria de enzimas pancreáticas.
PICO
Resumen en términos sencillos
Administración de suplementos de omega‐3 en pacientes con fibrosis quística
Pregunta de la revisión
Se revisó la evidencia sobre el efecto de dar suplementos de omega‐3 a pacientes con fibrosis quística.
Antecedentes
En los pacientes con fibrosis quística, se cree que los ciclos recurrentes de infección e inflamación empeoran la función pulmonar. Los estudios indican que los ácidos grasos omega‐3 y los derivados de los aceites de pescado, pueden funcionar para contrarrestar la inflamación y pueden ser beneficiosos en las enfermedades inflamatorias crónicas, incluida la fibrosis quística. Esta es una versión actualizada de la revisión.
Fecha de la búsqueda
La evidencia está actualizada hasta: 01 de abril de 2020.
Características de los estudios
Esta revisión incluye cinco estudios pequeños que compararon los suplementos de omega‐3 con un suplemento diferente sin omega‐3. En total hubo 106 participantes, entre niños y adultos. Los estudios duraron entre seis semanas y 12 meses.
Resultados clave
Debido a la evidencia de calidad muy baja, no se sabe con certeza si los siguientes efectos se deben a la administración de suplementos o no. En un estudio de 12 meses se informó de una reducción de las exacerbaciones pulmonares y del uso de antibióticos al tomar suplementos de omega‐3 en comparación con placebo, y en un estudio de tres meses no se informaron cambios en el uso de antibióticos durante el período de estudio. En cualquiera de los estudios se informaron pocos efectos secundarios. Un estudio de seis semanas informó que la función pulmonar y el estado clínico mejoraron al tomar suplementos de omega‐3. También se observó que los niveles de esputo se redujeron en este estudio de seis semanas. Tres estudios no informaron de diferencias en la función pulmonar al tomar suplementos de omega‐3 en comparación con placebo. En dos estudios más largos, se comprobó que los pacientes que tomaban suplementos de omega‐3 mostraban aumentos definitivos de los niveles de ácidos grasos esenciales en las membranas de los glóbulos blancos y también de los niveles de fosfolípidos (moléculas que proporcionan estructura y protección a las células) medidos en muestras de sangre.
No hay seguridad con respecto a si los suplementos regulares de omega‐3 benefician a los pacientes con fibrosis quística ni si causan efectos secundarios o no. No es posible establecer conclusiones firmes ni recomendar el uso rutinario de estos suplementos en pacientes con fibrosis quística. Se requieren ensayos más grandes y de mayor duración para evaluar el efecto clínico beneficioso de la administración de suplementos de omega‐3 y determinar la dosis apropiada.
Calidad de la evidencia
Se consideró que la calidad de la evidencia fue muy baja debido al escaso número de participantes, a las bajas tasas de eventos, a los informes limitados y al diseño deficiente de los estudios. No hubo consistencia en cuanto a los puntos temporales en que se informaron los resultados o las mediciones utilizadas para el mismo resultado en diferentes estudios.
Authors' conclusions
Summary of findings
| Omega‐3 fatty acid supplementation compared with placebo for cystic fibrosis | ||||||
| Patient or population: children and adults with cystic fibrosis Settings: outpatients Intervention: oral omega‐3 supplementation (EPA or DHA, or both) Comparison: placebo | ||||||
| Outcomes | Illustrative comparative risks* (95% CI) | Relative effect | No of Participants | Quality of the evidence | Comments | |
| Assumed risk | Corresponding risk | |||||
| Placebo | Omega‐3 supplementation | |||||
| Number of pulmonary exacerbations (median number of exacerbations during the study) Follow‐up: 12 months | The number of exacerbations in the placebo group was greater than in the omega‐3 group (3.5 versus 1.7 (range 1 ‐ 3)). | N/A | 13 | ⊕⊝⊝⊝ | The authors only report the number of exacerbations in the supplemented group compared to the 12 months prior to the trial. Extra data was provided by the study authors to allow a between group comparison. This outcome was not included in the study protocol. | |
| Adverse events: diarrhoea Follow‐up: 6 weeks | 1 study reported drop out due to diarrhoea. 2 out of 7 participants in the fish oil group dropped out and 2 out of 5 participants in the placebo group, OR 0.6 (0.05 to 6.79). | OR 0.6 (0.05 to 6.79) | 12 | ⊕⊝⊝⊝ | Other adverse events included stomach pains (5/35 participants) but the intervention arm wasn't specified (Keen 2010). | |
| FEV1 % predicted Follow‐up: 6 months | The mean FEV1 % predicted was 64% in the control group. | The mean FEV1 % predicted in the intervention group was 2% higher (19.1% lower to 23.11% higher) | MD 2.00 (19.11 to 23.11) | 17 | ⊕⊝⊝⊝ | A further study (n = 16) reported a significant increase from baseline in the EPA group compared to the control group measured in L compared to the placebo group (P = 0.06) (Lawrence 1993). Two studies reported no difference in FEV1 % predicted or lung function (measurement not stated) between groups (Hanssens 2016; Keen 2010) |
| FVC % predicted Follow‐up: 6 months | The mean FVC % predicted in the control group was 81%. | The mean FVC % predicted in the intervention group was 1% lower (16.65 % lower to 14.65 % higher). | MD ‐1.00 (‐16.65 to 14.65) | 17 | ⊕⊝⊝⊝ | 1 study reported a significant rise in FVC (L) in the EPA group (P = 0.01) (Lawrence 1993). 2 studies reported no difference in FVC between groups, but no data were available for analysis (Hanssens 2016; Keen 2010). |
| Growth and nutrition: BMI SD score Follow‐up: 6 months | No significant difference was seen between the PUFA group and the placebo group after 6 months. | MD 0.00 (95 % CI ‐0.64 to 0.64) | 29 | ⊕⊝⊝⊝ | A further study reported on BMI but reported only that BMI z scores remained stable throughout the study (Hanssens 2016). | |
| Biochemical markers of essential fatty acid status: EPA and DHA % content of neutrophil membrane Follow‐up: 6 months | 1 study reported a higher EPA content of the neutrophil membrane in the omega‐3 PUFA‐supplemented group compared to the placebo group, MD 0.90 (95% CI 0.46 to 1.34). In the same study, no difference was observed in DHA membrane concentration between groups, MD 0.10 (95% CI ‐0.45 to 0.65) | 29 | ⊕⊝⊝⊝ | At 6 months, Keen reported a significant increase from baseline in both EPA and DHA content of serum phospholipids in the omega‐3 supplemented group compared to placebo, MD 0.70 (95% CI 0.42 to 0.98) and MD 1.10 (95% CI 0.39 to 1.81), respectively (Keen 2010). | ||
| *The basis for the assumed risk (e.g. the median control group risk across studies) is provided in footnotes. The corresponding risk (and its 95% confidence interval) is based on the assumed risk in the comparison group and the relative effect of the intervention (and its 95% CI). | ||||||
| GRADE Working Group grades of evidence | ||||||
| aDowngraded twice due to risk of bias within the included study for this outcome. There was uncertainty around allocation concealment and blinding and a high risk of bias due to selective reporting. bDowngraded once due to imprecision from very low participant numbers and low event rates. cDowngraded once due to risk of bias within the included study. It was unclear whether allocation was concealed and whether the outcomes were predefined as there was no protocol available. dDowngraded twice due to very low participant numbers (n = 12) and low event rates. eDowngraded twice due to risk of bias within the trial. The risk of bias was unclear across several domains including; randomisation, allocation concealment, incomplete outcome assessment and selective reporting. | ||||||
Background
Description of the condition
Cystic fibrosis (CF) is the most common life‐threatening genetically inherited disease in populations of Northern European descent, affecting approximately one in 2500 births (CF Trust 2006; UK CF Registry 2018). Pulmonary inflammation is believed responsible for the progressive loss of lung function that is the major cause of morbidity and mortality in CF (Konstan 1996). In response to lung infections, with organisms such as Pseudomonas aeruginosa, neutrophils (white blood cells) accumulate within the airways, producing proteolytic enzymes and oxidants which mediate the inflammatory response (Wilmott 2000). These neutrophils contribute to the thick and viscous secretions characteristic of CF, leading to mucus plugging of the smaller airways and further cycles of infection and inflammation. Treatment with anti‐inflammatory drugs, including corticosteroids (Cheng 1999; CF Trust 2015) and non‐steroidal anti‐inflammatory agents (Lands 2007), have been shown to have some benefit.
Description of the intervention
Mucus may also prevent pancreatic enzymes reaching the intestine and lead to malabsorption (especially fat malabsorption), diarrhoea and failure to thrive (Hunt 1985; Imrie 1975). The importance of growth and nutrition on survival in CF is well established (Corey 1998; Dodge 1988; Gaskin 1982). Dietary strategies concentrate upon providing a high energy and high protein diet, together with pancreatic enzyme replacement therapy (CF Trust 2016). Despite this, there are many people with CF with sub‐optimal nutritional absorption who continue to require fat soluble vitamins on a daily basis (Benabdeslam 1998; CF Trust 2016).
How the intervention might work
It has been hypothesised that essential fatty acid deficiency may contribute to the development of respiratory disease in infants, even before clinical signs become apparent (Lloyd‐Still 1996). Furthermore, animal models suggest that phenotypic changes in the CF‐affected organs of lung, pancreas and intestine may be due to a defect in essential polyunsaturated fatty acid metabolism (Freedman 1999).
In humans, the polyunsaturated fatty acids (PUFA) linoleic acid (18:2 omega‐6, or n‐6) and alpha‐linolenic (18:3 omega‐3, or n‐3) are 'essential' for normal growth and function; the only source is dietary. The nomenclature refers to their chemical structure.
Research into the omega‐3 series of essential polyunsaturated fatty acids stems from the observation that the native Inuit (Eskimo) of Greenland (who consume a traditional diet rich in fish oils) have a very low incidence of some of the chronic inflammatory immune‐based disorders commonly found in Europe and North America (Corcoran 1937; Osterud 1995). Fish oils are the richest dietary source of the metabolically active omega‐3 fatty acid derivatives eicosapentaenoic acid (EPA) and docosahexaenoic acid (DHA); however alternative and novel sources are currently being researched. Omega‐3 fatty acids have been shown to play an important role in the integrity of cellular membranes, where they exert a profoundly anti‐inflammatory response. Some of the beneficial effects of omega‐3 fatty acids on inflammatory disease can be explained by a decrease in the production of pro‐inflammatory metabolites from the omega‐6 fatty acid family and an increase in the biologically less‐active omega‐3 end products (Gaszo 1989). Studies suggest that these fatty acids can exert anti‐inflammatory effects which may benefit a range of chronic inflammatory diseases, including CF.
Why it is important to do this review
As has been discussed above, the absorption of fatty acids may be impaired in people with CF for a number of reasons and it is therefore possible that supplementation with omega‐3 fatty acids may prove to be an effective treatment although details of dosage and administration remain to be elucidated. This is an update of previous versions of the review (Beckles‐Willson 2002; Oliver 2010; Oliver 2011; Oliver 2013; Oliver 2016).
Objectives
To determine whether there is evidence that omega‐3 polyunsaturated fatty acid supplementation reduces morbidity and mortality. To identify any adverse events associated with omega‐3 polyunsaturated fatty acid supplementation in CF.
Methods
Criteria for considering studies for this review
Types of studies
Randomised controlled trials (RCTs), quasi‐randomised trials, and cross‐over trials.
Types of participants
People with CF, of any age and severity, diagnosed clinically and by sweat or genetic testing.
Types of interventions
Dietary supplementation of omega‐3 essential fatty acids of any dosage, frequency and duration compared with placebo in people with CF. The supplements contain omega‐3 fatty acids in the form of eicosapentaenoic acid (EPA) or docosahexaenoic acid (DHA), or both. Studies were included if they compared the effect of this intervention with a placebo with low omega‐3 or omega‐6 fatty acid content, such as olive oil.
Types of outcome measures
Primary outcomes
-
Number of respiratory exacerbations including:
-
hospitalisations
-
number of courses of antibiotics given (oral and intravenous) (moved from secondary outcomes in a post hoc change)
-
-
Adverse events and dropouts
-
Lung function including
-
per cent predicted forced expiratory volume in one second (FEV1)
-
forced vital capacity (FVC)
-
Secondary outcomes
-
Quality of life
-
Number of deaths
-
Clinical variables including indices of growth or nutrition
-
Bronchial responsiveness as measured by any provocation testing
-
Biochemical markers of essential fatty acid status including plasma, platelet and erythrocyte (red blood cell) levels of EPA or DHA or both, plus omega‐3 to omega‐6 fatty acid ratio
Search methods for identification of studies
We did not restrict the searches by language, year or publication status.
Electronic searches
Relevant studies were identified from the Group's cystic fibrosis trials register using the terms: omega‐3 fatty acids.
The Group's Cystic Fibrosis Trials Register is compiled from electronic searches of the Cochrane Central Register of Controlled Trials (CENTRAL) (updated each new issue of the Cochrane Library), weekly searches of MEDLINE, a search of Embase to 1995 and the prospective handsearching of two journals ‐ Pediatric Pulmonology and the Journal of Cystic Fibrosis. Unpublished work is identified by searching through the abstract books of three major cystic fibrosis conferences: the International Cystic Fibrosis Conference; the European Cystic Fibrosis Conference and the North American Cystic Fibrosis Conference. For full details of all searching activities for the register, please see the relevant sections of the website.
In addition, the original review team performed electronic searches of CINAHL and EMBASE (from 1995 to April 2007) (Appendix 1). When the current review team took on this review, these searches were no longer run. The current review team have searched the online registries clinicaltrials.gov and the WHO ICTRP (Appendix 2).
Date of the most recent search of the Group's Cystic Fibrosis Trials Register: 01 April 2020.
Searching other resources
The reference lists of all studies identified have also been checked. The first author of each paper was contacted and invited to identify any other published or unpublished studies that might be relevant.
Data collection and analysis
Selection of studies
For the current version of the review, two authors (HW, CS) independently selected studies to be included in the review. If there had been any disagreement, they would have resolved this by discussion.
Data extraction and management
The two authors (HW, CS for 2019 update onwards) independently extracted data onto data acquisition forms. Authors discussed all stages of data extraction and interpretation and there were no disagreements to resolve.
They grouped outcome data into those measured at six and 12 weeks and at six and 12 months from baseline. For future updates of this review, if data are reported at any other time periods, they will consider reporting these as well.
Since hospitalisations are often used as a marker for respiratory exacerbations, if the authors include a study which reports hospitalisations in addition to or instead of exacerbations, they will include this information in the review under the first primary outcome ‘Number of respiratory exacerbations’.
Assessment of risk of bias in included studies
Two authors (HW, CS) assessed each trial using the domain‐based evaluation as described in the Cochrane Handbook for Systematic Reviews of Interventions (Higgins 2011).
The authors assessed the following domains as low risk of bias, unclear risk of bias or high risk of bias.
-
Randomisation (low risk ‐ random number table, computer‐generated lists or similar methods; unclear risk ‐ described as randomised, but no details given; high risk ‐ e.g. alternation, the use of case record numbers, and dates of birth or day of the week).
-
Concealment of allocation (low risk ‐ e.g. list from a central independent unit, on‐site locked computer, identically appearing numbered drug bottles or containers prepared by an independent pharmacist or investigator, or sealed opaque envelopes; unclear risk ‐ not described; high risk ‐ if allocation sequence was known to, or could be deciphered by the investigators who assigned participants or if the trial was quasi‐randomised).
-
Blinding (of participants, personnel and outcome assessors) (low risk ‐ e.g. there was no blinding, but we judge that the outcome and the outcome measurement are not likely to be influenced by lack of blinding, or at least outcome assessors were blinded; unclear risk ‐ not described; high risk ‐ e.g. no or incomplete blinding, and the outcome or outcome measurement is likely to be influenced by lack of blinding, or blinding was attempted, but likely to have been broken).
-
Incomplete outcome data (Whether investigators used an intention‐to‐treat analysis) (low risk ‐ e.g. no missing data, or missing data have been imputed using appropriate methods; unclear risk ‐ e.g. insufficient reporting of attrition/exclusions; high risk ‐ e.g. reason for missing outcome data likely to be related to true outcome, with either imbalance in numbers or reasons for missing data across intervention groups).
-
Selective outcome reporting (low risk ‐ e.g. the study protocol is available and all of the studies pre‐specified (primary and secondary) outcomes that are of interest in the review have been reported in the pre‐specified way; unclear risk ‐ e.g. insufficient information to permit judgement; high risk ‐ e.g. not all of the study's pre‐specified primary outcomes have been reported).
-
Other potential sources of bias (low risk ‐ the study appears to be free of other sources of bias; unclear risk ‐ e.g. insufficient information to assess whether an important risk of bias exists; high risk ‐ e.g. had a potential source of bias related to the specific study design used, or had extreme baseline imbalance).
The authors compared assessments and resolved any inconsistencies by discussion.
Measures of treatment effect
For binary outcomes, the authors have calculated a pooled estimate of the treatment effect for each outcome across studies using the odds ratio (OR) (the odds of an outcome among treatment allocated participants to the corresponding odds among controls) and 95% confidence intervals (CIs). For continuous outcomes, they recorded either mean change from baseline for each group or mean post‐treatment or intervention values and standard deviations for each group. Then, where appropriate, they have calculated a pooled estimate of treatment effect by calculating the mean difference (MD) and 95% CIs.
Unit of analysis issues
When conducting a meta‐analysis combining results from cross‐over studies the authors planned to use the methods recommended by Elbourne (Elbourne 2002). Limited availability of data would mean, we would only able to either use only the first‐arm data or to treat the cross‐over studies as if they are parallel studies. Elbourne states that this approach will produce conservative results as it does not take into account within‐patient correlation (Elbourne 2002). Also each participant will appear in both the treatment and control group, so the two groups will not be independent. For one cross‐over study included in the review, the authors were not able to access the first‐arm data, and so they have treated the study as if it were parallel (Panchaud 2006). If they are able to obtain a correlation co‐efficient for future updates of this review, they will analyse the data more appropriately.
Dealing with missing data
For future updates of the review, in order to allow an intention‐to‐treat analysis, the authors will seek data on the number of participants by allocated treatment group, irrespective of compliance and whether or not the participant was later thought to be ineligible or otherwise excluded from treatment or follow up.
The review authors have requested missing data from the primary investigators of two studies on several occasions (Koletzko 2000; Romano 1997); however, up until 2007 there was no response. They have therefore excluded these studies and do not plan to contact the authors of them again in the future.
We required and requested additional data from the authors of one study regarding the detail of the protocol and the results table (Hanssens 2016). We also required additional data to analyse comparisons between the two CF groups in the included Henderson study; however, a reply from the author has not been received to date (Henderson 1994).
Assessment of heterogeneity
For future updates of the review, if the authors are able to present combined data from a sufficient number of studies (at least four), they will test for heterogeneity between study results using the I² statistic (Higgins 2003). For this measure of consistency of results across studies values range from 0% to 100%. They plan to categorise heterogeneity in a simple way such that if the I² value is around 25% or below, they consider heterogeneity to be low; if the value is around 50%, they will consider it moderate; if the value is around 75% or above, they will consider it high.
Assessment of reporting biases
The review authors checked that the study investigators reported on all the outcomes they stated they planned to measure in the full publications of their studies. When the authors include a sufficient number of studies, they will attempt to assess whether this review is subject to publication bias by using a funnel plot. If they detect asymmetry, they will explore causes other than publication bias.
The review authors also checked for selective outcome reporting by comparing the protocols of the included studies (where available) to the final paper to ensure that the investigators reported all outcomes measured. If the study protocols were not available, the review authors compared the 'Methods' section to the 'Results' section in the final published paper.
Data synthesis
The review authors have analysed their data using a fixed‐effect model. However, if for future updates they identify moderate or high degrees of heterogeneity, they will analyse the data using a random‐effects model.
Subgroup analysis and investigation of heterogeneity
If the authors identify moderate or high degrees of heterogeneity and they are able to included sufficient studies in the review (at least four), they plan to investigate this by performing subgroup analyses (e.g. children versus adults and severity of existing lung disease).
Sensitivity analysis
If the authors identify moderate or high degrees of heterogeneity and they are able to include sufficient studies in the review, they also plan a sensitivity analysis comparing trials with or without cross‐over design.
Summary of findings tables
In line with current Cochrane guidance, at the 2020 update the authors have presented the outcomes listed below in a summary of findings table (Summary of findings table 1). The authors selected these outcomes based on relevance to clinicians and consumers.
-
Number of respiratory exacerbations
-
Adverse events
-
FEV1 % predicted
-
FVC % predicted
-
Clinical variables of growth and nutrition
-
Biochemical markers of essential fatty acid status
For each outcome we report the illustrative risk with and without the intervention, magnitude of effect (RR or MD), numbers of trials and participants addressing each outcome and a grade of the overall quality of the body of evidence using the Grading of Recommendations Assessment, Development and Evaluation (GRADE) with comments (Schünemann 2011a).
Results
Description of studies
Results of the search
The literature searches identified 23 studies, including five clinical trials identified from online trials registries. Five studies involving 106 participants with CF met the inclusion criteria (Hanssens 2016; Henderson 1994; Keen 2010; Lawrence 1993; Panchaud 2006). For the 2020 update, one abstract previously listed as awaiting classification was a related reference to a full published study which met the inclusion criteria (Hanssens 2016). One further abstract previously listed under awaiting classification did not have sufficient information to include it in the review; we contacted the author for further information but no response was received, therefore it was excluded (O'Sullivan 2011). A total of 13 studies published as abstracts or full papers were excluded with reasons; (Alicandro 2013; Christophe 1992; Katz 1996; Koletzko 2000; Kurlandsky 1994; Lloyd‐Still 2006; O'Connor 2016; O'Sullivan 2011; Pastor 2019; Romano 1997; Starling 1988; van Biervliet 2008; Vericel 2019). The five clinical trials identified from online trials registries were also excluded; (EUCTR2006‐004155038‐BE, NCT02518672; NCT02646995; NCT02690857; NCT03045198). Please also see the PRISMA diagram generated for this process (Figure 1).

Study flow (PRISMA) diagram
Included studies
See Characteristics of included studies.
Study characteristics
All five included studies were RCTs (Hanssens 2016; Henderson 1994; Keen 2010; Lawrence 1993; Panchaud 2006). Study duration varied from six weeks (Henderson 1994) to 12 months (Hanssens 2016). The number of participants varied from 12 (Henderson 1994) to 43 (Keen 2010).
Three studies were of parallel design (Hanssens 2016; Henderson 1994; Keen 2010). One study split participants into two groups who received either an omega‐3 PUFA supplement or placebo (Hanssens 2016). Henderson split participants into four groups, two of which were in people without CF, we did not consider information from the groups without CF, as healthy participants are not eligible for inclusion in the review. The two groups of participants with CF received either active supplement or placebo (Henderson 1994). The third study randomised participants to three groups: one group received a high omega‐3 fatty acid blend (EPA and DHA); one group received a fatty acid blend containing predominantly omega‐6 fatty acids (linoleic acid (LA), arachidonic acid (AA)); the control group received a high saturated‐fatty acid (SFA) blend. We did not consider results from the group receiving the omega‐6 fatty acid intervention as this intervention was eligible for inclusion in the review (Keen 2010).
Two studies were of cross‐over design (Lawrence 1993; Panchaud 2006). Lawrence found a carry‐over effect despite a 12‐week washout period, therefore, only the results from the 16 participants who completed the first six‐week period of the study were used (Lawrence 1993). Panchaud did not include a washout period and we have treated this study as if it had a parallel design (Panchaud 2006).
Participants
All five studies included both children and adults (Hanssens 2016; Henderson 1994; Keen 2010; Lawrence 1993; Panchaud 2006), although only two studies included older adults, where the age range was stated as up to 41 years (Keen 2010), and 30.4 years (Hanssens 2016). None of the studies were very large; the number of participants in each trial ranged from 12 (Henderson 1994) to 43 (Keen 2010). There were more males in four of the studies (Hanssens 2016; Henderson 1994; Lawrence 1993; Panchaud 2006), but one more female than males in the Keen study (Keen 2010).
Four studies described participants as having pancreatic insufficiency (Hanssens 2016; Henderson 1994; Keen 2010; Panchaud 2006). Pancreatic status was not explicitly specified in one study (Lawrence 1993). Two studies stated that participants were chronically infected with Pseudomonas aeruginosa (Keen 2010; Lawrence 1993). Keen additionally described participants as having severe mutations (Keen 2010). One study described participants as homozygous for the Delta F508 mutation and already undergoing azithromycin treatment for more than three months (Hanssens 2016).
Interventions
Two studies compared omega‐3 fatty acids to olive oil control for a six‐week treatment period (Henderson 1994; Lawrence 1993). One study compared omega‐3 fatty acids to placebo control for a six‐month treatment period (Panchaud 2006). Another study compared essential fatty acid supplementation to a placebo for a three‐month treatment period (Keen 2010). One study compared omega‐3 fatty acids to placebo control for a 12‐month treatment period (Hanssens 2016).
The dose and form of omega‐3 fatty acids differed between the studies. Henderson used four 1 g capsules of fish oil, twice daily (containing a daily dose of 3.2 g EPA and 2.2 g DHA) (Henderson 1994). Lawrence used fish‐oil capsules containing a daily total of 2.7 g EPA (Lawrence 1993). Panchaud used a liquid PUFA mixture containing 0.2 g EPA and 0.1 g DHA per 200 mL (Panchaud 2006). The volume of supplementation was determined according to participant's weight; intake ranged from 200 mg to 600 mg EPA and 100 mg to 300 mg DHA per day. Keen used a customised fatty acid blend containing 21.27 % mmol EPA and 6.99 % mmol DHA and participants received 50 mg per kg body weight per day (Keen 2010). Hanssens used an omega‐3 PUFA supplementation containing 300 mg omega‐3 triglycerides from fish oil, specifically providing 100 mg DHA and 150 mg EPA. The total daily dose was calculated to correspond to 60 mg/kg body weight (Hanssens 2016).
Outcomes
All five studies reported on adverse events (Hanssens 2016; Henderson 1994; Keen 2010; Lawrence 1993; Panchaud 2006) and three on deaths (Henderson 1994; Lawrence 1993; Panchaud 2006). Two studies reported on changes in haematological indices (Henderson 1994; Lawrence 1993). Two studies presented data on serum fatty acid content (Henderson 1994; Keen 2010) and two on changes in in vitro neutrophil chemotaxis (Lawrence 1993; Panchaud 2006). Three studies reported responses to inflammatory markers and nutritional indices (Hanssens 2016; Keen 2010; Panchaud 2006). Four studies reported on lung function (Hanssens 2016; Keen 2010; Lawrence 1993; Panchaud 2006). Two studies reported on change in the number of respiratory exacerbations or antibiotic usage (Hanssens 2016; Keen 2010).
Excluded studies
See Characteristics of excluded studies.
13 studies have been excluded from the review. One study used parenteral (via blood stream), not enteral (oral) supplementation with omega‐3 fatty acids (Katz 1996). Five studies compared omega‐3 supplementation with a large omega‐6 fatty acid source, rather than a neutral placebo that contains relatively little omega‐3 or omega‐6 fatty acid such as olive oil. One study compared omega‐3 supplementation with borache oil (Christophe 1992), two studies with sunflower oil (Kurlandsky 1994; van Biervliet 2008) one study with germ oil (Alicandro 2013) and one study with corn/soy oil as placebo (Lloyd‐Still 2006). Two studies compared omega‐3 supplementation with a large omega‐6 fatty acid source (sunflower oil) rather than a neutral placebo containing relatively little omega‐3 or omega‐6 (O'Connor 2016; Vericel 2019). One study was aimed to identify a suitable approach for monitoring the incorporation of omega‐3 fatty acids in nutritional studies and was not a comparison of omega‐3 fatty acids with control (Pastor 2019).
Four studies were excluded on the basis of insufficient information and a lack of response from the studies' authors (Koletzko 2000; O'Sullivan 2011; Romano 1997; Starling 1988).
Risk of bias in included studies
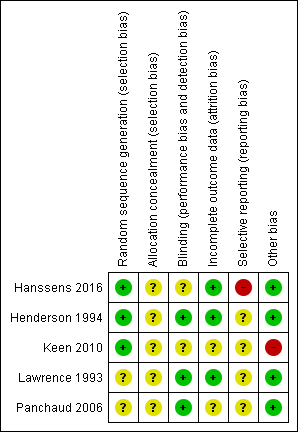
Please see the risk of bias summary presented in the figures (Figure 2).

Risk of bias summary: review authors' judgements about each risk of bias item for each included study.
Allocation
Generation of randomisation sequence
All five studies were described as randomised, but only three studies gave details on the randomisation process and we graded these studies as having a low risk of bias (Hanssens 2016; Henderson 1994; Keen 2010). The Henderson study was randomised using a stratified randomised block design, whilst the Keen study was randomised using a random number generator (Henderson 1994; Keen 2010). The Hanssens study was randomised using a randomised block design stratified according to participant weight (Hanssens 2016). The remaining two studies did not state the randomisation technique, so were graded as having an unclear risk of bias (Lawrence 1993; Panchaud 2006).
Concealment of allocation
Allocation concealment was graded as having an unclear risk of bias for all five studies as no details were provided in the primary papers (Hanssens 2016; Henderson 1994; Keen 2010; Lawrence 1993; Panchaud 2006).
Blinding
All five studies were described as double blind, details were provided as follows. While the capsules in the Henderson study were also not described as identical, it was stated that the placebo olive oil capsules were flavoured to obtain a slight fish taste which the review authors agreed would be sufficient to blind participants (Henderson 1994). In the Lawrence study, the treatment was administered as "identical olive oil capsules" (Lawrence 1993). In the third study, the placebo treatment was not stated to be identical but it was described as the same liquid dietary supplement as the intervention but without the PUFA mixture (Panchaud 2006). We therefore attributed a low risk of bias to each of these three studies.
In two studies, the appearance of the capsules was not described and two of 12 participants (Keen 2010) complained of a fish smell in the omega‐3 treatment group. The appearance of the capsules is not described in Hanssens study but one participant withdrew from the study due to the fishy taste of the capsules (Hanssens 2016). Therefore, the risk of bias in these studies is unclear (Hanssens 2016; Keen 2010).
Incomplete outcome data
In all five studies, withdrawals from the study were discussed with explanations (Hanssens 2016; Henderson 1994; Keen 2010; Lawrence 1993; Panchaud 2006). Further details of these withdrawals are given in the tables (Characteristics of included studies). Only one study included all participants in the data analysis, which was performed according to the intention‐to‐treat principle and this study was judged to have a low risk of bias (Henderson 1994).
The remaining four studies did not employ this approach, but did describe withdrawals from the study (Hanssens 2016; Keen 2010; Lawrence 1993; Panchaud 2006). In two studies there was a low dropout rate; in one study two out of 15 participants dropped out (Hanssens 2016) and in the second three out of 19 dropped out (Lawrence 1993). We therefore assessed these two studies as having a low risk of bias. The remaining two studies were judged to have an unclear risk of bias (Keen 2010; Panchaud 2006). More than 15% of participants entering one study were excluded from data analysis and only results of 35 participants who completed the study were used in the review (Keen 2010). In the second study, some of the data from baseline and end of treatment in the placebo and treatment groups were excluded from analysis due to "technical reasons" which were not defined (Panchaud 2006).
Selective reporting
We have not been able to determine any selective reporting from the final publication of four of the included studies (unclear risk of bias); however, we have not been able to compare the full study reports to the original study protocols (Henderson 1994; Keen 2010; Lawrence 1993; Panchaud 2006).
The remaining study has a high risk of selective reporting bias (Hanssens 2016). The original study protocol refers to clinical status as an outcome, however, it does not explicitly detail which clinical parameters are to be measured as specific primary and secondary outcomes. The frequency and duration of treatment with IV antibiotics is not specifically defined as a primary outcome, but in the published paper the primary finding is of a decrease in cumulative IV antibiotic duration and in number of pulmonary exacerbations at 12 months. Furthermore, these data are presented as medians for treatment and placebo groups, but without full ranges for the placebo group (Hanssens 2016).
Other potential sources of bias
There is a potential source of bias in one of the studies that did not describe the actual dose of EPA and DHA given (Keen 2010). We have not been able to determine any other potential sources of bias in four of the included studies and judge there to be a low risk of bias (Hanssens 2016; Henderson 1994; Lawrence 1993; Panchaud 2006).
Effects of interventions
The effects of interventions are summarised in the summary of findings table, the quality of the evidence has been graded for pre‐defined outcomes (see above) and definitions of these gradings provided (summary of findings Table for the main comparison).
Primary outcomes
1. Number of respiratory exacerbations
Two studies reported data related to this outcome (Hanssens 2016; Keen 2010); three of the studies did not measure respiratory exacerbations (Henderson 1994; Lawrence 1993; Panchaud 2006).
One study (n = 13) reported the median (range) number of pulmonary exacerbations, comparing the number of exacerbations in the study to the number in the previous 12 months (Hanssens 2016). Investigators only reported the significant change for the within‐group data for the supplement group in the main publication, but further limited data have been obtained from the author to allow a comparison between intervention and placebo (Hanssens 2016) (very low‐quality evidence from this study at this time‐point).
| 12 months prior to study begin (median (range)) | During study (median (range)) | |
| Omega‐3 supplement | 3.0 (1 ‐ 6) | 1.7 (1 ‐ 3) |
| Placebo | 2.0 | 3.5 |
It is important to note that the number of pulmonary exacerbations did not appear in the original study protocol, and was measured at baseline and 12 months unlike other clinical parameters in the study. Furthermore, the small number of participants in the study increases the possibility that the reduction in pulmonary exacerbations may not have been caused by omega‐3 supplementation. Also, at baseline the median (range) FEV1 % predicted of participants in the placebo group (n = 7) was lower than in the treatment group (n = 6), 65% (47 to 104) versus 83% (64 to 121), respectively (Hanssens 2016).
Hanssens also reported on the cumulative number of antibiotic therapy days (IV and oral) for participants compared to the previous 12 months and between groups (Hanssens 2016).
| 12 months up to start of study median (range) | Antibiotic days at 9 months median (range) | Antibiotic days at 12 months median (range) | |
| Omega‐3 supplement | 60 days (0 ‐ 122) | 24.5 days (0 ‐ 43) | 26.5 days (0 ‐ 56) |
| Placebo | 60 days (0 ‐ 90) | 46 days (15 ‐ 92) | 65 days (15 ‐ 113) |
One further study (n = 45) reported there to be no difference in antibiotic use during the study, compared with a similar time period in the previous year; however, no data on the differences in antibiotic days were reported (Keen 2010).
2. Adverse events and dropouts
All five studies reported on adverse events (Hanssens 2016; Henderson 1994; Keen 2010; Lawrence 1993; Panchaud 2006); however, one study simply stated that overall there were no adverse effects of treatment (Panchaud 2006).
a. Steatorrhoea
One study (n = 12) reported that by six weeks, participants in both treatment and control groups needed to increase their daily dose of pancreatic enzyme capsules due to an increase in steatorrhoea and stool frequency (Henderson 1994).
In three studies prior to study start the daily pancreatic enzyme dose was increased for participants in both the intervention and placebo groups to prevent steatorrhoea; there were no reported events of stearrhoea in these three studies (Hanssens 2016; Keen 2010; Lawrence 1993).
One study did not specifically report this adverse event (Panchaud 2006).
b. Diarrhoea
In the Henderson study, two out of seven participants in the treatment group stopped fish oil supplements because of diarrhoea; the same symptoms caused two out of five participants in the placebo group to withdraw (Henderson 1994). There was no significant difference between the groups, odds ratio (OR) 0.60 (95% confidence interval (CI) 0.05 to 6.80) (Analysis 1.1) (very low‐quality evidence from this study at this time‐point).
Diarrhoea was not reported in the remaining studies (Hanssens 2016; Keen 2010; Lawrence 1993; Panchaud 2006).
c. Asthma
Only one cross‐over study (n = 19) reported this event (Lawrence 1993). Three participants (one in the supplement group and two in the placebo group) had an asthma exacerbation requiring corticosteroid therapy and were excluded from analysis. The authors argued that corticosteroids affect essential fatty acid metabolism (Lawrence 1993).
d. Stomach pains
Only one study (n = 35) reported that five participants (treatment group not specified) complained of stomach pains; two participants withdrew from the study due to stomach pains (Keen 2010).
3. Lung function
Lung function was not measured in one study (Henderson 1994).
a. FEV1
There were no differences in FEV1 % predicted reported in the cross‐over Panchaud study (n = 16) at six months (Panchaud 2006), MD 2.00 (95% CI ‐19.11 to 23.11) (Analysis 1.2) (very low‐quality evidence from this study at this time‐point).
One short‐term study (n = 16) reported on FEV1 (L), but investigators reported median (range) values and we are unable to analyse data in this review (Lawrence 1993). Investigators reported a significant increase from baseline in FEV1 in the EPA group, median 0.25 L (0.1 L to 0.85 L) compared with the placebo group, median ‐0.1 L (‐1.15 L to 0.24 L) (P = 0.006). Hanssens reported no difference in lung function (FEV1% predicted) between groups (Hanssens 2016). Keen also reported no difference in lung function (measure not specified) (Keen 2010).
b. FVC
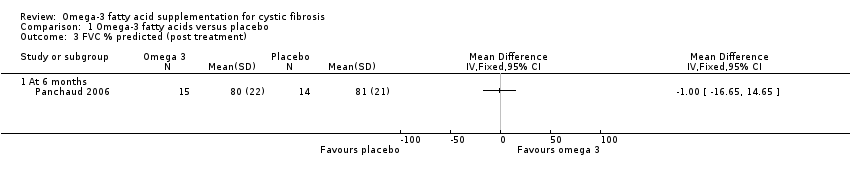
There were no differences in FVC % predicted reported in the cross‐over Panchaud study (n = 16) at six months (Panchaud 2006), MD ‐1.00 (95% CI ‐16.65 to 14.65) (Analysis 1.3) (very low‐quality evidence from this study at this time‐point).
Lawrence (n = 16) also reported a significant rise in FVC (L) in the EPA group, median 0.6 L (‐0.1 L to 0.75 L) compared with placebo, median 0.0 L (‐0.15 L to 0.35 L) (P = 0.011) (Lawrence 1993). Hanssens reported no difference in lung function (FVC % predicted) between groups (Hanssens 2016). Keen reported no difference in lung function (measure not specified) (Keen 2010).
Secondary outcomes
1. Quality of life
This outcome was not measured in any of the studies.
2. Number of deaths
No deaths occurred in any of the studies (Hanssens 2016; Henderson 1994; Keen 2010; Lawrence 1993; Panchaud 2006).
3. Clinical variables
The Shwachman score is an overall clinical scoring system in CF, when an increase in the score indicates improvement in clinical conditions (Shwachman 1958). Lawrence reported a significant increase in Shwachman score in the EPA group, median (range) increase 5% (‐10% to 20%) compared with the placebo group, median (range) increase 0% (‐10% to 0%) (P = 0.034) (Lawrence 1993).
Nutritional parameters were recorded in four studies as exploratory outcomes (Hanssens 2016; Keen 2010; Lawrence 1993; Panchaud 2006).
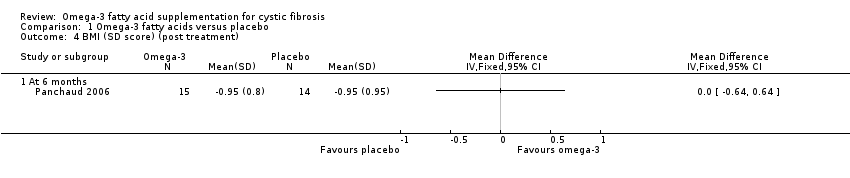
The cross‐over Panchaud study (n = 15) reported a body mass index (BMI) SD score using the nine centiles for BMI in British girls and boys as normal values and their associated co‐efficient of variation (Panchaud 2006). There was no significant difference between the PUFA group and the placebo group after six months, MD 0.00 (95% CI ‐0.64 to 0.64) (Analysis 1.4) (very low‐quality evidence from this study at this time‐point).
Two studies reported the median (range) change in weight (kg) which did not allow us to include the data in a meta‐analysis (Keen 2010; Lawrence 1993). Keen (n = 45) reported that at three months the median (range) change in weight in the supplement group was 1.75 kg (0.0 to 3.5; P = 0.001) and in the placebo group 1.0 kg (‐2.0 to 5.5; P = 0.004) (Keen 2010). Lawrence (n = 19) reported the median (range) change in weight at six months of 1.0 kg (‐1.0 to 3.0) in the supplement group and 0.0 kg (‐1.0 to 3.0) in the placebo group (P = 0.290) (Lawrence 1993). A further study (n = 15) reported that all participants exhibited low BMI z scores at baseline and these scores remained stable throughout the study (Hanssens 2016).
One study reported a median (range) reduction in sputum volumes in the treatment group ‐10 mL (‐50 mL to ‐5 mL) compared with placebo 0 mL (0 mL to ‐10 mL) (Lawrence 1993).
4. Bronchial responsiveness
This outcome was not measured in any of the studies.
5. Biochemical markers of essential fatty acid status
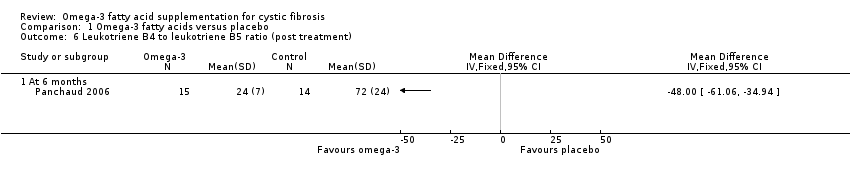
Panchaud (n = 15) reported a higher EPA content of the neutrophil membrane in the omega‐3 PUFA‐supplemented group compared to the placebo group, MD 0.90 (95% CI 0.46 to 1.34) (Analysis 1.5). However, no difference was observed in DHA membrane concentration between the study groups, MD 0.10 (95% CI ‐0.45 to 0.65) (Panchaud 2006) (Analysis 1.5) (very low‐quality evidence from this study at this time‐point). The leukotriene B4 to leukotriene B5 ratio was lower at six months in the omega‐3 PUFA‐supplemented group compared to placebo, MD ‐48.00 (95% CI ‐61.06 to ‐34.94) (Panchaud 2006) (Analysis 1.6).
Keen (n = 35) reported means and standard errors (which we converted to SDs to allow analysis in RevMan) on the change from baseline in EPA and DHA content of serum phospholipids and the n6 to n3 ratio (Keen 2010). There was a significant increase from baseline in both EPA and DHA content of serum phospholipids in the omega‐3 supplemented group compared to placebo, MD 0.70 (95% CI 0.42 to 0.98) and MD 1.10 (95% CI 0.39 to 1.81) respectively (Analysis 1.7). There was also a significant decrease in n‐6/n‐3 ratio in the omega‐3 group compared to placebo, MD ‐1.42 (95% CI ‐2.30 to ‐0.54) (Analysis 1.8). Further biochemical marker data were reported by Keen, but these were reported as medians and ranges which we were not able to analyse in RevMan. Investigators reported the change from baseline in the inflammatory markers, ESR and IL‐8. At three months, ESR decreased significantly in the supplement group from a median (range) of 7 mm/h (3 to 26) at baseline to 6 mm/h (3 to 25) (P = 0.05). Similarly, at the same time‐point, the paper reports a significant decrease of IL‐8 in the supplemented group, but a lack of data for the placebo group allowed no comparison to be made (Keen 2010).
Hanssens reported a greater increase in the essential fatty acid profile in the treatment arm compared to placebo, but no data were available for analysis (Hanssens 2016). In the placebo group values remained stable, but after three months supplementation with omega‐3 increased erythrocyte levels of EPA (4.2 fold, P < 0.025) and DHA (1.6 fold, P < 0.05). Further increases of EPA (4.2 fold, P < 0.02) and DHA (1.9 fold, P < 0.05) were seen at six months, but no further increases were seen at 12 months (Hanssens 2016). Levels of AA decreased at three months (1.2 fold, P < 0.05) and six months (1.3 fold, P < 0.01) with a further decrease (3.5 fold, P < 0.01) seen at 12 months (Hanssens 2016).
Discussion
The most notable feature highlighted by this review was the lack of data for many of the outcomes likely to be meaningful to people with or making treatment decisions about CF. Information was limited on a number of the primary outcomes that we would have expected to find in a RCT. Across all outcomes the quality of the evidence was judged to be very low, meaning we are very uncertain whether the effects seen were due to supplementation or not.
Summary of main results
Five studies with a total of 106 participants were included in the review, but these were heterogeneous in design and duration. Three had a parallel design (Hanssens 2016; Henderson 1994; Keen 2010) and two were of cross‐over design (Lawrence 1993; Panchaud 2006). They all administered a form of omega‐3 supplementation; two studies compared this to olive oil and three to placebo. The duration of the studies lasted from six weeks to 12 months. Data were not consistently reported in a form we were able to analyse and the results we were able to present did not show consistent effects across studies.
Two studies reported on the number of pulmonary exacerbations, the review's first primary outcome, but we could not analyse the results in this review (Hanssens 2016; Keen 2010). At three months one study reported no difference in antibiotic use during the study period compared with a similar time period in the previous year (Keen 2010). The second study reported a reduction in the median (range) number of respiratory exacerbations in the treatment group compared to the 12 months prior to study begin, but did not report data for the control group (Hanssens 2016). The same study reported a greater decrease in the mean (range) cumulative number of days of antibiotic therapy (IV and oral) in the treatment group compared to the control group at both nine and 12 months (Hanssens 2016).
Few adverse events were seen with omega‐3 supplementation (Hanssens 2016; Henderson 1994; Keen 2010; Lawrence 1993; Panchaud 2006). Increased steatorrhoea was reported by one study which led to participants needing to increase their daily dose of pancreatic enzymes (Henderson 1994); but it should be noted that three further studies increased pancreatic enzyme dose prior to study begin in order to avoid steatorrhoea (Hanssens 2016; Keen 2010; Lawrence 1993). One study reported no difference between groups in incidences of diarrhoea (Henderson 1994). Three asthma exacerbations were reported by one study (one in the supplement group and two from the control group) (Lawrence 1993). Stomach pains in five participants were reported in one thee‐month study, but it was not specified in which group these occurred (Keen 2010).
Four studies reported on lung function (Hanssens 2016; Keen 2010; Lawrence 1993; Panchaud 2006), but only one cross‐over study reported data we were able to analyse (Panchaud 2006). One study reported a significant increase in FEV1 (L) in the supplement group compared to placebo at six weeks (Lawrence 1993), but two studies showed no difference between treatment and control groups in FEV1 % predicted at six months (Analysis 1.2; Panchaud 2006) or at one year (narrative only, no data presented) (Hanssens 2016). The six‐week study also reported an increase in FVC (L) in the supplement group compared with placebo (Lawrence 1993), but again this was not reflected in results for FVC % predicted at six months (Analysis 1.3; Panchaud 2006) or at one year (no data presented) (Hanssens 2016). A fourth study also reported no change in lung function (at three months), but the unit of measurement was not specified (Keen 2010).
With regards to the review's secondary outcomes, no deaths were reported in any of the five studies and quality of life and bronchial responsiveness were not reported by any study.
Each study reported different clinical variables. One study reported improved median Schwachman scores and reduced sputum volumes with supplementation compared to placebo at three months (Lawrence 1993). This study also reported no difference between groups in the median change in weight (kg) at six weeks (Lawrence 1993); however, a further study reported a greater median increase in weight (kg) in the supplement group at three months (Keen 2010). At six months, the cross‐over study showed no difference between groups in BMI SD score (Analysis 1.4; Panchaud 2006); this was also true for BMI z score as reported narratively at 12 months (Hanssens 2016).
Three studies reported on biochemical markers of essential fatty acid status (Hanssens 2016; Keen 2010; Panchaud 2006). At three months in the omega‐3 group compared to placebo, Keen showed an increase from baseline in both EPA and DHA content of serum phospholipids (Analysis 1.7) and also a significant decrease in n‐6/n‐3 ratio (Analysis 1.8). Data from this study also showed significant median decreases in ESR and IL‐8 in the supplement group at three months, but there were no data for the placebo group (Keen 2010). At six months the cross‐over Panchaud study showed a higher EPA content of the neutrophil membrane in the supplement group compared to the placebo group, but no difference in DHA membrane concentration (Analysis 1.5); furthermore, the leukotriene B4 to leukotriene B5 ratio was lower at six months in the omega‐3 group compared to placebo (Analysis 1.6). The one‐year study reported a greater increase in the essential fatty acid profile and a decrease in AA levels in the treatment arm compared to placebo; however, P values were only presented for within‐group data for the supplement group and no data for the placebo group (Hanssens 2016).
Overall completeness and applicability of evidence
The included trials recruited children and adults with CF, although sample sizes were small. The participants were mixed in terms of both gender and age. It is important to note that the effect of omega‐3 supplementation on children under five years of age was not studied in these studies.
The dose of both EPA and DHA varied considerably across the studies with DHA doses ranging from 100 mg to 2.21 g and EPA doses ranging from 150 mg to 2.7 g. One study calculated the dose of omega‐3 supplementation based on the participant's weight. The differences in dose of omega‐3 and differences in the placebo used, mean that we are unable to use these RCTs to make a generalisable finding for people with CF.
Quality of the evidence
The evidence from the studies included in this review was difficult to appraise due to very low participant numbers, low event rates and limited reporting. We judged the quality of the evidence from the studies for all five outcomes to be very low (summary of findings Table for the main comparison). There was inconsistency in the weight indices measured and time‐points across the studies. Meaurements of EPA and DHA varied varied considerably across studies. Findings for pulmonary exacerbations were presented as median data without full ranges compared to placebo. Other references to pulmonary exacerbation rates were noted, but failed to provide data on the changes. Analysis of data related to FEV1 % predicted and FVC % predicted was limited with small sample sizes and limited reporting of data. The risk of bias was unclear across several domains including randomisation, allocation concealment, incomplete outcome assessment and selective reporting
Potential biases in the review process
We conducted a comprehensive literature search of online journal databases using the Cystic Fibrosis and Genetic Disorders Review Group’s Cystic Fibrosis Trials Register and also of journal conference abstracts with no restriction on publication status or language of potentially eligible studies. Although an exhaustive and comprehensive search was conducted, there is an inherent risk that studies may have been missed. Two authors independently applied the inclusion and exclusion criteria to the identified studies and excluded studies that were not relevant. Included studies were appraised for bias and data was extracted using a pre‐determined form according to the previously published review. Where disagreements existed, these were solved through mutual agreement from the authors after discussion Neither of the authors have received direct or indirect payments from the companies responsible for the development of any agents included in this review. This review has assessed all available published study data. Study authors were contacted for relevant unpublished information and individual participant data. Where unpublished data have been used, this has been noted in the review.
Agreements and disagreements with other studies or reviews
At present, we are unaware of any recently published data available about the effects of long‐term supplementation or appropriate dosage of omega‐3 fatty acids. Current nutritional management guidelines for CF do not recommend routine supplementation with omega‐3 fatty acids (CF Trust 2016).

Study flow (PRISMA) diagram
Risk of bias summary: review authors' judgements about each risk of bias item for each included study.

Comparison 1 Omega‐3 fatty acids versus placebo, Outcome 1 Adverse events.

Comparison 1 Omega‐3 fatty acids versus placebo, Outcome 2 FEV1 % predicted (post‐treatment).
Comparison 1 Omega‐3 fatty acids versus placebo, Outcome 3 FVC % predicted (post treatment).
Comparison 1 Omega‐3 fatty acids versus placebo, Outcome 4 BMI (SD score) (post treatment).

Comparison 1 Omega‐3 fatty acids versus placebo, Outcome 5 EPA and DHA % content of neutrophil membrane (post treatment).
Comparison 1 Omega‐3 fatty acids versus placebo, Outcome 6 Leukotriene B4 to leukotriene B5 ratio (post treatment).

Comparison 1 Omega‐3 fatty acids versus placebo, Outcome 7 EPA and DHA content of serum phospholipids (change from baseline).
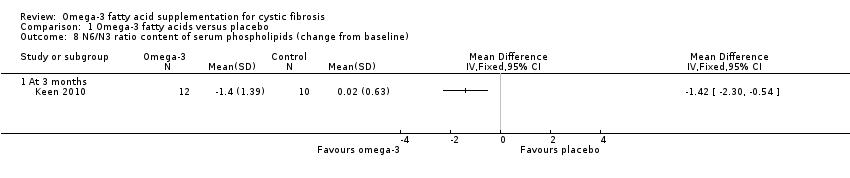
Comparison 1 Omega‐3 fatty acids versus placebo, Outcome 8 N6/N3 ratio content of serum phospholipids (change from baseline).
| Omega‐3 fatty acid supplementation compared with placebo for cystic fibrosis | ||||||
| Patient or population: children and adults with cystic fibrosis Settings: outpatients Intervention: oral omega‐3 supplementation (EPA or DHA, or both) Comparison: placebo | ||||||
| Outcomes | Illustrative comparative risks* (95% CI) | Relative effect | No of Participants | Quality of the evidence | Comments | |
| Assumed risk | Corresponding risk | |||||
| Placebo | Omega‐3 supplementation | |||||
| Number of pulmonary exacerbations (median number of exacerbations during the study) Follow‐up: 12 months | The number of exacerbations in the placebo group was greater than in the omega‐3 group (3.5 versus 1.7 (range 1 ‐ 3)). | N/A | 13 | ⊕⊝⊝⊝ | The authors only report the number of exacerbations in the supplemented group compared to the 12 months prior to the trial. Extra data was provided by the study authors to allow a between group comparison. This outcome was not included in the study protocol. | |
| Adverse events: diarrhoea Follow‐up: 6 weeks | 1 study reported drop out due to diarrhoea. 2 out of 7 participants in the fish oil group dropped out and 2 out of 5 participants in the placebo group, OR 0.6 (0.05 to 6.79). | OR 0.6 (0.05 to 6.79) | 12 | ⊕⊝⊝⊝ | Other adverse events included stomach pains (5/35 participants) but the intervention arm wasn't specified (Keen 2010). | |
| FEV1 % predicted Follow‐up: 6 months | The mean FEV1 % predicted was 64% in the control group. | The mean FEV1 % predicted in the intervention group was 2% higher (19.1% lower to 23.11% higher) | MD 2.00 (19.11 to 23.11) | 17 | ⊕⊝⊝⊝ | A further study (n = 16) reported a significant increase from baseline in the EPA group compared to the control group measured in L compared to the placebo group (P = 0.06) (Lawrence 1993). Two studies reported no difference in FEV1 % predicted or lung function (measurement not stated) between groups (Hanssens 2016; Keen 2010) |
| FVC % predicted Follow‐up: 6 months | The mean FVC % predicted in the control group was 81%. | The mean FVC % predicted in the intervention group was 1% lower (16.65 % lower to 14.65 % higher). | MD ‐1.00 (‐16.65 to 14.65) | 17 | ⊕⊝⊝⊝ | 1 study reported a significant rise in FVC (L) in the EPA group (P = 0.01) (Lawrence 1993). 2 studies reported no difference in FVC between groups, but no data were available for analysis (Hanssens 2016; Keen 2010). |
| Growth and nutrition: BMI SD score Follow‐up: 6 months | No significant difference was seen between the PUFA group and the placebo group after 6 months. | MD 0.00 (95 % CI ‐0.64 to 0.64) | 29 | ⊕⊝⊝⊝ | A further study reported on BMI but reported only that BMI z scores remained stable throughout the study (Hanssens 2016). | |
| Biochemical markers of essential fatty acid status: EPA and DHA % content of neutrophil membrane Follow‐up: 6 months | 1 study reported a higher EPA content of the neutrophil membrane in the omega‐3 PUFA‐supplemented group compared to the placebo group, MD 0.90 (95% CI 0.46 to 1.34). In the same study, no difference was observed in DHA membrane concentration between groups, MD 0.10 (95% CI ‐0.45 to 0.65) | 29 | ⊕⊝⊝⊝ | At 6 months, Keen reported a significant increase from baseline in both EPA and DHA content of serum phospholipids in the omega‐3 supplemented group compared to placebo, MD 0.70 (95% CI 0.42 to 0.98) and MD 1.10 (95% CI 0.39 to 1.81), respectively (Keen 2010). | ||
| *The basis for the assumed risk (e.g. the median control group risk across studies) is provided in footnotes. The corresponding risk (and its 95% confidence interval) is based on the assumed risk in the comparison group and the relative effect of the intervention (and its 95% CI). | ||||||
| GRADE Working Group grades of evidence | ||||||
| aDowngraded twice due to risk of bias within the included study for this outcome. There was uncertainty around allocation concealment and blinding and a high risk of bias due to selective reporting. bDowngraded once due to imprecision from very low participant numbers and low event rates. cDowngraded once due to risk of bias within the included study. It was unclear whether allocation was concealed and whether the outcomes were predefined as there was no protocol available. dDowngraded twice due to very low participant numbers (n = 12) and low event rates. eDowngraded twice due to risk of bias within the trial. The risk of bias was unclear across several domains including; randomisation, allocation concealment, incomplete outcome assessment and selective reporting. | ||||||
| Outcome or subgroup title | No. of studies | No. of participants | Statistical method | Effect size |
| 1 Adverse events Show forest plot | 1 | Odds Ratio (M‐H, Fixed, 95% CI) | Totals not selected | |
| 1.1 Diarrhoea and eructation | 1 | Odds Ratio (M‐H, Fixed, 95% CI) | 0.0 [0.0, 0.0] | |
| 2 FEV1 % predicted (post‐treatment) Show forest plot | 1 | Mean Difference (IV, Fixed, 95% CI) | Totals not selected | |
| 2.1 At 6 months | 1 | Mean Difference (IV, Fixed, 95% CI) | 0.0 [0.0, 0.0] | |
| 3 FVC % predicted (post treatment) Show forest plot | 1 | Mean Difference (IV, Fixed, 95% CI) | Totals not selected | |
| 3.1 At 6 months | 1 | Mean Difference (IV, Fixed, 95% CI) | 0.0 [0.0, 0.0] | |
| 4 BMI (SD score) (post treatment) Show forest plot | 1 | Mean Difference (IV, Fixed, 95% CI) | Totals not selected | |
| 4.1 At 6 months | 1 | Mean Difference (IV, Fixed, 95% CI) | 0.0 [0.0, 0.0] | |
| 5 EPA and DHA % content of neutrophil membrane (post treatment) Show forest plot | 1 | Mean Difference (IV, Fixed, 95% CI) | Totals not selected | |
| 5.1 EPA at 6 months | 1 | Mean Difference (IV, Fixed, 95% CI) | 0.0 [0.0, 0.0] | |
| 5.2 DHA at 6 months | 1 | Mean Difference (IV, Fixed, 95% CI) | 0.0 [0.0, 0.0] | |
| 6 Leukotriene B4 to leukotriene B5 ratio (post treatment) Show forest plot | 1 | Mean Difference (IV, Fixed, 95% CI) | Totals not selected | |
| 6.1 At 6 months | 1 | Mean Difference (IV, Fixed, 95% CI) | 0.0 [0.0, 0.0] | |
| 7 EPA and DHA content of serum phospholipids (change from baseline) Show forest plot | 1 | Mean Difference (IV, Fixed, 95% CI) | Totals not selected | |
| 7.1 EPA At 6 months | 1 | Mean Difference (IV, Fixed, 95% CI) | 0.0 [0.0, 0.0] | |
| 7.2 DHA at 6 months | 1 | Mean Difference (IV, Fixed, 95% CI) | 0.0 [0.0, 0.0] | |
| 8 N6/N3 ratio content of serum phospholipids (change from baseline) Show forest plot | 1 | Mean Difference (IV, Fixed, 95% CI) | Totals not selected | |
| 8.1 At 3 months | 1 | Mean Difference (IV, Fixed, 95% CI) | 0.0 [0.0, 0.0] | |