Multidisziplinäre biopsychosoziale Rehabilitationsprogramme bei subakuten Kreuzschmerzen
Referencias
References to studies included in this review
References to studies excluded from this review
References to studies awaiting assessment
References to ongoing studies
Additional references
References to other published versions of this review
Characteristics of studies
Characteristics of included studies [ordered by study ID]
| Methods | RCT. The study was conducted between October 2000 and October 2003. | |
| Participants | Nonspecific LBP, full or partial sick leave due to nonspecific LBP lasting 2 to 6 weeks, age between 18 and 65 years, and able to give written informed consent and to complete written questionnaires in Dutch. The trial was conducted in the Netherlands. It was designed to replicate the Canadian study by Loisel 1997 (also included). *Baseline symptom intensity for control group: Mean pain was 6.3 (1.7) on VAS (0 to 10) and mean functional status was 13.8 (4.6) on Functional Status RDQ (0 to 24); LOWER symptom intensity | |
| Interventions | Intervention = Usual care + workplace intervention + graded activity The workplace intervention took place directly after inclusion. Participants still sick listed at 8 weeks were randomised for graded activity. Note: Only the combination of workplace and graded activity interventions meets our criteria for multidisciplinary. Twenty‐seven participants received the combined intervention. Workplace: n = 96, mean age (SD) = 44 (8.6), 45% female. Worksite assessment and work adjustments, based on methods used in participatory ergonomics. Included an ergonomist (process leader), the injured worker, the worker's supervisor, and possible other stakeholders. Graded activity: n = 55, mean age (SD) = 41.3 (9.2), 36% female. Individual, submaximal, gradually increasing exercise program with an operant‐conditioning behavioral approach. Physiotherapist acted as a coach and supervisor, using a hands‐off approach. *The entire program consisted of two 1‐hour sessions a week, with 26 sessions maximally (13 weeks) = low intensity. Comparison = Heterogeneous group (usual care, workplace intervention only and graded activity only) After first randomizations to workplace or usual care. Usual care group 1: n = 100, age (SD) = 41.2 (10.7), 67% female. After second randomizations to graded activity or usual care. Usual care group 2: n = 57, age (SD) = 43.4 (8.3), 54% female. Usual care: The Dutch occupational guideline on LBP advises for nonspecific LBP: Education about the good prognosis and the importance of keeping up or returning to normal activities; coping with low back pain, fear of movement, and a plan for the resumption of normal activities; advice to return‐to‐work within 2 weeks in the absence of further problems; a workplace visit by an occupational therapist or ergonomist is optional; the general practitioner, or any other medical specialist, is consulted if curative treatment is considered inappropriate. | |
| Outcomes | Return‐to‐work rate/time to return‐to‐work for workplace intervention, functional status (Roland‐Morris Disability Questionnaire, with higher scores indicating more severe disability), pain intensity. Follow‐up at 12, 26, and 52 weeks (primary at 52 weeks). Analyses compared those who received combined intervention to those who didn't receive the combined intervention (i.e. combination of workplace only, graded only, and usual care). Pain at one year: Difference in adjusted improvement over time in two groups 0.47 (‐0.42 to 1.35), NS Functional status (Roland‐Morris) at one year: Difference in adjusted improvement over time in two groups: 1.49 (‐0.33 to 3.31), NS Time to full return‐to‐work: Adjusted hazard ratio = 0.7 (95% CI, 0.3 to 1.2, P > 0.05) Adverse events: Not reported. | |
| Notes | Attrition: Workplace intervention = 0 lost to follow‐up. Usual care 1 = 0 lost to follow‐up. All analyses conducted according to ITT principles. 24 (12%), had no follow‐up data collected on secondary outcome measures (pain and function). Funding source/COIs of primary researchers: Federal funds were received in support of this work. No benefits in any form have been or will be received from a commercial party related directly or indirectly to the subject of this manuscript. Applicability: No concerns about generalisability of the data | |
| Risk of bias | ||
| Bias | Authors' judgement | Support for judgement |
| Random sequence generation (selection bias) | Low risk | Series of random numbers (Steenstra 2003 p. 3). |
| Allocation concealment (selection bias) | Low risk | Participants were only informed after they were allocated. |
| Blinding of participants (performance bias) | High risk | Not possible due to the nature of the intervention. |
| Blinding of personnel (performance bias) | High risk | Not possible due to the nature of the intervention. |
| Compliance (adherence) acceptable? (performance bias) | High risk | For graded activity, "19 workers out of 55 were not compliant". |
| Co‐interventions avoided or similar? (performance bias) | Low risk | Cointerventions were similar across groups. |
| Blinding of outcome assessment (detection bias) | Low risk | Return‐to‐work data from automated databases. |
| Blinding of outcome assessment (detection bias) | High risk | Blinding not possible due to nature of intervention: "blinding of self‐reported outcome measurements was not possible". |
| Timing of outcome assessment (measurement/detection bias) | Low risk | Outcomes measured at standard time points. |
| Incomplete outcome data (attrition bias) | Low risk | Sick leave data collected for all participants. Follow‐up data missing on secondary outcomes (pain and function) for 12% of participants. All analyses conducted according to ITT principle (Figure 1, p. 293) |
| Selective reporting (reporting bias) | Low risk | All outcomes described in methods were addressed in results. |
| Methods | RCT. The study was conducted between April 2004 and April 2006 in Vejle County, Denmark. This included recruitment and one‐year follow up. | |
| Participants | Study eligibility required participants to be absent from work for 4 to 12 weeks, to have a reimbursement request indicating LBP or musculoskeletal disorder as the main cause of sick leave, and to be between 18 and 65 years of age. Understanding and speaking Danish was also required. Note that sample was mixed with respect to pain location but > 80% reported LBP in both groups. *Baseline symptom intensity for control group: Mean pain was 6.04 (2.0) on 10‐point numerical rating scale and mean functional status was 66.21 (14.7) on 0 to 100 scale, where higher scores indicated a lower level of disability; LOWER symptom intensity | |
| Interventions | Intervention = Work disability screening plus rehabilitation plan n = 68, mean age (SD) = 44.2 (10.8), 48.5% female. Two main components: (1) a work disability screening: a systematic, multidisciplinary assessment of disability and functioning as well as the identification of barriers for RTW; and (2) the formulation and implementation of a co‐ordinated, tailored and action‐oriented work rehabilitation plan collaboratively developed by an interdisciplinary team using a feedback guided approach. The interdisciplinary team consisted of an occupational physician, an occupational physiotherapist, a chiropractor, a psychologist, and a social worker. *The duration of the intervention was for up to three months; insufficient information to categorize intervention intensity. Comparison = Conventional case management, as provided by municipality n = 51, mean age (SD) = 42.9 (11.9), 63.8% female. | |
| Outcomes | Registered sickness absence hours, functional disability (Oswestry Low Back Pain Disability Questionnaire, with lower scores indicating more severe disability*), initiatives and actions for RTW during the first 3 months of follow‐up, economic evaluation, work status. *Author note regarding Oswestry scale: "[We used] an inverted Oswestry with score 100 = normal functioning. The reason to do so was to focus on function and not on dysfunction (the rationale of the study and intervention) and to work with a combined function index (using all dimensions), with index 100 = normal function." Follow‐up at 3 and 12 months. The time intervals for the cumulated sickness absence hours were 0 to 3 months, 3 to 6 months, 6 to 12 months as well as 0 to 6 months and 0 to 12 months. Adverse events: Not reported. | |
| Notes | Attrition: 2 lost to follow‐up in intervention group and 4 lost to follow‐up in control group for primary outcome (sickness absence). For secondary outcomes (work status, pain intensity, and functional disability), 12 lost to follow‐up in intervention group and 21 lost to follow‐up in control group. Funding source/COIs of primary researchers: Kilsgaard is now the director of KIApro, an organization that develops and implements systematic programs for work rehabilitation in municipalities in Denmark. The present study was planned, designed, and performed while Kilsgaard was working at the Department of Development and Labor Market of Vejle County. Applicability: No concern about generalisability. | |
| Risk of bias | ||
| Bias | Authors' judgement | Support for judgement |
| Random sequence generation (selection bias) | Low risk | A randomisations protocol without stratification was computer‐generated prior to the start of the study and was undertaken by an independent information technology assistant. |
| Allocation concealment (selection bias) | Low risk | See above. |
| Blinding of participants (performance bias) | High risk | Not possible due to the nature of the intervention. |
| Blinding of personnel (performance bias) | High risk | Not possible due to the nature of the intervention. |
| Compliance (adherence) acceptable? (performance bias) | Low risk | No participants that started the intervention discontinued it. "All participants allocated to Coordinated and Tailored Work Rehabilitation underwent the multidisciplinary assessment and received a co‐ordinated, tailored, and action‐oriented RTW plan" (p. 86). |
| Co‐interventions avoided or similar? (performance bias) | Low risk | Any cointerventions were similar. |
| Blinding of outcome assessment (detection bias) | Low risk | Administration data on cumulative sickness hours used. |
| Blinding of outcome assessment (detection bias) | High risk | Participant was outcome assessor. Blinding not possible because of the nature of the intervention. |
| Timing of outcome assessment (measurement/detection bias) | Low risk | Outcomes measured at standard time points. |
| Incomplete outcome data (attrition bias) | Unclear risk | Administration data: all 66 participants who received the intervention (of 68 randomised) and 47 of control group (of 51 randomised to this condition) had complete data on sickness absence. For work status, pain intensity, and functional disability, intervention group 54 of 66 and control group 26 of 47 had complete data at 12 months. ITT not used. |
| Selective reporting (reporting bias) | Low risk | All outcomes described in methods were presented in results. |
| Methods | RCT. Participants were recruited from May to November 2009 (Hiebert 2012). | |
| Participants | Active duty service members were eligible if they were seeking care for LBP at Sewells Point Branch Medical Clinic in Norfolk, Virginia. Must be classified as nonspecific LBP by Primary Care Manager that interfered with normal work or life for a period of between 4 and 12 weeks. *Baseline symptom intensity for control group: Mean pain was 4.5 (2.3) on a 10‐point numerical rating scale and mean functional status was 24.3 (10.5) on scale ranging from 0 to 100%; LOWER symptom intensity | |
| Interventions | Intervention = Physical reconditioning plus CBT with back‐to‐work focus n = 16, mean age (SD) = 33.1 (6.6), 12.5% female. Backs to Work was a co‐ordinated multidisciplinary, reconditioning program conducted by physical therapists, a psychologist, and a physician. The physical component was a graded, goal‐oriented active physical reconditioning program that included aerobic conditioning, strength training, and flexibility exercises. The psychological component included an evaluation by a psychologist to rule out psychopathology and substance abuse. CBT treatment included education about how psychosocial variables affect pain, relaxation training, modification of maladaptive beliefs and problem solving. *The duration of the intervention was 3 hours per day, 3 days/week for 4 weeks = 36 hours = mid‐intensity. Comparison = Usual Care n = 17, mean age (SD) = 32 (7.2), 5.9% female. Treatment at discretion of Primary Care Manager. Treatment conducted 2 to 3 times a week at a Sports Medicine or Chiropractic Clinic and included one or more of the following: modalities (ultrasound, heat, ice, and electrical stimulation), traction, exercises, back class, spinal manipulation. The control group did not undergo psychological examination. | |
| Outcomes | Return to duty, pain, pain catastrophising, perceived disability (Oswestry, with higher scores indicating more severe disability), depression (CES‐D), fear of physical activity, functional performance (e.g. active trunk range of motion). Participants were followed up at 4 and 12 weeks. Means (SDs) for secondary outcomes at 12 weeks Pain catastrophising: MBR = 3.0 (3.7), usual care = 8.3 (7.9), NS. Depression: MBR = 4.4 (4.3), usual care = 8.4 (7.4), NS. Fear of physical activity (FABQ physical score): MBR = 5.7 (5.6), usual care = 10.7 (7.3), NS. Fear of physical activity (FABQ work score): MBR = 7.3 (4.9), usual care = 10.8 (9.1), NS. Adverse events: Not reported. | |
| Notes | Attrition Intervention group: n = 7 (3 excluded and 4 dropped out). A total of 9 completed follow‐up. Control group: n = 5 (1 dropout and 4 lost to follow‐up). A total of 12 completed follow up. Funding source and/or COIs of primary researchers: This study was sponsored by Navy & Marine Corps Public Health Centre, funded by the Assistant Secretary of the Army for Installations and Environment, and managed by Batelle. Applicability: Mainly male active duty service members. | |
| Risk of bias | ||
| Bias | Authors' judgement | Support for judgement |
| Random sequence generation (selection bias) | Unclear risk | Method of randomisations not reported. |
| Allocation concealment (selection bias) | Unclear risk | Not reported in text. |
| Blinding of participants (performance bias) | High risk | Not possible due to nature of study. |
| Blinding of personnel (performance bias) | High risk | Not possible due to nature of study. |
| Compliance (adherence) acceptable? (performance bias) | Unclear risk | Not reported and unable to ascertain. |
| Co‐interventions avoided or similar? (performance bias) | Low risk | No indication of cointerventions. |
| Blinding of outcome assessment (detection bias) | Unclear risk | Duty status was recorded by the subject's Primary Care Manager at each clinical encounter and abstracted from the subject's electronic medical record. |
| Blinding of outcome assessment (detection bias) | High risk | Participant was outcome assessor. Blinding not possible because of the nature of the intervention. |
| Timing of outcome assessment (measurement/detection bias) | Low risk | Outcomes measured at standard time points. |
| Incomplete outcome data (attrition bias) | High risk | Loss of over 30% in intervention group. Dropouts reported, but problematic because of small sample size. ITT approach used but did not mitigate loss to follow‐up. |
| Selective reporting (reporting bias) | Low risk | All outcomes described in methods were presented in results. |
| Methods | RCT. Participants were referred to the study from November 2004 through June 2007. | |
| Participants | General practitioners in 4 municipalities with a total of 240,000 citizens received written information about the project. The general practitioners were encouraged to refer participants to the study at the Research Unit of the Spine Centre, Regional Hospital Silkeborg, Denmark, if the participants were aged 16 to 60 years and partly or fully sick‐listed from work for 4 to 12 weeks because of LBP. The first visit at the Spine Centre was not always possible within this time frame, and consequently the duration of sick leave ranged from 3 to 16 weeks at the time of inclusion. *Baseline symptom intensity for control group: Mean pain was 32.7 (12.4) on LBP rating scale 0 to 60 and mean functional status was 15.6 (5.2) on Roland‐Morris disability scale ranging from 0 to 23; LOWER symptom intensity. Exclusion: The participants were not enrolled in the study if they were unemployed, had continuing or progressive signs or symptoms of nerve root affection implicating plans for surgery, had low back surgery within the last year or specific back diseases, (e.g. tumour), were pregnant, had known dependency on drugs or alcohol, or had any primary psychiatric disease. | |
| Interventions | Intervention = Brief clinical intervention + multidisciplinary intervention n = 176, mean age (SD) = 42.1 (10.5), 54% female. Brief clinical intervention: A standard clinical LBP examination was carried out by the physician, relevant imaging and examinations were ordered, and treatment options were discussed. Information was given in a reassuring way and medical pain management was adjusted. The participants were advised to resume work when possible. The physiotherapy examination included a standardized, mechanical evaluation, and advice on exercise was chosen accordingly. General advice was given to increase physical activity and exercise. For all participants, a follow‐up visit at the physiotherapist was scheduled 2 weeks later, and a follow‐up visit at the physician was arranged for participants needing answers in relation to test results. *The duration of the intervention was 18 weeks, average of 4 meetings with case manager = low intensity. Comparison = Other intervention (brief clinical intervention alone ‐ see above) n = 175, mean age (SD) = 41.9 (10.4), 50.3% female. | |
| Outcomes | Return‐to‐work (defined as first 4‐week period within the first year after inclusion, during which the participant received no social transfer payments), pain, disability (Roland‐Morris, with higher scores indicating more severe disability), fear avoidance, and physical functioning. All SF‐36 subscales (role‐physical, bodily pain, general health, vitality, social functioning, role‐emotional, mental health). Participants were followed up at one year. Return‐to‐work (median time until RTW) I = 18 weeks. C = 14 weeks. Unadjusted HR = 0.83 (95% CI 0.65 to 1.06), P = 0.14. Results for secondary outcomes at 12 months Fear avoidance (Orebro) (n = 237): I = 16.0 (8.5), C = 16.1 (8.1), P = 0.91. Physical functioning subscale (SF‐36, higher numbers indicated better health) (n = 244): I = 70.3 (22.0), C = 70.6 (23.2), P = 0.43. Mental health subscale (SF‐36) (n = 243): I = 75.0 (19.8), C = 70.0 (20.3), P = 0.046. Adverse events: Not reported. | |
| Notes | Attrition Intervention: 5 did not receive allocated intervention due to cancer diagnosis (n = 1), or unwillingness to continue after clinical examination (n = 4). Follow‐up questionnaires not answered by 47. Comparison: 2 did not receive allocated intervention due to cancer diagnosis (n = 1) or age (61 years, n = 1). Follow‐up questionnaire not answered by 53. Funding source/COIs of primary researchers: "No benefits in any form have been or will be received from a commercial party related directly or indirectly to the subject of this manuscript." Supported by the Danish Working Environment Research Fund. Applicability: No concerns about generalisability of the data. | |
| Risk of bias | ||
| Bias | Authors' judgement | Support for judgement |
| Random sequence generation (selection bias) | Low risk | A secretary phoned a computer generating an automatic voice response on the basis of block randomizations designed by a data management unit at another hospital. |
| Allocation concealment (selection bias) | Low risk | Yes, it was done off site. |
| Blinding of participants (performance bias) | High risk | Participants were aware of result of randomizations. |
| Blinding of personnel (performance bias) | High risk | Personnel were aware of results of randomizations. |
| Compliance (adherence) acceptable? (performance bias) | Unclear risk | Information provided regarding frequency of contact in MBR group: "Meetings with workplace representatives were arranged with 54 participants and the case manager contacted employers directly in 33 other cases. For these 87 cases, the case manager was in contact with workplace representatives 6 times on average" (p. 1186). However, compliance with other aspects of the treatment was not reported. |
| Co‐interventions avoided or similar? (performance bias) | Low risk | There was no indication of cointerventions. |
| Blinding of outcome assessment (detection bias) | Low risk | Data on sick leave to estimate time to RTW were drawn from national registers. |
| Blinding of outcome assessment (detection bias) | High risk | Participant was outcome assessor. Blinding not possible because of the nature of the intervention. |
| Timing of outcome assessment (measurement/detection bias) | Low risk | Yes, survival analysis and standard follow‐up time. |
| Incomplete outcome data (attrition bias) | Unclear risk | RTW: Dropouts were described in detail. Self‐report outcomes at one‐year follow up: Large portion failed to answer follow up questionnaire: 47 of 176 in intervention group and 53 of 175 in control ITT not used |
| Selective reporting (reporting bias) | Low risk | All outcomes described in methods were presented in results. |
| Methods | RCT. Participants enrolled in study between August 1998 and May 2000. | |
| Participants | Participants were recruited from clinics in the Helsinki metropolitan area. Inclusion criteria 25 to 60‐year‐old employees with current daily low back pain (with or without sciatica), which had made working difficult for 4 weeks but less than 3 months. *Baseline symptom intensity for control group: Mean pain was 5.7 on 0 to 10 rating scale and mean functional status was 34 on Oswestry (% of maximum score of 45); LOWER symptom intensity | |
| Interventions | A total of 164 participants with subacute low back pain were randomised to a mini‐intervention group (A), a worksite visit group (B), or a usual care group (C). Groups A (n = 56) and B (n = 51) underwent one assessment by a physician plus a physiotherapist. Group B received a worksite visit in addition. Group C served as a control group (n = 57) and was treated in municipal primary health care. All participants received a leaflet on back pain. Intervention of interest = Worksite visit group n = 51, mean age = 44 (25 to 60), 57% female. Intervention by the physicians and the physiotherapist was identical to that in the mini‐intervention group and performed without knowledge of final group assignment. The physiotherapist visited the participant's work site, along with the participant's work supervisor and company nurse, and physician. The aim of the visit, which lasted for approximately 75 minutes, was to ensure that the participant had adapted to the information and practical instructions of appropriate ways of using the back at work, to involve the supervisor and company health care professionals, and to encourage their cooperation. Comparison 1 = Mini intervention alone n = 56, mean age = 44 (25 to 60), 59% female. A physician specializing in physiatry first interviewed and examined the participants in the mini‐intervention group and encouraged them to ask anything unclear about their back pain. Working conditions were discussed and the results of the clinical examination explained to the participant and the radiograph findings and causes of pain clarified, as far as possible. The main aim of these consultations was to reduce the participants' concerns about their back pain by providing accurate information and to encourage physical activity. The physiotherapist instructed the participant no more than five exercises for improving the function of deep abdominal muscles and establishing symmetric use of the back. Other daily exercises were planned that were feasible enough for the participant to commit to and execute them. The aim of this approximately 1.5‐hour session was to increase body control and exercising in everyday life. *The duration of the mini intervention was 1.25 to 1.5 hours and the worksite visit was approximately 75 minutes = low intensity. Comparison 2 = Usual care n = 57, mean age = 43 (25 to 59), 60% female. Participants in the usual care group were not examined at FIOH but did receive a leaflet on back pain (as did all other study participants). They were treated by their GPs in primary health care in the usual manner, including specialist consultations and physiotherapy, when necessary. They were not restricted from seeking specialist treatment privately, i.e. at their own expense if they so wished. | |
| Outcomes | Intensity of pain, daily symptoms, frequency and bothersomeness of pain, interference of pain with daily life, disability (Oswestry, with higher scores indicating more severe disability), specific and generic health‐related quality of life, satisfaction with care, days on sick leave, and use and costs of health care consumption. Participants were followed up at 3‐, 6‐, and 12‐months. MBR vs usual care between‐group differences for secondary outcomes: Quality of life, scale of 0.00 to 1.00, with higher scores indicating higher quality: 12 months: 0.00 (‐0.02 to 0.02), P = 0.834. 24 months: 0.003 (‐0.02 to 0.02), P = 0.802. Satisfaction with care: scale of 0 to 10, with higher scores indicating more satisfaction: 12 months: 2.0 (1.1 to 2.9), P < 0.00. 24 months: 2.0 (1.1 to 2.9), P = 0.00. Adverse events: Not reported. | |
| Notes | Attrition Mini intervention and worksite visit groups: No participants lost to follow up. Comparison group: At 3 months, 1 participant lost to follow‐up. Funding source/COIs for primary researchers: "No benefits in any form have been or will be received from a commercial party related directly or indirectly to the subject of this manuscript". Applicability: No concerns about generalisability of the data. | |
| Risk of bias | ||
| Bias | Authors' judgement | Support for judgement |
| Random sequence generation (selection bias) | Low risk | Participants agreeing to participate were asked to complete baseline questionnaires at FIOH. The research nurse then randomised each participant into one of the three study groups; to ensure even distribution of participants regarding gender and age > 45 and < 45 years, four piles of sealed envelopes were used, and in each, the randomizations was done in blocks of 15. A biostatistician had prepared the order from a random number table. A secretary unconnected with the participants had numbered the envelopes sequentially to prevent their rearrangement. The research nurse and researchers were not aware of the block size and therefore could not predict the group assignments. |
| Allocation concealment (selection bias) | Low risk | See above. |
| Blinding of participants (performance bias) | High risk | Blinding not possible due to nature of design. |
| Blinding of personnel (performance bias) | High risk | Blinding not possible due to nature of design. |
| Compliance (adherence) acceptable? (performance bias) | Low risk | 49 of 51 participants received worksite visits (p. 537). |
| Co‐interventions avoided or similar? (performance bias) | Low risk | "Cointerventions, such as visits including the use of alternative medicine services, were equally distributed among the three groups". |
| Blinding of outcome assessment (detection bias) | High risk | Participant was outcome assessor and blinding not possible because of the nature of the intervention. |
| Timing of outcome assessment (measurement/detection bias) | Low risk | Outcomes measured at standard time points |
| Incomplete outcome data (attrition bias) | Low risk | All participants in each study group (except for one in the usual care group, who, without explanation, decided to withdraw from the study at the 3‐month follow‐up) were followed up by questionnaires 3, 6 and 12 months after randomizations. Participants were included in the analysis on the basis of their intervention group allocation. |
| Selective reporting (reporting bias) | Low risk | All outcomes described in methods were presented in results. |
| Methods | RCT. Participants were recruited from September 1 1991, to December 31 1993. | |
| Participants | Inclusion criteria for workplaces to participate in the study were: to have more than 175 employees and to be located within 30 km of the study site (Sherbrooke area, Quebec, Canada). Inclusion criteria for workers from these workplaces were: thoracic or lumbar back pain incurred at work that had caused an absence from work (or an assignment to light duties) for more than 4 weeks and less than 3 months, age from 18 to 65 years, and back pain accepted for compensation by the Québec Workers' Compensation Board. *Baseline symptom intensity for control group: Mean pain was 22.9 (14.2) on McGill Pain Questionnaire (0 to 78) and mean functional status was 29.8 (14.7) on Oswestry (% of maximum score of 45); LOWER symptom intensity. | |
| Interventions | Intervention = Occupational intervention plus graded activity n = 25, 60% female, mean age (SD) = 37.4 (8.1) Occupational The occupational intervention began after 6 weeks of absence from work and included participants' visits to an occupational physician and a participatory ergonomics evaluation conducted by an ergonomist. The occupational physician could recommend investigation or treatment or could try to set up light duties to help the participant return to usual tasks. The ergonomic intervention was a worksite evaluation that included union and employer representatives in determining the need for job modifications. Clinical intervention (graded activity) The clinical intervention included, after 8 weeks' absence from work, a visit to a back pain specialist and a school for back care education (back care school) and, after 12 weeks' absence, a multidisciplinary work rehabilitation intervention. The rehabilitation plan was a modified Mayer's intervention, including fitness development and work hardening with a cognitive‐behavioral approach. It ended with a progressive return‐to‐work, called therapeutic return‐to‐work, alternating days at the original job with progressively increased tasks and days receiving functional therapy. *In a previous study using the same protocol (Loisel 1994), the duration of functional rehabilitation therapy ranged from 2 to 13 weeks. No additional information reported on intervention intensity; insufficient information to categorize intervention intensity. Comparison = Usual care Usual care n = 26, 19.2 % female, mean age (SD) = 41.7 (10.0). Participants in the usual care group received treatment from their attending physician, who was at liberty to prescribe any test, treatment, or referral to a specialist for care. | |
| Outcomes | Time off work, time to return‐to‐work, functional status (Oswestry, with higher scores indicating more severe disability), pain level (McGill‐Melzack questionnaire), sickness impact profile. Follow‐ups at 12, 24, 52 weeks. The means and SDs reported below were extracted from the French report. Generic functional status (Sickness impact profile, higher scores = worse health) One year: I = 3.0 (7.4) C = 9.7 (7.5) Unadjusted mean difference at one‐year was ‐6.76 (adjusted mean difference was ‐4.41, P = 0.052) Time to return to regular work Median time off regular work (days) I = 60.0 C = 120.5 Unadjusted Cox hazard ratio was 2.11 (adjusted HR = 2.23, P = 0.037) *Note that original Cochrane Review focused on Comparison 3 from Table 3 (HR = 2.41). Adverse events: Not reported. | |
| Notes | *This study was included in the original version of the review. Attrition: Twelve workers (9%) did not respond to any follow‐up visit (nonparticipants) and were also distributed in the four groups. Hence, the comparative analyses were performed on 104 participants. The participants did not differ from the nonparticipants in gender, duration of absence from regular work, or clinical data, but the participants were older. Funding source/COIs for primary researchers: No information provided. Applicability: No concerns about generalisability of the data. | |
| Risk of bias | ||
| Bias | Authors' judgement | Support for judgement |
| Random sequence generation (selection bias) | Low risk | The first randomizations (at workplace level) was stratified according to activity sector and according to the number of employees. Eligible workers from all workplaces were successively randomised to receive (or not) the clinical intervention. For this randomizations, 500 random numbers were generated by a computer and were given the status yes or no for clinical and rehabilitation intervention. |
| Allocation concealment (selection bias) | Low risk | Each random number was placed in order of generation into envelopes numbered from 1 to 500. Envelopes were sealed , and the first 250 were distributed in successive order to the incoming eligible workers from the workplaces not receiving the occupational intervention. |
| Blinding of participants (performance bias) | High risk | Not possible due to nature of intervention. |
| Blinding of personnel (performance bias) | High risk | Not possible due to nature of intervention. |
| Compliance (adherence) acceptable? (performance bias) | Unclear risk | No information provided and unable to ascertain. |
| Co‐interventions avoided or similar? (performance bias) | Low risk | Any cointerventions similar across groups. |
| Blinding of outcome assessment (detection bias) | Low risk | For return‐to‐work outcomes: on page 2913 it stated that the evaluation/data analysis team had no contact with study site, worksites, or participants. |
| Blinding of outcome assessment (detection bias) | High risk | Participant was outcome assessor. Blinding not possible due to nature of intervention. |
| Timing of outcome assessment (measurement/detection bias) | Low risk | Used survival analysis, measured outcomes at standard times. |
| Incomplete outcome data (attrition bias) | Low risk | Dropouts described, small sample, but distributed across groups. No mention of ITT. |
| Selective reporting (reporting bias) | Low risk | All variables reported in methods and results. |
| Methods | RCT. The study was conducted in Germany. | |
| Participants | Participants were recruited through general practitioners and orthopaedic surgeons from 1998 to 1999. Inclusion criteria
*Baseline symptom intensity for control group: Mean pain was 5.28 (2.2) on a numeric rating scale (0 to 10) and mean functional status was 57.34 (23.7) on 0 to 100% scale, with higher scores indicating higher functioning; LOWER symptom intensity. | |
| Interventions | The interventions were based on inpatient rehabilitation programs in both treatment arms with respect to dosage and contents. Intervention = Biopsychosocial therapy (functional restoration plus psychotherapy) n = 31 (Table 1). Note: Figure 1 suggests that there were 33 allocated to biopsychosocial therapy group (this may be a reporting error) Mean age (range) = 34.9 (19 to 50), 48% female The conventional biomedical program included a functional restoration program of individual physiotherapy, workout, and back school and aimed at stretching, strengthening, improving mobility and body control. Passive interventions (massage and physical therapy) were added. The psychological component included specifically adapted psychotherapy three times per week and relaxation therapy four times per week. A professional psychotherapist performed this part of the treatment in a group and in an individual setting. Psychotherapy contained analysis of individual psychosocial factors and conflicts contributory to persistent low back pain, enhancement of participant’s understanding of the nature and function of their pain. Psychotherapy sessions also included psychoeducation. *The duration of the intervention was 6 h of daily treatment for 15 days in 3 weeks = mid‐intensity. Comparision = Other intervention n = 33 (Table 1). Note: Figure 1 suggests that there were 31 in biomedical group. Mean age (range) = 36.7 (20 to 48), 39% female. A functional restoration program of individual physiotherapy, group therapy in water, workout, and back school and aimed at stretching, strengthening, improving mobility and body control. Passive interventions (massage and physical therapy) were added. | |
| Outcomes | Pain intensity (numeric rating scale), functional capacity (Hannover Functional Status Questionnaire, with lower scores indicating more severe disability), depressive dysfunction (CES‐D), sick leave, clinical parameters. Participants were followed up at 3 weeks, 6 months, and 2 years (for sick leave data). Findings for secondary outcome: Depressive dysfunction (CES‐D 0 to 45) Changes since baseline Short‐term follow‐up (3 weeks): I = 2.40 (4.6), C = 3.74 (4.5). Intermediate follow‐up (6 months): I = 6.62 (7.5), C = ‐0.86 (7.8), P = 0.0034. Adverse events: Not reported. | |
| Notes | Attrition Treatment group: Based on Figure 1: 1 participant dropped out with cardiovascular complaints before 3 week evaluation, and 3 were lost to follow‐up after 6 months. From text: 32 completed therapy and 30 presented for follow‐up after six months. Sick leave data available for 22. 11 were lost to follow‐up after two years. Control: According to Figure 1: 2 dropped out due to cardiovascular complaints before 3 week evaluation and 5 were lost to follow‐up after 6 months. From text: 29 completed therapy and 26 presented for follow‐up at six months. Sick leave available for 20. 11 were lost to follow‐up after two years. Funding source/COIs for primary researchers: No information provided. Applicability: No concerns about the generalisability of the data. | |
| Risk of bias | ||
| Bias | Authors' judgement | Support for judgement |
| Random sequence generation (selection bias) | Low risk | The participants were randomised in blocks of five when entering this study which was based on an inpatient treatment at the author's clinic. The physician informed an independent person working elsewhere by phone, who allocated five subsequent participants to one of the two treatment arms by using a lottery system (a piece of paper marked biomedical therapy or biopsychosocial therapy, present in equal number, was taken from a black box and returned afterwards to ensure equal binary probability). |
| Allocation concealment (selection bias) | Low risk | Allocation conducted off site. |
| Blinding of participants (performance bias) | High risk | Blinding not possible due to nature of design. |
| Blinding of personnel (performance bias) | Unclear risk | The participant's group affiliation was concealed from the physiotherapists who treated participants included in the study along with those from the rehabilitation department. Effective blinding of the physiotherapists was not confirmed. The supervising physician and the psychotherapist were not blinded to the participant's group |
| Compliance (adherence) acceptable? (performance bias) | Low risk | Authors indicated that 95% of participants completed therapy (29/31 intervention and 32/33 control). |
| Co‐interventions avoided or similar? (performance bias) | Low risk | Cointerventions such as medication, injections or chirotherapy were avoided in both groups during inpatient treatment. |
| Blinding of outcome assessment (detection bias) | Low risk | Applied to sick leave data. The observer acquiring sick leave status from health insurance companies at 2 year follow‐up (Time 3) was also blinded. |
| Blinding of outcome assessment (detection bias) | High risk | Applied to pain, function, and depression. Participant was outcome assessor. Blinding not possible because of the nature of the intervention. |
| Timing of outcome assessment (measurement/detection bias) | Low risk | Outcomes measured at standard time points. |
| Incomplete outcome data (attrition bias) | Low risk | In regard to outcomes measured at Time 1 and Time 2. Missing outcome data balanced in numbers (3 to 5 at six months), with similar reasons for missing data across groups. For sick leave data, 30% missing data was substantial, but unlikely related to participant characteristics. Data refused by insurance company. ITT not mentioned. |
| Selective reporting (reporting bias) | Low risk | All outcomes described in methods were presented in results. |
| Methods | RCT. Study dates not reported. | |
| Participants | Location = Naval medical centre in the United States. Inclusion criteria (1) age 18 to 50 years, (2) first‐onset back pain (thoracic vertebra 6 or below) present daily for at least 6 but less than 10 weeks, (3) no other major medical illness or pain disorder, and (4) not a candidate for acute surgical intervention. *Baseline symptom intensity for control group: Mean pain was 11.78 (4.1) on the 0 to 20 Descriptor Differential Scale and mean functional status was 12.73 (9.29) on 136‐item self‐report Sickness Impact Profile (reported as percentage); LOWER symptom intensity. | |
| Interventions | Both groups received treatment consisting of 1 outpatient visit, which included (1) history, back examination, screening laboratory assessment for red flags; (2) discussion of physical findings; (3) a prescription for low‐impact aerobic exercise; (4) general health recommendations; and (5) brief education regarding the benign natural history of back pain, and a Readers Digest article, Good News for Bad Backs. Follow‐up visits occurred if requested or were indicated. n = 34, mean age (SD) = 28.90 (6.8), 18% female. The experimental intervention was a modification of a behavioral medicine chronic pain program revised in pilot work to fit a subacute sample. It consisted of 4 weekly, 1‐hour individual sessions, led by a masters‐level clinician trained for the study in behavioral pain management and rehabilitation methods.. *The duration of the intervention was 6 to 10 weeks, 4 hours a week = mid‐intensity. Comparison = Usual care (as described above) plus "attention control" n = 33, mean age (SD) = 32.2 (8.3), 9% female. The attention control condition delivered nonspecific therapeutic ingredients. It was delivered in 4 weekly, 1‐hour individual sessions by a master's‐level clinician with training in psychotherapy, and provided nondirective, supportive care, in contrast with the active, directive approach of the experimental treatment. | |
| Outcomes | Proportion of participants classified as recovered, pain, disability (Sickness Impact Profile, with higher scores indicating more severe disability), health status, pain beliefs, functional work category. Participants were followed up at 6 months and 12 months. Proportion of participants recovered at six months (defined in terms of pain and function) Modified intent‐to‐treat sample (n = 65), I = 52%, C = 31%. Chi2 test = 2.75, df = 1, P = 0.09 Group differences were statistically significant when looking at (1) those completing 4 sessions (n = 50), P = 0.02, and (2) the maximum dose sample (n = 32), P = 0.002) Note: Group means for other outcomes of interest (i.e. pain and disability) were not reported. Adverse events: Not reported. | |
| Notes | Attrition Intervention group: 1 lost to six‐month follow‐up, 9 attended fewer than 4 sessions. Comparison group: 1 lost to six‐month follow‐up, 7 attended fewer than 4 sessions. Funding source/COIs for primary researchers: "The Chief, Bureau of Medicine and Surgery, Navy Department, Washington DC, Clinical Investigation Program, sponsored this report." "A commercial party having a direct financial interest in the results of the research supporting this article has conferred or will confer financial benefit on one of the authors. Dr. Atkinson is on the Scientific Advisory Board of Eli Lilly, which sells antidepressants, an alternative treatment method for low back pain." Applicability: Mainly male, attending Naval Medical Centre. | |
| Risk of bias | ||
| Bias | Authors' judgement | Support for judgement |
| Random sequence generation (selection bias) | Low risk | After qualification and baseline assessment, participants were randomly assigned to behavioral medicine or attention control conditions. |
| Allocation concealment (selection bias) | Low risk | To guard integrity of the blind, the code for group assignment was held by a separate research unit. |
| Blinding of participants (performance bias) | High risk | Not possible due to nature of intervention. Note treatments were conducted in separate areas to prevent cross‐talk. |
| Blinding of personnel (performance bias) | Low risk | To guard integrity of the blind, the code for group assignment was held by a separate research unit. Assessors and therapists were not told about the alternative treatments and hypotheses. Treatments were conducted in separate areas to prevent cross‐talk. |
| Compliance (adherence) acceptable? (performance bias) | Low risk | Authors (Figure 1) provided information on those that completed the treatment sessions (25/34 intervention and 26/33 control). |
| Co‐interventions avoided or similar? (performance bias) | Low risk | Any cointerventions appeared to be similar across groups. |
| Blinding of outcome assessment (detection bias) | Low risk | Functional work category: "In a routine administrative action separate from the research project, each participant's physician rated physical fitness for duty". |
| Blinding of outcome assessment (detection bias) | High risk | Participant was outcome assessor. Blinding not possible due to nature of intervention. |
| Timing of outcome assessment (measurement/detection bias) | Low risk | Outcomes measured at standard time‐points. |
| Incomplete outcome data (attrition bias) | Low risk | Given the exploratory purpose and small scale of this study, both a modified intent‐to‐treat analysis, assessing between‐group differences in proportion recovered among all enrolled participants who completed the 6‐month follow‐up assessment (n = 65), and a completer (n = 50) analysis were planned a priori. We did not include the 2 participants (1 in each group) who completed 4 treatment sessions but not the 6‐month follow‐up in these analyses because we did not have any good data from which to estimate their 6‐month recovery status. If we were to carry forward their baseline values, they would both of necessity be classified as having chronic pain based on the inclusion criteria; however, we rejected this approach, given that they chose to receive a full dose of either behavioral or attention control treatment. Noninclusion of these individuals should not have systematically biased the results in favour of one or the other condition, but could have slightly increased proportional estimates of recovery in both groups. Supplemental analyses were also conducted on participants who attended all 4 sessions and the 6‐month follow‐up (n = 50) and the maximum dose sample who attended all 4 sessions and 2 boosters (n = 32). |
| Selective reporting (reporting bias) | High risk | Group differences not reported for health status and work productivity/functional work category.. |
| Methods | RCT. Dates of study not reported. | |
| Participants | Participants involved in this investigation consisted of consecutive individuals (n = 994), referred for initial screening to The Acute Low Back Pain Program. The study was conducted in the United States. Inclusion English speakers between the ages of 18 and 65; the onset of an original case of acute LBP within 3 months of involvement in the study. *Baseline symptom intensity in control group: Mean pain was 5.95 (1.95) on VAS scale, and functional status at baseline was not reported; symptom intensity information not available. | |
| Interventions | There were 2 treatment groups which were eventually combined because there were no differences between early intervention (EI) and EI + Work Transition (EI/WT) Intervention = Physical therapy and behavioral medicine ("Early Intervention") plus work transition for subset of participants Early Intervention (EI) n = 46, mean age (SD) = 41.8 (11.2), 38.7% female. Physical therapy sessions emphasized an active sports medicine approach involving stretching and exercise in an attempt to maintain/improve strength, endurance and range of motion. The behavioral medicine sessions lasted 45 min each, and followed a specific protocol focusing on stress management/biofeedback and other cognitive‐behavioral pain management techniques (coping skills, distraction techniques, etc.). EI + Work transition (WT) n = 43, age = not clearly reported, 55.8% female *The duration of the intervention was from 4 to 10 weeks; 6 to 9 behavioral medicine sessions; 6 to 9 physical therapy sessions; up to 6 work transitions sessions; one or more case management sessions = low intensity. Comparison = standard care n = 44, mean age (SD) = not clearly reported, 56.8% female. Standard care: no additional information provided. | |
| Outcomes | Return‐to‐work (self‐report), perceived work limitations, work productivity, pain (multiple measures), depression (BDI), SF‐36 (physical and mental components), coping. Participants were followed up at 1 year. Functional disability (Million VAS) at 1 year Minimal important change classifications used. According to Chi2 test, a clinically significant reduction in MVAS was shown in the I group compared to the C group, Chi2 (1, n = 101) = 3.66, P = .04 Note: Means and SDs not reported. Mean SF‐36 at 1year (higher numbers represented higher levels of functioning) I = 40.47 (11.47), C = 39.45 (10.59). One‐way repeated measures ANOVA showed significant group differences for the physical component, F (1, 93) = 4.31, P = 0.04, but not participant's mental functioning. Means and SDs not reported for mental and physical functioning separately. Symptoms of depression at 1year I = 8.81 (9.49), C = 10.11 (10.23) One‐way repeated measures ANOVA showed that participants in the I group showed improvement in mood levels, F(1, 92) = 8.76, P < 0.01 Adverse events: Not reported. | |
| Notes | Attrition: Not reported. Funding source/COIs for primary researchers: The writing of this article was supported in part by grants to Dr. Gatchel from the National Institutes of Health. Applicability: Only high risk individuals randomised. | |
| Risk of bias | ||
| Bias | Authors' judgement | Support for judgement |
| Random sequence generation (selection bias) | Unclear risk | Method of randomizations not specified. |
| Allocation concealment (selection bias) | Unclear risk | Not mentioned in text. |
| Blinding of participants (performance bias) | High risk | Not possible due to nature of intervention. |
| Blinding of personnel (performance bias) | High risk | Not possible due to nature of intervention. |
| Compliance (adherence) acceptable? (performance bias) | Unclear risk | No information provided and unable to ascertain. |
| Co‐interventions avoided or similar? (performance bias) | Low risk | No indication of cointerventions. |
| Blinding of outcome assessment (detection bias) | High risk | Participant was outcome assessor. Blinding not possible because of the nature of the intervention. |
| Timing of outcome assessment (measurement/detection bias) | Low risk | Outcomes measured at standard time points. |
| Incomplete outcome data (attrition bias) | Low risk | Dropouts not described in detail, but appeared to be very few (comparing numbers randomised to baseline data and degrees of freedom in analyses). |
| Selective reporting (reporting bias) | Low risk | All outcomes described in methods were presented in results. |
1A blank cell for this item indicates that non‐self‐report outcomes were not used in the study.
BDI: Beck Depression Inventory
C: comparison group
CBT: cognitive behavior therapy
CES‐D: Center for Epidemiological Studies Depression Scale
COI: conflict of interest
df: degrees of freedom
EI: early intervention
FABQ: Fear‐Avoidance Belief Questionnaire
FIOH: Finnish Institute of Occupational Health
I: intervention group
ITT: intention to treat
LBP: low back pain
MVAS: Million visual analogue scale
Orebro: Orebro Musculoskeletal Pain Screening Questionnaire
RDQ: Roland‐Morris Disability Questionnaire
RTW: return‐to‐work
SD: standard deviation
SF‐36: Short Form Survey (SF‐36)
WT: work transition
VAS: visual analogue scale
Characteristics of excluded studies [ordered by study ID]
| Study | Reason for exclusion |
| Rehabilitation is not multidisciplinary. | |
| Appeared to be chronic LBP. | |
| Rehabilitation is not multidisciplinary. | |
| Rehabilitation is not multidisciplinary. | |
| Rehabilitation is not multidisciplinary. | |
| Not subacute low back pain. | |
| Non‐multidisciplinary rehabilitation for acute back pain. | |
| This study defined subacute LBP as between 7 days and 7 weeks.. | |
| Rehabilitation is not multidisciplinary. | |
| Rehabilitation is not multidisciplinary. | |
| Acute sciatica. | |
| Rehabiliation is not multidisciplinary. | |
| Rehabilitation is not multidisciplinary. | |
| Rehabilitation is not multidisciplinary. | |
| Rehabilitation is not multidisciplinary. | |
| Rehabilitation is not multidisciplinary. | |
| Participants too chronic. | |
| Rehabilitation is not multidisciplinary. | |
| This study was included in the original version of the review. However, the intervention did not meet our criteria for multidisciplinary because it was not carried out by two or more clinicians from different disciplines. | |
| Rehabilitation is not multidisciplinary. | |
| Rehabilitation is not multidisciplinary. Participants were subacute and chronic low back pain patients. | |
| Fatal flaw: There was not a real control group. Participants were randomised in an index group and a control group. Both groups received rehabilitation. In the control group, baseline assessment was done before rehabilitation and in the index group after rehabilitation. Results were concluded to be unusable. | |
| Rehabilitation is not multidisciplinary. Trained physiotherapists delivered entire intervention. | |
| Acute low back patients. Rehabilitation is not multidisciplinary. | |
| Rehabilitation is not multidisciplinary. Graded activity carried out by physiotherapists. | |
| Rehabilitation is not multidisciplinary ‐ one clinician, physiotherapist. | |
| Rehabilitation is not multidisciplinary. | |
| Rehabiliation is not multidisciplinary. | |
| Rehabilitation is not multidisciplinary. Trained physiotherapists delivered entire intervention. |
Characteristics of studies awaiting assessment [ordered by study ID]
| Methods | RCT. |
| Participants |
|
| Interventions | A multidisciplinary intervention including physical, psychological, educational, and pharmacological aspects. |
| Outcomes |
Outcomes were measured at baseline, 3 months, 6 and 12 months. |
| Notes | Trial registration: Barcelona, 01/01/2009. Study is now complete, but we were unable to find any published studies. |
LBP: low back pain
SF‐12: Short Form Survey (SF‐12)
Characteristics of ongoing studies [ordered by study ID]
| Trial name or title | Comparing multidisciplinary and brief intervention in sick‐listed employees with low back pain. Do job relations matter? |
| Methods | RCT. |
| Participants | Inclusion criteria:
|
| Interventions | Brief Intervention: Information about pain management + physiotherapist appointment. Multidisciplinary Intervention: Brief intervention + individual treatment plan provided by group of experts. |
| Outcomes | Return‐to‐work (RTW), which will be measured during a follow‐up period of one year. RTW is here defined as the first 4‐week period after sick‐listing, where sick leave and disability benefits are not received. Data will be retrieved from registers of public social transfer income. |
| Starting date | October 2010. |
| Contact information | |
| Notes |
| Trial name or title | Managing nonacute low back symptoms in occupational health: two trials. |
| Methods | RCT. |
| Participants | Inclusion criteria:
|
| Interventions |
|
| Outcomes | Sickness absence days (low back (LB) specific, other than LB total) (time frame: 6, 12, 24, 36, 48 months) Low back pain (VAS) (time frame: 0, 3, 6, 12, 24 months) Disability (Roland‐Morris 18) (time frame: 0, 3, 6, 12, 24 months) Quality of life (15‐Dimensional Measure of Health‐Related Quality of Life) (time frame: 0, 3, 6, 12, 24 months). |
| Starting date | September 2001. |
| Contact information | |
| Notes | Duration of LBP may exceed 3 months, in which case the study should be included in review on MBR for chronic LBP. |
| Trial name or title | Early co‐ordinated multidisciplinary intervention to prevent sickness absence and labor market exclusion in patients with low back pain. |
| Methods | RCT. |
| Participants | Inclusion criteria:
|
| Interventions | Experimental: Early co‐ordinated multidisciplinary intervention: physiotherapist, chiropractor, rheumatologist, psychologist, occupational physician, ergonomist and social worker/case manager. Active Comparator: Usual care intervention from physiotherapist, chiropractor, rheumatologist, and social worker. |
| Outcomes | Number of days off work (time frame: 12 months). |
| Starting date | September 2009. |
| Contact information | |
| Notes | Duration of LBP may exceed 3 months, in which case the study should be included in review on MBR for chronic LBP. |
| Trial name or title | Structured care with workplace interventions to improve work ability in patients with neck and/or low back pain (WorkUp). |
| Methods | Cluster RCT. |
| Participants | Inclusion criteria:
|
| Interventions | Experimental: Structured care & workplace intervention. Active Comparator: Treatment as usual. |
| Outcomes | Work ability (time frame: Changes from baseline to 3, 6, 12 months and 2 and 3 years). Work ability (defined as being at work or being eligible to the labour market during at least four weeks in a row) and time of sickness absence and return‐to‐work. Year 2 and 3 follow‐up by register data. |
| Starting date | January 2013. |
| Contact information | |
| Notes | Unclear whether study results will be reported separately for back and neck pain. |
LBP: low back pain
MBR: multidisciplinary biopsychosocial rehabilitation
OH: occupational health
RTW: return to work
VAS: visual analogue scale
Data and analyses
| Outcome or subgroup title | No. of studies | No. of participants | Statistical method | Effect size |
| 1 Pain Show forest plot | 5 | Std. Mean Difference (IV, Random, 95% CI) | Subtotals only | |
| Analysis 1.1  Comparison 1 Multidisciplinary rehabilitation versus usual care, Outcome 1 Pain. | ||||
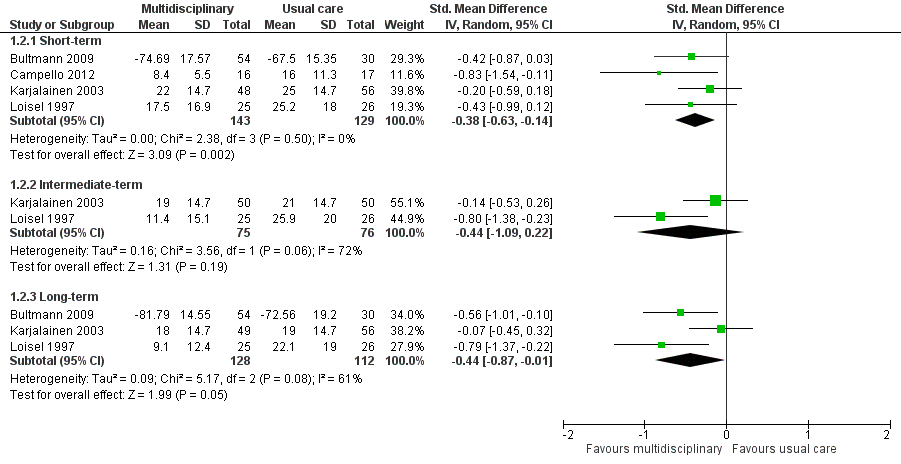
| 1.1 Short‐term | 4 | 272 | Std. Mean Difference (IV, Random, 95% CI) | ‐0.40 [‐0.74, ‐0.06] |
| 1.2 Intermediate‐term | 2 | 155 | Std. Mean Difference (IV, Random, 95% CI) | ‐0.34 [1.00, 0.31] |
| 1.3 Long‐term | 4 | 336 | Std. Mean Difference (IV, Random, 95% CI) | ‐0.46 [‐0.70, ‐0.21] |
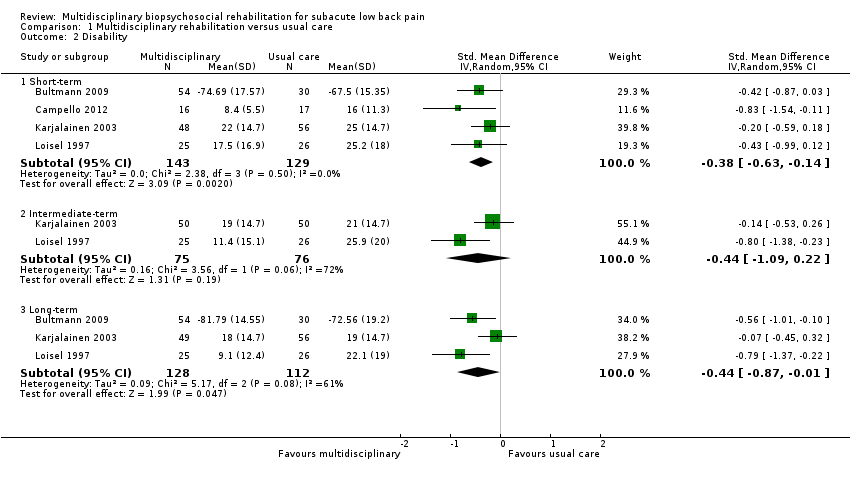
| 2 Disability Show forest plot | 4 | Std. Mean Difference (IV, Random, 95% CI) | Subtotals only | |
| Analysis 1.2  Comparison 1 Multidisciplinary rehabilitation versus usual care, Outcome 2 Disability. | ||||
| 2.1 Short‐term | 4 | 272 | Std. Mean Difference (IV, Random, 95% CI) | ‐0.38 [‐0.63, ‐0.14] |
| 2.2 Intermediate‐term | 2 | 151 | Std. Mean Difference (IV, Random, 95% CI) | ‐0.44 [‐1.09, 0.22] |
| 2.3 Long‐term | 3 | 240 | Std. Mean Difference (IV, Random, 95% CI) | ‐0.44 [‐0.87, ‐0.01] |
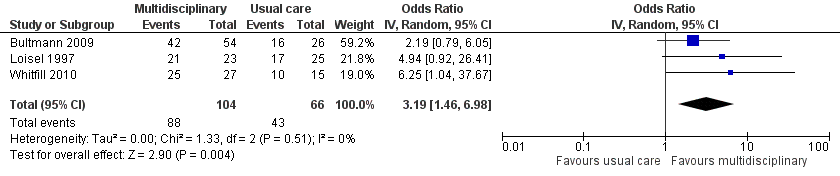
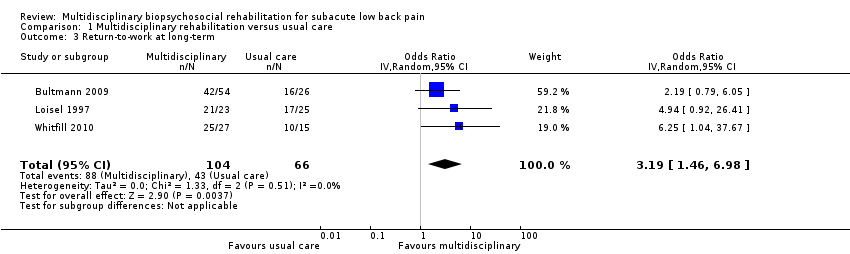
| 3 Return‐to‐work at long‐term Show forest plot | 3 | 170 | Odds Ratio (IV, Random, 95% CI) | 3.19 [1.46, 6.98] |
| Analysis 1.3  Comparison 1 Multidisciplinary rehabilitation versus usual care, Outcome 3 Return‐to‐work at long‐term. | ||||
| 4 Sick leave periods at long‐term Show forest plot | 2 | 210 | Std. Mean Difference (IV, Fixed, 95% CI) | ‐0.38 [‐0.66, ‐0.10] |
| Analysis 1.4  Comparison 1 Multidisciplinary rehabilitation versus usual care, Outcome 4 Sick leave periods at long‐term. | ||||
| Outcome or subgroup title | No. of studies | No. of participants | Statistical method | Effect size |
| 1 Pain Show forest plot | 3 | Std. Mean Difference (IV, Random, 95% CI) | Subtotals only | |
| Analysis 2.1 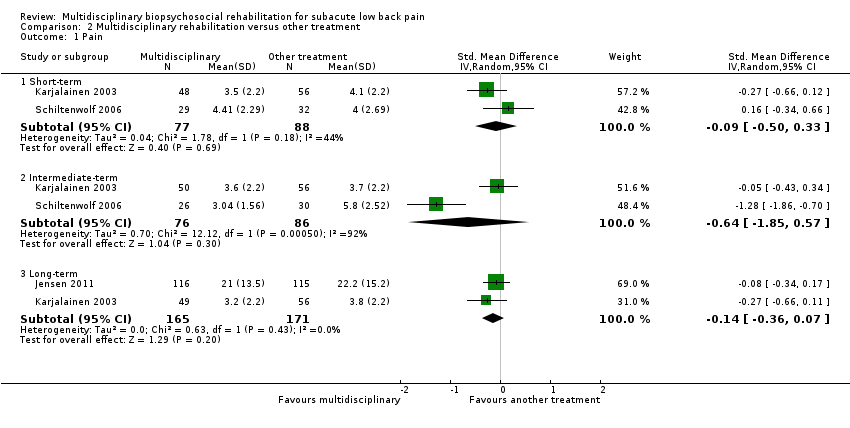 Comparison 2 Multidisciplinary rehabilitation versus other treatment, Outcome 1 Pain. | ||||
| 1.1 Short‐term | 2 | 165 | Std. Mean Difference (IV, Random, 95% CI) | ‐0.09 [‐0.50, 0.33] |
| 1.2 Intermediate‐term | 2 | 162 | Std. Mean Difference (IV, Random, 95% CI) | ‐0.64 [‐1.85, 0.57] |
| 1.3 Long‐term | 2 | 336 | Std. Mean Difference (IV, Random, 95% CI) | ‐0.14 [‐0.36, 0.07] |
| 2 Disability Show forest plot | 3 | Std. Mean Difference (IV, Random, 95% CI) | Subtotals only | |
| Analysis 2.2  Comparison 2 Multidisciplinary rehabilitation versus other treatment, Outcome 2 Disability. | ||||
| 2.1 Short‐term | 2 | 165 | Std. Mean Difference (IV, Random, 95% CI) | ‐0.00 [‐0.34, 0.34] |
| 2.2 Intermediate‐term | 2 | 162 | Std. Mean Difference (IV, Random, 95% CI) | ‐0.49 [‐1.50, 0.51] |
| 2.3 Long‐term | 2 | 345 | Std. Mean Difference (IV, Random, 95% CI) | ‐0.03 [‐0.24, 0.18] |
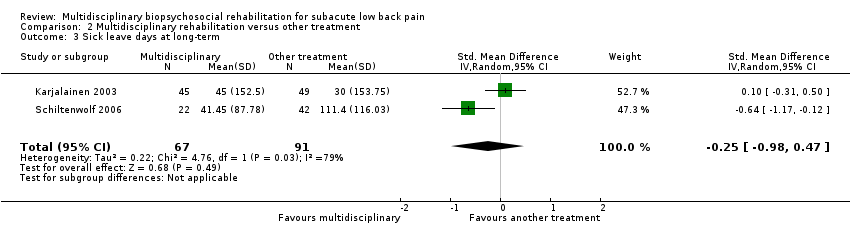
| 3 Sick leave days at long‐term Show forest plot | 2 | 158 | Std. Mean Difference (IV, Random, 95% CI) | ‐0.25 [‐0.98, 0.47] |
| Analysis 2.3  Comparison 2 Multidisciplinary rehabilitation versus other treatment, Outcome 3 Sick leave days at long‐term. | ||||
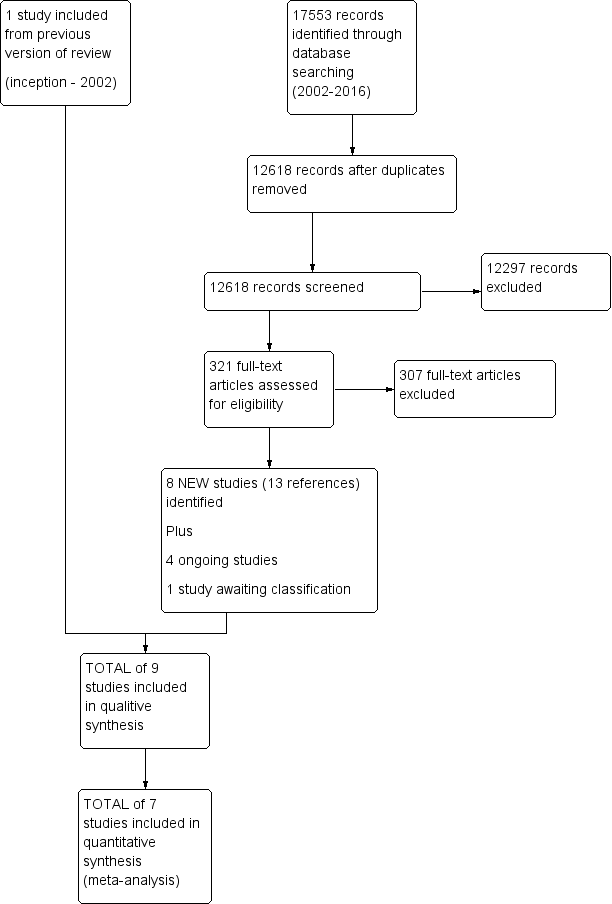
Study flow diagram.

Risk of bias summary: review authors' judgements about each risk of bias item for each included study.

Forest plot of comparison: 1 Multidisciplinary rehabilitation versus usual care, outcome: 1.1 Pain intensity (scales varied from 0 to 10 or 0 to100).
Forest plot of comparison: 1 Multidisciplinary rehabilitation versus usual care, outcome: 1.2 Disability (measured with different continuous scales)
Forest plot of comparison: 1 Multidisciplinary rehabilitation versus usual care, outcome: 1.3 Return‐to‐work at long‐term.
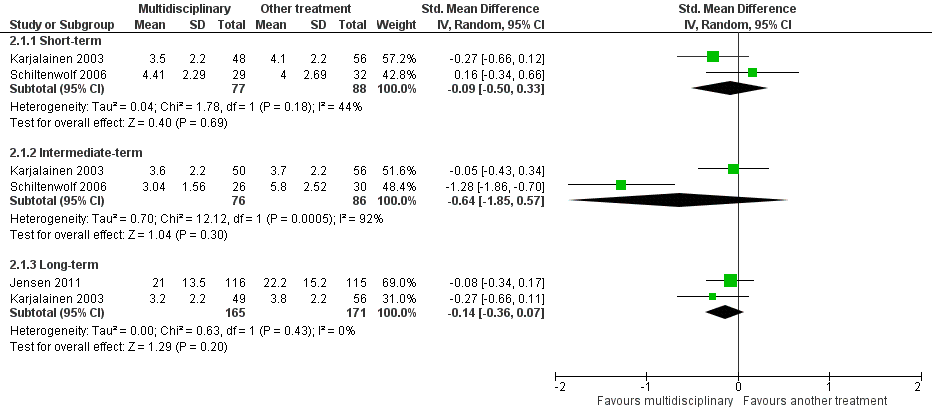
Forest plot of comparison: 2 Multidisciplinary rehabilitation versus other treatment, outcome: 2.1 Pain.

Forest plot of comparison: 2 Multidisciplinary rehabilitation versus other treatment, outcome: 2.2 Disability (Different instruments).

Comparison 1 Multidisciplinary rehabilitation versus usual care, Outcome 1 Pain.
Comparison 1 Multidisciplinary rehabilitation versus usual care, Outcome 2 Disability.
Comparison 1 Multidisciplinary rehabilitation versus usual care, Outcome 3 Return‐to‐work at long‐term.

Comparison 1 Multidisciplinary rehabilitation versus usual care, Outcome 4 Sick leave periods at long‐term.

Comparison 2 Multidisciplinary rehabilitation versus other treatment, Outcome 1 Pain.

Comparison 2 Multidisciplinary rehabilitation versus other treatment, Outcome 2 Disability.
Comparison 2 Multidisciplinary rehabilitation versus other treatment, Outcome 3 Sick leave days at long‐term.
| Patient or population: Subacute low back pain | |||||||
| Outcomes | Anticipated absolute effects* (95% CI) | Relative effect | № of participants | Quality of the evidence (GRADE) | Comments | ||
| Risk with usual care | Risk with multidisciplinary rehabilitation | ||||||
| Back pain long‐term Higher scores indicated more intense pain Follow‐up: median 12 months | The baseline for the most representative study# (Karjalainen 2003) was 5.7 out of 10 (visual analogue scale). | The risk with MBR was approximately 4.67 (4.60 to 4.73) out of 10. | The mean pain in the intervention group was 0.46 standard deviations lower (0.7 lower to 0.21 lower). | 336 | TOTAL = 532 (5 RCTs) | X X X ◯ MODERATE 1 | This was a small to moderate effect (Cohen 1988) that is probably clinically relevant in this participant group. |
| An additional study that could not be included in meta‐analysis showed no difference between the groups. | ‐ | 196 (1 RCT included in qualitative synthesis). | |||||
| Functional disability at the long term Higher scores indicated more disability Follow‐up: median 12 months. | The baseline for the most representative study# (Karjalainen 2003) was 34 out of 100 (Oswestry Scale). | The risk with MBR was approximately 26.30 (25.2 to 27.4) out of 100. | The mean functional disability in the intervention group was 0.44 standard deviations lower (0.87 lower to 0.01 lower). | 240 | TOTAL = 537 (5 RCTs) | X X ◯◯ | This was a small to moderate effect (Cohen 1988) that is probably clinically relevant in this participant group. |
| Two additional studies could not be included in meta‐analysis. One study showed evidence in favour of MBR and the other showed no difference between the groups. | ‐ | 297 (2 RCTs included in qualitative synthesis). | |||||
| Return‐to‐work at the long term Proportion at work Follow‐up: median 12 months. | Study population | OR 3.19 (1.46 to 6.98) | 170 | X ◯◯◯ | This was a moderate effect that is clinically relevant in this participant group. | ||
| 65 per 100 | 86 per 100 | ||||||
| Sick leave periods at long‐term Cumulative sickness absence periods over the course of the 12‐month follow‐up. | Average sick leave in the usual care group was 997.3 hours (Bultmann 2009). | The risk with MBR was approximately 763.03 (743.3 to 782.3) sick leave hours. | The mean sick leave periods in the intervention group was 0.38 standard deviations lower (0.66 lower to 0.10 lower). | 210 | X X ◯◯ | This was a small to moderate effect (Cohen 1988) that is clinically relevant in this participant group. | |
| Adverse events | N/A | NO EVIDENCE | None of the included studies reported on adverse events. | ||||
| *The risk in the intervention group (and its 95% confidence interval) is based on the assumed risk in the comparison group and the relative effect of the intervention (and its 95% CI). #We defined the most representative sample as the study that has the largest weighting in the overall result in RevMan. | |||||||
| GRADE Working Group grades of evidence | |||||||
| 1 Downgraded due to risk of bias, all five trials had high risk of performance bias and detection bias. One trial suffered from unclear risk of selection bias. Another trial suffered from unclear risk of attrition bias (serious bias = 1‐point downgrade). 2 Downgraded due to inconsistency, I2 statistic60% (heterogeneity = 1‐point downgrade). 3 Downgraded due to serious risk of bias, all three trials suffered from risk of performance bias and detection bias. One trial also suffered from unclear risk of selection bias and another trial suffered from unclear risk of attrition bias (very serious bias = 2‐point downgrade). 4 Downgraded due to imprecision, the total number of events was less than 300 (1‐point downgrade). 5 Downgraded due to risk of bias, both trials suffered from risk of performance bias and detection bias. One trial also suffered from unclear risk of attrition bias (serious bias = 1‐point downgrade). 6 Downgraded due to imprecision, total population size < 400 (1‐point downgrade). | |||||||
| Patient or population: Subacute low back pain | ||||||
| Outcomes | Anticipated absolute effects* (95% CI) | Relative effect | № of participants | Quality of the evidence | Comments | |
| Risk with another treatment | Risk with multidisciplinary rehabilitation | |||||
| Pain at the long term Higher scores indicated more intense pain Follow‐up: median 12 months. | The baseline for the most representative study# (Jensen 2011) was 32.7 out of 60 (LBP Rating Scale). | The risk in the MBR group was approximately 31.02 out of 60. | The mean pain in the intervention group was 0.14 standard deviations lower (0.36 lower to 0.07 higher). | 336 | X X ◯◯ | This difference was not statistically or clinically relevant. |
| Functional disability at the long term Higher scores indicated more severe functional disability. Follow‐up: median 12 months. | The baseline for the most representative study# (Jensen 2011) was 15.6 out of 23 (Roland‐Morris). | The risk in the MBR group was approximately 15.45 out of 23. | The mean functional disability in the intervention group was 0.03 standard deviations lower (0.24 lower to 0.18 higher). | 345 | X X ◯◯ | This difference was not statistically or clinically relevant. |
| Return‐to‐work at long‐term | N/A | N/A | N/A | N/A | NO EVIDENCE | None of the studies that compared MBR to another treatment assessed this outcome. |
| Sick leave periods at long‐term Follow‐up: median 24 months. | Average sick leave in the comparison group was 30 days (Karjalainen 2003). | The risk in the MBR group was approximately 4 (0 to 8) sick leave days. | The mean sick leave days in the intervention group was 0.25 standard deviations lower (0.98 lower to 0.47 higher). | 158 | X ◯◯◯ | There was a difference between the groups but the pooled estimate was imprecise and should not be interpreted. |
| Adverse events | N/A | NO EVIDENCE | None of the included studies reported on adverse events. | |||
| #We defined the most representative sample as the study that has the largest weighting in the overall result in RevMan. *The risk in the intervention group (and its 95% confidence interval) is based on the assumed risk in the comparison group and the relative effect of the intervention (and its 95% CI). | ||||||
| GRADE Working Group grades of evidence | ||||||
| 1Downgraded due to imprecision, n < 400 (1‐point downgrade). 2Downgraded due to risk of bias, both trials suffered from high risk of performance bias and detection bias. One trial suffered from unclear risk of attrition bias (serious bias = 1‐point downgrade). 3Downgraded due to imprecision 95% confidence interval includes the no effect and the upper or lower confidence limit crosses an effect size of 0.5 (1‐point downgrade). 4Downgraded due to inconsistency, I2 statistic > 60% (1‐point downgrade). 5Downgraded due to risk of bias, the two trials suffered from high risk of performance bias and detection bias (serious bias = 1‐point downgrade). | ||||||
| Study | Practitioners involved | Methods for interdisciplinary collaboration | Intervention intensity |
| Ergonomist, physiotherapist | "The workplace intervention consisted of a workplace assessment and work adjustments in which all major stakeholders in the return‐to‐work process participated: i.e., the worker, the employer, the occupational physician, and the worker’s general practitioner.” | The entire program consisted of two 1‐hour sessions a week, with 26 sessions maximally (13 weeks) = low intensity | |
| Occupational physician, occupational physiotherapist, chiropractor, psychologist, social worker | “The formulation and implementation of a coordinated, tailored and action‐oriented work rehabilitation plan collaboratively developed by an interdisciplinary team using a feedback guided approach.” | The duration of the intervention was for up to three months; insufficient information to categorize intervention intensity. | |
| Physical therapist, psychologist, physician | “Backs to Work is a coordinated multidisciplinary reconditioning program” | The duration of the intervention was 3 hours per day, 3 days/week for 4 weeks = 36 hours = mid‐intensity | |
| Rehabilitation physician, specialist in clinical social medicine, physiotherapist, social worker, occupational therapist | Coordinated through case manager | The duration of the intervention was 18 weeks, average of 4 meetings with case manager = low intensity | |
| Physician, physiotherapist, company nurse, company physician | Physiotherapist visited patient’s workplace to involve work supervisor and company health care professionals in treatment | The duration of the mini‐intervention was 1.25‐1.5 hours and the worksite visit was approximately 75 minutes = low intensity | |
| Occupational physician, ergonomist, back pain specialist | “All described interventions were provided by a multidisciplinary medical, ergonomic, and rehabilitation staff at the Sherbrooke University Hospital back pain clinic.” | In a previous study using the same protocol (Loisel 1994), the duration of functional rehabilitation therapy ranged from 2 to 13 weeks. Insufficient information to categorize intervention intensity. | |
| Physician, physiotherapist, psychotherapist | This does not appear to be an integrated program. The physiotherapists were blind to treatment condition, indicating no communication between the physiotherapists and psychotherapists. | The duration of the intervention was 6 hours of daily treatment for 15 days in 3 weeks = mid‐intensity | |
| Physician, masters‐level clinician for behavioural medicine intervention | The extent to which health care professionals communicated wasn't clear from the article text. | The duration of the intervention was 6‐10 weeks, 4 hours a week = mid‐intensity | |
| Physical therapy and behavioral medicine sessions “provided by licensed professionals trained in their respective fields;” occupational therapist | Case management sessions and interdisciplinary team conferences held at baseline and discharge. | The duration of the intervention was from 4 to 10 weeks; 6‐9 behavioral medicine sessions; 6‐9 physical therapy sessions; Up to 6 work transitions sessions; one or more case management sessions = low intensity |
| Bias Domain | Source of Bias | PossibleAnswers |
| Selection | (1) Was the method of randomizations adequate? | Yes/No/Unsure |
| Selection | (2) Was the treatment allocation concealed? | Yes/No/Unsure |
| Performance | (3) Was the patient blinded to the intervention? | Yes/No/Unsure |
| Performance | (4) Was the care provider blinded to the intervention? | Yes/No/Unsure |
| Detection | (5) Was the outcome assessor blinded to the intervention? | Yes/No/Unsure |
| Attrition | (6) Was the drop‐out rate described and acceptable? | Yes/No/Unsure |
| Attrition | (7) Were all randomised participants analysed in the group to which they were allocated? | Yes/No/Unsure |
| Reporting | (8) Are reports of the study free of suggestion of selective outcome reporting? | Yes/No/Unsure |
| Performance | (9) Were cointerventions avoided or similar? | Yes/No/Unsure |
| Performance | (10) Was the compliance acceptable in all groups? | Yes/No/Unsure |
| Detection | (11) Was the timing of the outcome assessment similar in all groups? | Yes/No/Unsure |
| Other | (12) Are other sources of potential bias unlikely? | Yes/No/Unsure |
| 1 | A random (unpredictable) assignment sequence. Examples of adequate methods are coin toss (for studies with 2 |
| 2 | Assignment generated by an independent person not responsible for determining the eligibility of the patients. |
| 3 | Index and control groups are indistinguishable for the patients or if the success of blinding was tested among |
| 4 | Index and control groups are indistinguishable for the care providers or if the success of blinding was tested |
| 5 | Adequacy of blinding should be assessed for each primary outcome separately. This item should be scored ‐for patient‐reported outcomes in which the patient is the outcome assessor (e.g., pain, disability): the blinding |
| 6 | The number of participants who were included in the study but did not complete the observation period or |
| 7 | All randomised patients are reported/analysed in the group they were allocated to by randomizations for the |
| 8 | All the results from all prespecified outcomes have been adequately reported in the published report of the |
| 9 | If there were no cointerventions or they were similar between the index and control groups. |
| 10 | The reviewer determines if the compliance with the interventions is acceptable, based on the reported |
| 11 | Timing of outcome assessment should be identical for all intervention groups and for all primary outcome |
| 12 | Other types of biases. For example: |
| Outcome or subgroup title | No. of studies | No. of participants | Statistical method | Effect size |
| 1 Pain Show forest plot | 5 | Std. Mean Difference (IV, Random, 95% CI) | Subtotals only | |
| 1.1 Short‐term | 4 | 272 | Std. Mean Difference (IV, Random, 95% CI) | ‐0.40 [‐0.74, ‐0.06] |
| 1.2 Intermediate‐term | 2 | 155 | Std. Mean Difference (IV, Random, 95% CI) | ‐0.34 [1.00, 0.31] |
| 1.3 Long‐term | 4 | 336 | Std. Mean Difference (IV, Random, 95% CI) | ‐0.46 [‐0.70, ‐0.21] |
| 2 Disability Show forest plot | 4 | Std. Mean Difference (IV, Random, 95% CI) | Subtotals only | |
| 2.1 Short‐term | 4 | 272 | Std. Mean Difference (IV, Random, 95% CI) | ‐0.38 [‐0.63, ‐0.14] |
| 2.2 Intermediate‐term | 2 | 151 | Std. Mean Difference (IV, Random, 95% CI) | ‐0.44 [‐1.09, 0.22] |
| 2.3 Long‐term | 3 | 240 | Std. Mean Difference (IV, Random, 95% CI) | ‐0.44 [‐0.87, ‐0.01] |
| 3 Return‐to‐work at long‐term Show forest plot | 3 | 170 | Odds Ratio (IV, Random, 95% CI) | 3.19 [1.46, 6.98] |
| 4 Sick leave periods at long‐term Show forest plot | 2 | 210 | Std. Mean Difference (IV, Fixed, 95% CI) | ‐0.38 [‐0.66, ‐0.10] |
| Outcome or subgroup title | No. of studies | No. of participants | Statistical method | Effect size |
| 1 Pain Show forest plot | 3 | Std. Mean Difference (IV, Random, 95% CI) | Subtotals only | |
| 1.1 Short‐term | 2 | 165 | Std. Mean Difference (IV, Random, 95% CI) | ‐0.09 [‐0.50, 0.33] |
| 1.2 Intermediate‐term | 2 | 162 | Std. Mean Difference (IV, Random, 95% CI) | ‐0.64 [‐1.85, 0.57] |
| 1.3 Long‐term | 2 | 336 | Std. Mean Difference (IV, Random, 95% CI) | ‐0.14 [‐0.36, 0.07] |
| 2 Disability Show forest plot | 3 | Std. Mean Difference (IV, Random, 95% CI) | Subtotals only | |
| 2.1 Short‐term | 2 | 165 | Std. Mean Difference (IV, Random, 95% CI) | ‐0.00 [‐0.34, 0.34] |
| 2.2 Intermediate‐term | 2 | 162 | Std. Mean Difference (IV, Random, 95% CI) | ‐0.49 [‐1.50, 0.51] |
| 2.3 Long‐term | 2 | 345 | Std. Mean Difference (IV, Random, 95% CI) | ‐0.03 [‐0.24, 0.18] |
| 3 Sick leave days at long‐term Show forest plot | 2 | 158 | Std. Mean Difference (IV, Random, 95% CI) | ‐0.25 [‐0.98, 0.47] |