Rehabilitación biopsicosocial multidisciplinaria para el dolor lumbar subagudo
Información
- DOI:
- https://doi.org/10.1002/14651858.CD002193.pub2Copiar DOI

- Base de datos:
-
- Cochrane Database of Systematic Reviews
- Versión publicada:
-
- 28 junio 2017see what's new
- Tipo:
-
- Intervention
- Etapa:
-
- Review
- Grupo Editorial Cochrane:
-
Grupo Cochrane de Espalda y cuello
- Copyright:
-
- Copyright © 2017 The Cochrane Collaboration. Published by John Wiley & Sons, Ltd.
Cifras del artículo
Altmetric:
Citado por:
Autores
Contributions of authors
Rachel Couban contributed to the review by creating the search strategy and running the search, assisting with study selection, the 'risk of bias' assessment and data extraction, and reviewing final drafts of the manuscript.
Emma Irvin contributed to study selection, the 'risk of bias' assessment, date extraction, and the GRADE assessment, as well as reviewing and editing the review.
Steven Kamper contributed to data extraction and data analysis, as well as reviewing and editing the review.
Bart Koes was involved in the previous version of this review, and he reviewed and edited the present version.
Antti Malmivaara was involved in the previous version of this review, and he reviewed and edited the present version.
Teresa Marin contributed to study selection, the 'risk of bias' assessment, data extraction, the GRADE assessment, and data analysis, as well as writing the review.
Dwayne Van Eerd contributed to study selection, 'risk of bias' assessment, and data extraction, as well as reviewing and editing the review.
Maurits van Tulder was involved in the previous version of this review, and he reviewed and edited the present version.
Declarations of interest
Rachel Couban has no conflicts to declare.
Emma Irvin has no conflicts to declare.
Bart Koes has no conflicts to declare.
Antti Malmivaara has no conflicts to declare.
Steven Kamper has acted as a consultant providing methodological advice on an unrelated study to AO Spine; his salary is paid by a research fellowship from the National Health and Medical Research Council of Australia.
Teresa Marin has no conflicts to declare.
Dwayne Van Eerd has no conflicts to declare.
Maurits van Tulder has no conflicts to declare.
Acknowledgements
We are grateful to Shireen Harbin (Cochrane Back and Neck Group Managing Editor) for assisting with literature searches and the editorial process more generally, as well as Ivan Steenstra, Sara Morassaei, Sara Macdonald and Dominik Irnich for helping to translate the nonEnglish studies. Thank you to Lenny Vasanthan for assisting with the literature search and data extraction.
Version history
| Published | Title | Stage | Authors | Version |
| 2017 Jun 28 | Multidisciplinary biopsychosocial rehabilitation for subacute low back pain | Review | Teresa J Marin, Dwayne Van Eerd, Emma Irvin, Rachel Couban, Bart W Koes, Antti Malmivaara, Maurits W van Tulder, Steven J Kamper | |
| 2003 Apr 22 | Multidisciplinary biopsychosocial rehabilitation for subacute low‐back pain among working age adults | Review | Kaija A Karjalainen, Antti Malmivaara, Maurits W van Tulder, Risto Roine, Merja Jauhiainen, Heikki Hurri, Bart W Koes | |
Differences between protocol and review
Since the previous version of the review, we updated the methods in accordance with the Furlan 2015 method guidelines.
We only included studies when the full report was peer‐reviewed. We also worked with translators to review all non‐English studies against the inclusion criteria. In the previous version of the review, we included studies where the patients had experienced low back pain for more than four weeks but less than three months. In this update, we included patients with pain for more than six weeks but less than 12 weeks. We clarified that we included participants with or without radiating pain and excluded patients during or immediately following pregnancy.
For the intervention, we clarified that the MBR program must involve healthcare professionals from at least two different clinical backgrounds, which led to the exclusion of a previously included study, and defined the physical, psychological, and social/occupational components. We also outlined the comparisons to be included in the review. We did not include satisfaction with treatment as an outcome in this version of the review. Instead we looked at psychological and cognitive function (depression, anxiety, fear avoidance and coping satisfaction).
Notes
None
Keywords
MeSH
Medical Subject Headings (MeSH) Keywords
Medical Subject Headings Check Words
Adult; Humans;
PICO
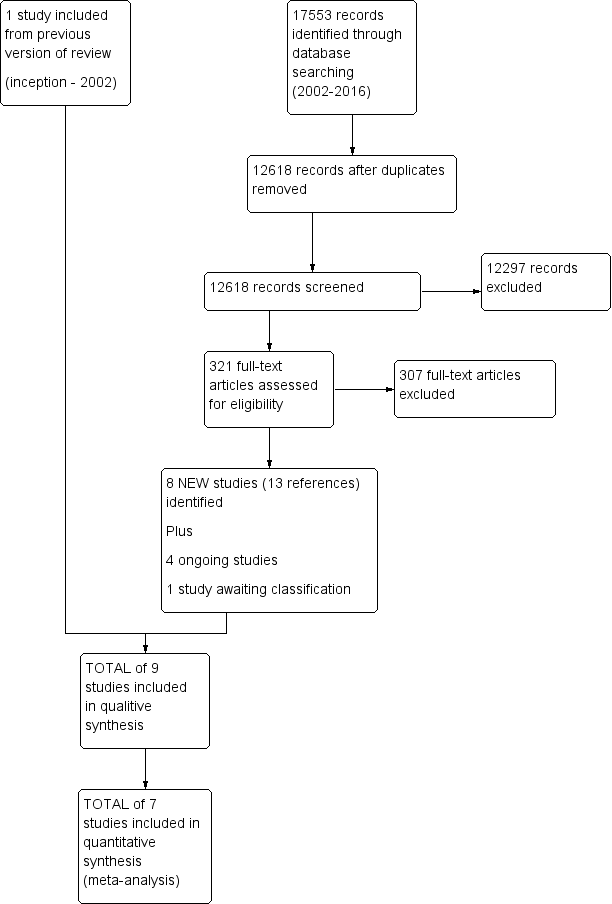
Study flow diagram.

Risk of bias summary: review authors' judgements about each risk of bias item for each included study.

Forest plot of comparison: 1 Multidisciplinary rehabilitation versus usual care, outcome: 1.1 Pain intensity (scales varied from 0 to 10 or 0 to100).
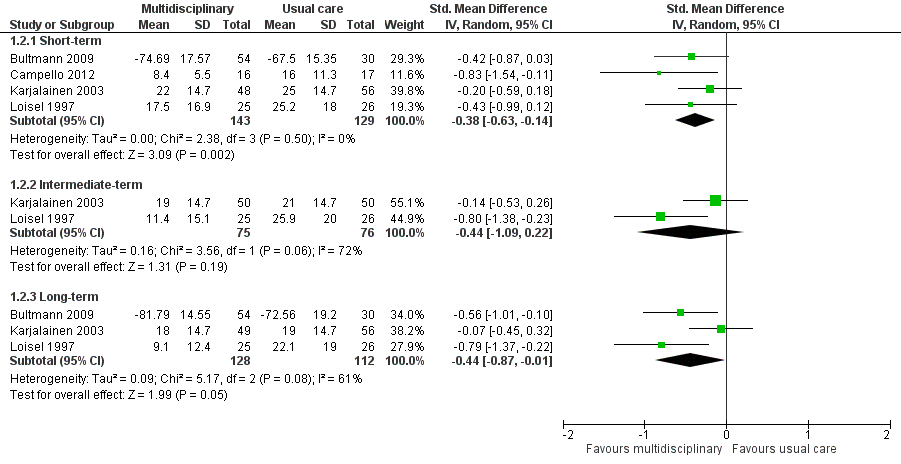
Forest plot of comparison: 1 Multidisciplinary rehabilitation versus usual care, outcome: 1.2 Disability (measured with different continuous scales)
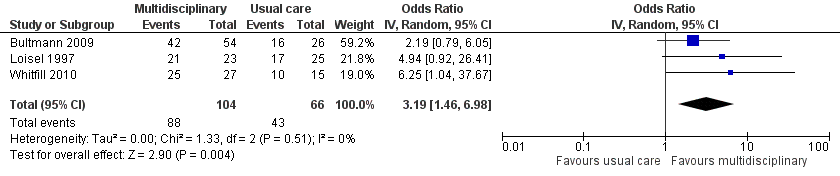
Forest plot of comparison: 1 Multidisciplinary rehabilitation versus usual care, outcome: 1.3 Return‐to‐work at long‐term.
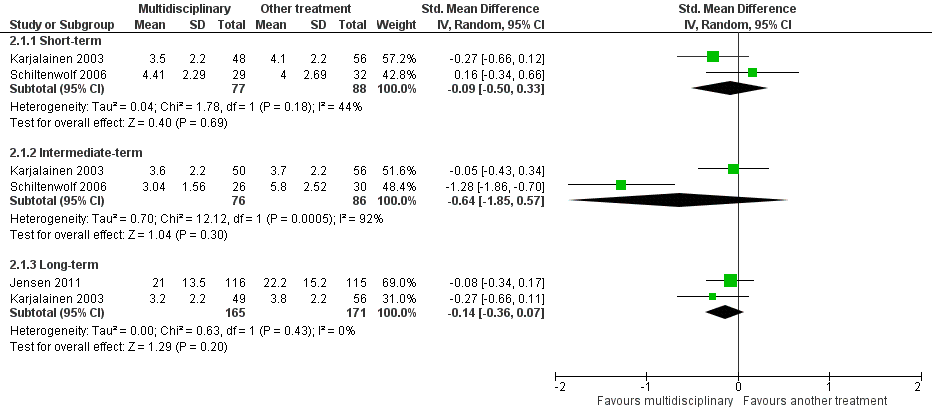
Forest plot of comparison: 2 Multidisciplinary rehabilitation versus other treatment, outcome: 2.1 Pain.

Forest plot of comparison: 2 Multidisciplinary rehabilitation versus other treatment, outcome: 2.2 Disability (Different instruments).

Comparison 1 Multidisciplinary rehabilitation versus usual care, Outcome 1 Pain.
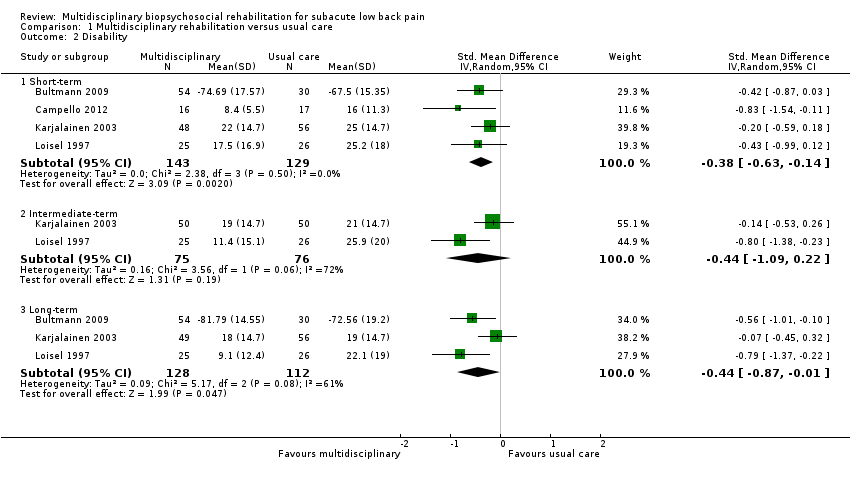
Comparison 1 Multidisciplinary rehabilitation versus usual care, Outcome 2 Disability.
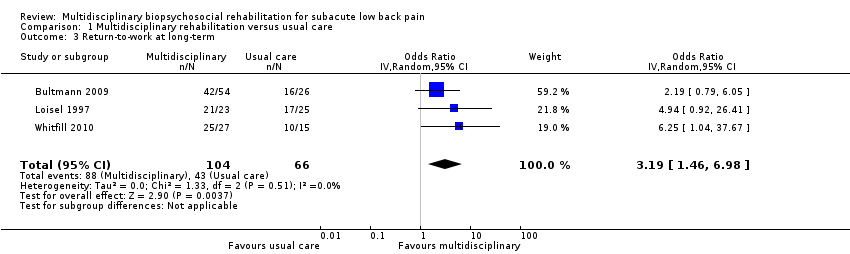
Comparison 1 Multidisciplinary rehabilitation versus usual care, Outcome 3 Return‐to‐work at long‐term.

Comparison 1 Multidisciplinary rehabilitation versus usual care, Outcome 4 Sick leave periods at long‐term.

Comparison 2 Multidisciplinary rehabilitation versus other treatment, Outcome 1 Pain.

Comparison 2 Multidisciplinary rehabilitation versus other treatment, Outcome 2 Disability.
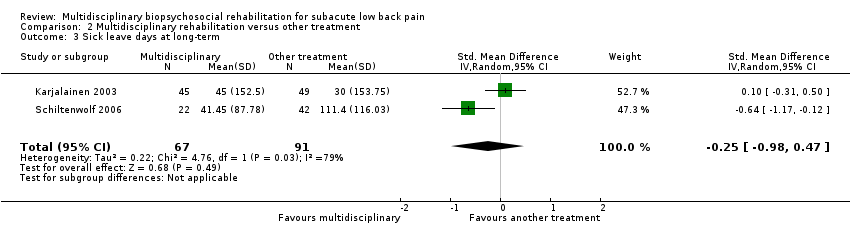
Comparison 2 Multidisciplinary rehabilitation versus other treatment, Outcome 3 Sick leave days at long‐term.
| Patient or population: Subacute low back pain | |||||||
| Outcomes | Anticipated absolute effects* (95% CI) | Relative effect | № of participants | Quality of the evidence (GRADE) | Comments | ||
| Risk with usual care | Risk with multidisciplinary rehabilitation | ||||||
| Back pain long‐term Higher scores indicated more intense pain Follow‐up: median 12 months | The baseline for the most representative study# (Karjalainen 2003) was 5.7 out of 10 (visual analogue scale). | The risk with MBR was approximately 4.67 (4.60 to 4.73) out of 10. | The mean pain in the intervention group was 0.46 standard deviations lower (0.7 lower to 0.21 lower). | 336 | TOTAL = 532 (5 RCTs) | X X X ◯ MODERATE 1 | This was a small to moderate effect (Cohen 1988) that is probably clinically relevant in this participant group. |
| An additional study that could not be included in meta‐analysis showed no difference between the groups. | ‐ | 196 (1 RCT included in qualitative synthesis). | |||||
| Functional disability at the long term Higher scores indicated more disability Follow‐up: median 12 months. | The baseline for the most representative study# (Karjalainen 2003) was 34 out of 100 (Oswestry Scale). | The risk with MBR was approximately 26.30 (25.2 to 27.4) out of 100. | The mean functional disability in the intervention group was 0.44 standard deviations lower (0.87 lower to 0.01 lower). | 240 | TOTAL = 537 (5 RCTs) | X X ◯◯ | This was a small to moderate effect (Cohen 1988) that is probably clinically relevant in this participant group. |
| Two additional studies could not be included in meta‐analysis. One study showed evidence in favour of MBR and the other showed no difference between the groups. | ‐ | 297 (2 RCTs included in qualitative synthesis). | |||||
| Return‐to‐work at the long term Proportion at work Follow‐up: median 12 months. | Study population | OR 3.19 (1.46 to 6.98) | 170 | X ◯◯◯ | This was a moderate effect that is clinically relevant in this participant group. | ||
| 65 per 100 | 86 per 100 | ||||||
| Sick leave periods at long‐term Cumulative sickness absence periods over the course of the 12‐month follow‐up. | Average sick leave in the usual care group was 997.3 hours (Bultmann 2009). | The risk with MBR was approximately 763.03 (743.3 to 782.3) sick leave hours. | The mean sick leave periods in the intervention group was 0.38 standard deviations lower (0.66 lower to 0.10 lower). | 210 | X X ◯◯ | This was a small to moderate effect (Cohen 1988) that is clinically relevant in this participant group. | |
| Adverse events | N/A | NO EVIDENCE | None of the included studies reported on adverse events. | ||||
| *The risk in the intervention group (and its 95% confidence interval) is based on the assumed risk in the comparison group and the relative effect of the intervention (and its 95% CI). #We defined the most representative sample as the study that has the largest weighting in the overall result in RevMan. | |||||||
| GRADE Working Group grades of evidence | |||||||
| 1 Downgraded due to risk of bias, all five trials had high risk of performance bias and detection bias. One trial suffered from unclear risk of selection bias. Another trial suffered from unclear risk of attrition bias (serious bias = 1‐point downgrade). 2 Downgraded due to inconsistency, I2 statistic60% (heterogeneity = 1‐point downgrade). 3 Downgraded due to serious risk of bias, all three trials suffered from risk of performance bias and detection bias. One trial also suffered from unclear risk of selection bias and another trial suffered from unclear risk of attrition bias (very serious bias = 2‐point downgrade). 4 Downgraded due to imprecision, the total number of events was less than 300 (1‐point downgrade). 5 Downgraded due to risk of bias, both trials suffered from risk of performance bias and detection bias. One trial also suffered from unclear risk of attrition bias (serious bias = 1‐point downgrade). 6 Downgraded due to imprecision, total population size < 400 (1‐point downgrade). | |||||||
| Patient or population: Subacute low back pain | ||||||
| Outcomes | Anticipated absolute effects* (95% CI) | Relative effect | № of participants | Quality of the evidence | Comments | |
| Risk with another treatment | Risk with multidisciplinary rehabilitation | |||||
| Pain at the long term Higher scores indicated more intense pain Follow‐up: median 12 months. | The baseline for the most representative study# (Jensen 2011) was 32.7 out of 60 (LBP Rating Scale). | The risk in the MBR group was approximately 31.02 out of 60. | The mean pain in the intervention group was 0.14 standard deviations lower (0.36 lower to 0.07 higher). | 336 | X X ◯◯ | This difference was not statistically or clinically relevant. |
| Functional disability at the long term Higher scores indicated more severe functional disability. Follow‐up: median 12 months. | The baseline for the most representative study# (Jensen 2011) was 15.6 out of 23 (Roland‐Morris). | The risk in the MBR group was approximately 15.45 out of 23. | The mean functional disability in the intervention group was 0.03 standard deviations lower (0.24 lower to 0.18 higher). | 345 | X X ◯◯ | This difference was not statistically or clinically relevant. |
| Return‐to‐work at long‐term | N/A | N/A | N/A | N/A | NO EVIDENCE | None of the studies that compared MBR to another treatment assessed this outcome. |
| Sick leave periods at long‐term Follow‐up: median 24 months. | Average sick leave in the comparison group was 30 days (Karjalainen 2003). | The risk in the MBR group was approximately 4 (0 to 8) sick leave days. | The mean sick leave days in the intervention group was 0.25 standard deviations lower (0.98 lower to 0.47 higher). | 158 | X ◯◯◯ | There was a difference between the groups but the pooled estimate was imprecise and should not be interpreted. |
| Adverse events | N/A | NO EVIDENCE | None of the included studies reported on adverse events. | |||
| #We defined the most representative sample as the study that has the largest weighting in the overall result in RevMan. *The risk in the intervention group (and its 95% confidence interval) is based on the assumed risk in the comparison group and the relative effect of the intervention (and its 95% CI). | ||||||
| GRADE Working Group grades of evidence | ||||||
| 1Downgraded due to imprecision, n < 400 (1‐point downgrade). 2Downgraded due to risk of bias, both trials suffered from high risk of performance bias and detection bias. One trial suffered from unclear risk of attrition bias (serious bias = 1‐point downgrade). 3Downgraded due to imprecision 95% confidence interval includes the no effect and the upper or lower confidence limit crosses an effect size of 0.5 (1‐point downgrade). 4Downgraded due to inconsistency, I2 statistic > 60% (1‐point downgrade). 5Downgraded due to risk of bias, the two trials suffered from high risk of performance bias and detection bias (serious bias = 1‐point downgrade). | ||||||
| Study | Practitioners involved | Methods for interdisciplinary collaboration | Intervention intensity |
| Ergonomist, physiotherapist | "The workplace intervention consisted of a workplace assessment and work adjustments in which all major stakeholders in the return‐to‐work process participated: i.e., the worker, the employer, the occupational physician, and the worker’s general practitioner.” | The entire program consisted of two 1‐hour sessions a week, with 26 sessions maximally (13 weeks) = low intensity | |
| Occupational physician, occupational physiotherapist, chiropractor, psychologist, social worker | “The formulation and implementation of a coordinated, tailored and action‐oriented work rehabilitation plan collaboratively developed by an interdisciplinary team using a feedback guided approach.” | The duration of the intervention was for up to three months; insufficient information to categorize intervention intensity. | |
| Physical therapist, psychologist, physician | “Backs to Work is a coordinated multidisciplinary reconditioning program” | The duration of the intervention was 3 hours per day, 3 days/week for 4 weeks = 36 hours = mid‐intensity | |
| Rehabilitation physician, specialist in clinical social medicine, physiotherapist, social worker, occupational therapist | Coordinated through case manager | The duration of the intervention was 18 weeks, average of 4 meetings with case manager = low intensity | |
| Physician, physiotherapist, company nurse, company physician | Physiotherapist visited patient’s workplace to involve work supervisor and company health care professionals in treatment | The duration of the mini‐intervention was 1.25‐1.5 hours and the worksite visit was approximately 75 minutes = low intensity | |
| Occupational physician, ergonomist, back pain specialist | “All described interventions were provided by a multidisciplinary medical, ergonomic, and rehabilitation staff at the Sherbrooke University Hospital back pain clinic.” | In a previous study using the same protocol (Loisel 1994), the duration of functional rehabilitation therapy ranged from 2 to 13 weeks. Insufficient information to categorize intervention intensity. | |
| Physician, physiotherapist, psychotherapist | This does not appear to be an integrated program. The physiotherapists were blind to treatment condition, indicating no communication between the physiotherapists and psychotherapists. | The duration of the intervention was 6 hours of daily treatment for 15 days in 3 weeks = mid‐intensity | |
| Physician, masters‐level clinician for behavioural medicine intervention | The extent to which health care professionals communicated wasn't clear from the article text. | The duration of the intervention was 6‐10 weeks, 4 hours a week = mid‐intensity | |
| Physical therapy and behavioral medicine sessions “provided by licensed professionals trained in their respective fields;” occupational therapist | Case management sessions and interdisciplinary team conferences held at baseline and discharge. | The duration of the intervention was from 4 to 10 weeks; 6‐9 behavioral medicine sessions; 6‐9 physical therapy sessions; Up to 6 work transitions sessions; one or more case management sessions = low intensity |
| Bias Domain | Source of Bias | PossibleAnswers |
| Selection | (1) Was the method of randomizations adequate? | Yes/No/Unsure |
| Selection | (2) Was the treatment allocation concealed? | Yes/No/Unsure |
| Performance | (3) Was the patient blinded to the intervention? | Yes/No/Unsure |
| Performance | (4) Was the care provider blinded to the intervention? | Yes/No/Unsure |
| Detection | (5) Was the outcome assessor blinded to the intervention? | Yes/No/Unsure |
| Attrition | (6) Was the drop‐out rate described and acceptable? | Yes/No/Unsure |
| Attrition | (7) Were all randomised participants analysed in the group to which they were allocated? | Yes/No/Unsure |
| Reporting | (8) Are reports of the study free of suggestion of selective outcome reporting? | Yes/No/Unsure |
| Performance | (9) Were cointerventions avoided or similar? | Yes/No/Unsure |
| Performance | (10) Was the compliance acceptable in all groups? | Yes/No/Unsure |
| Detection | (11) Was the timing of the outcome assessment similar in all groups? | Yes/No/Unsure |
| Other | (12) Are other sources of potential bias unlikely? | Yes/No/Unsure |
| 1 | A random (unpredictable) assignment sequence. Examples of adequate methods are coin toss (for studies with 2 |
| 2 | Assignment generated by an independent person not responsible for determining the eligibility of the patients. |
| 3 | Index and control groups are indistinguishable for the patients or if the success of blinding was tested among |
| 4 | Index and control groups are indistinguishable for the care providers or if the success of blinding was tested |
| 5 | Adequacy of blinding should be assessed for each primary outcome separately. This item should be scored ‐for patient‐reported outcomes in which the patient is the outcome assessor (e.g., pain, disability): the blinding |
| 6 | The number of participants who were included in the study but did not complete the observation period or |
| 7 | All randomised patients are reported/analysed in the group they were allocated to by randomizations for the |
| 8 | All the results from all prespecified outcomes have been adequately reported in the published report of the |
| 9 | If there were no cointerventions or they were similar between the index and control groups. |
| 10 | The reviewer determines if the compliance with the interventions is acceptable, based on the reported |
| 11 | Timing of outcome assessment should be identical for all intervention groups and for all primary outcome |
| 12 | Other types of biases. For example: |
| Outcome or subgroup title | No. of studies | No. of participants | Statistical method | Effect size |
| 1 Pain Show forest plot | 5 | Std. Mean Difference (IV, Random, 95% CI) | Subtotals only | |
| 1.1 Short‐term | 4 | 272 | Std. Mean Difference (IV, Random, 95% CI) | ‐0.40 [‐0.74, ‐0.06] |
| 1.2 Intermediate‐term | 2 | 155 | Std. Mean Difference (IV, Random, 95% CI) | ‐0.34 [1.00, 0.31] |
| 1.3 Long‐term | 4 | 336 | Std. Mean Difference (IV, Random, 95% CI) | ‐0.46 [‐0.70, ‐0.21] |
| 2 Disability Show forest plot | 4 | Std. Mean Difference (IV, Random, 95% CI) | Subtotals only | |
| 2.1 Short‐term | 4 | 272 | Std. Mean Difference (IV, Random, 95% CI) | ‐0.38 [‐0.63, ‐0.14] |
| 2.2 Intermediate‐term | 2 | 151 | Std. Mean Difference (IV, Random, 95% CI) | ‐0.44 [‐1.09, 0.22] |
| 2.3 Long‐term | 3 | 240 | Std. Mean Difference (IV, Random, 95% CI) | ‐0.44 [‐0.87, ‐0.01] |
| 3 Return‐to‐work at long‐term Show forest plot | 3 | 170 | Odds Ratio (IV, Random, 95% CI) | 3.19 [1.46, 6.98] |
| 4 Sick leave periods at long‐term Show forest plot | 2 | 210 | Std. Mean Difference (IV, Fixed, 95% CI) | ‐0.38 [‐0.66, ‐0.10] |
| Outcome or subgroup title | No. of studies | No. of participants | Statistical method | Effect size |
| 1 Pain Show forest plot | 3 | Std. Mean Difference (IV, Random, 95% CI) | Subtotals only | |
| 1.1 Short‐term | 2 | 165 | Std. Mean Difference (IV, Random, 95% CI) | ‐0.09 [‐0.50, 0.33] |
| 1.2 Intermediate‐term | 2 | 162 | Std. Mean Difference (IV, Random, 95% CI) | ‐0.64 [‐1.85, 0.57] |
| 1.3 Long‐term | 2 | 336 | Std. Mean Difference (IV, Random, 95% CI) | ‐0.14 [‐0.36, 0.07] |
| 2 Disability Show forest plot | 3 | Std. Mean Difference (IV, Random, 95% CI) | Subtotals only | |
| 2.1 Short‐term | 2 | 165 | Std. Mean Difference (IV, Random, 95% CI) | ‐0.00 [‐0.34, 0.34] |
| 2.2 Intermediate‐term | 2 | 162 | Std. Mean Difference (IV, Random, 95% CI) | ‐0.49 [‐1.50, 0.51] |
| 2.3 Long‐term | 2 | 345 | Std. Mean Difference (IV, Random, 95% CI) | ‐0.03 [‐0.24, 0.18] |
| 3 Sick leave days at long‐term Show forest plot | 2 | 158 | Std. Mean Difference (IV, Random, 95% CI) | ‐0.25 [‐0.98, 0.47] |