Regímenes de radioterapia paliativa para pacientes con síntomas torácicos de cáncer de pulmón de células no pequeñas
Resumen
Antecedentes
La radioterapia paliativa al tórax se usa frecuentemente en los pacientes con cáncer de pulmón, pero los regímenes de radioterapia empleados se basan más en la tradición que en resultados de investigaciones. Ésta es una actualización de una revisión Cochrane publicada por primera vez en 2001 y actualizada previamente en 2006.
Objetivos
Los dos objetivos de esta revisión fueron:
1. Evaluar los efectos de diferentes regímenes de radioterapia paliativa sobre la mejoría de los síntomas torácicos en pacientes con cáncer de pulmón de células no pequeñas localmente avanzado o metastásico que no son apropiados para RT radical administrada con intención curativa.
2. Evaluar los efectos de la dosis de radioterapia sobre la supervivencia general en pacientes con cáncer de pulmón de células no pequeñas localmente avanzado o metastásico que no son apropiados para RT radical administrada con intención curativa.
Métodos de búsqueda
Se utilizaron las bases de datos electrónicas MEDLINE (1966 ‐ enero de 2014), EMBASE y el Registro Cochrane Central de Ensayos Controlados (Cochrane Central Register of Controlled Trials), las listas de referencias, la búsqueda manual en revistas y actas de congresos y la discusión con expertos para identificar los ensayos potencialmente elegibles, publicados y no publicados.
Dos autores de la revisión (FM y RS) de forma independiente identificaron todos los estudios que podían ser adecuados para su inclusión en la revisión.
Se actualizó la búsqueda hasta enero de 2014.
Criterios de selección
Ensayos clínicos controlados aleatorizados que compararon diferentes regímenes de radioterapia paliativa en pacientes con cáncer de pulmón de células no pequeñas.
Obtención y análisis de los datos
Los autores de la revisión evaluaron los resultados de la búsqueda de forma independiente, se pusieron de relieve los posibles estudios y se obtuvo el texto completo. Se extrajeron los datos y se intentó establecer contacto con los autores originales para obtener la información faltante.
La medida de resultado primaria fue la mejoría en los síntomas torácicos graves (grado y duración). Las medidas de resultado secundarias fueron los efectos tóxicos a corto y largo plazo, el efecto sobre la calidad de vida y la supervivencia general.
Los resultados informados por el paciente se informaron de manera descriptiva. Los datos cuantitativos como la supervivencia y la toxicidad se analizaron como variables dicotómicas y se informaron mediante los riesgos relativos (RR).
Para esta actualización de la revisión, se llevó a cabo un metanálisis de los datos de supervivencia.
Resultados principales
Se incluyeron catorce ensayos controlados aleatorizados (3576 pacientes), sin nuevos estudios añadidos en esta actualización.
Hubo diferencias importantes en las dosis de radioterapia investigadas, las características de los pacientes que incluyen el estadio de la enfermedad, el estado funcional y las medidas de resultado. Las dosis de RT investigadas variaron de 10 Gy en una fracción (10 Gy/1F) a 60 Gy/30F por más de seis semanas, con un total de 19 regímenes de dosis / fraccionamiento diferentes.
Se identificaron sesgos potenciales en algunos estudios. Los métodos de asignación al azar, de evaluación de los síntomas y los métodos estadísticos utilizados estaban poco claros en algunos artículos. Se contabilizaron los retiros y abandonos en todos menos en un estudio.
Los 13 estudios que investigaron los síntomas informaron que los síntomas torácicos graves mejoraron después de la RT. No hay pruebas sólidas de que algún régimen proporcione mayor paliación. Los regímenes con dosis mayores pueden provocar más toxicidad aguda y algunos regímenes se asocian con un mayor riesgo de mielitis por radiación. La variación al informar los efectos tóxicos, en particular la falta de una clasificación clara, significa que los resultados del metanálisis se deben tratar con precaución.
En esta actualización, se incluye el metanálisis de la supervivencia general estratificada por el estado funcional, que es una variable clave. Se solicitó información adicional a todos los autores originales si no se incluyeron los datos estratificados en la publicación original. Tres estudios publicados contenían datos suficientes y siete autores pudieron proporcionar información adicional que representó a 1992 pacientes (56% de todos los pacientes). La falta de datos de casi la mitad de los pacientes ha afectado la calidad de la evidencia.
El metanálisis no mostró diferencias significativas en la supervivencia general al año entre los regímenes con menos fracciones de radioterapia en comparación con los regímenes con más fracciones de radioterapia cuando los pacientes se estratificaron por el estado funcional. Los resultados del metanálisis de la supervivencia general al año en los pacientes con buen estado funcional (estado funcional 0‐1 de la OMS) mostraron una heterogeneidad moderadamente alta y no se consideró de valor un resultado resumido. Los resultados de la supervivencia general al año de los pacientes con estado funcional deficiente fue RR 0,96 (IC del 95%: 0,91 a 1,02; calidad moderada de la evidencia).
Conclusiones de los autores
La radioterapia en los pacientes con cáncer de pulmón de células no pequeñas incurable puede mejorar los síntomas torácicos. Se debe tener precaución con la dosis a la médula espinal para reducir el riesgo de mielopatía por radiación. Los regímenes de radioterapia paliativa con dosis mayor, más fraccionados, no proporcionan una paliación mejor o más duradera y su administración para prolongar la supervivencia no está apoyada por evidencia sólida. Se necesitan más estudios de investigación para reducir la toxicidad aguda de los regímenes con fracciones grandes, así como sobre la función de la radioterapia radical en comparación con la radioterapia paliativa con dosis altas. En el futuro, puede ser difícil realizar grandes ensayos para comparar diferentes regímenes de RT debido al mayor uso de la quimioterapia sistémica. Es necesario realizar ensayos dirigidos a mejorar la integración de estas dos modalidades, en particular en pacientes con buen EF.
PICO
Resumen en términos sencillos
Comparación del efecto de diferentes ciclos de radioterapia al tórax para los pacientes con cáncer de pulmón incurable
Pregunta de la revisión
¿Cuál es la mejor manera de administrarles radioterapia a los pacientes con cáncer de pulmón incurable? ¿Qué dosis proporcionan el mejor equilibrio entre el control de los síntomas y los efectos secundarios? ¿Administrar más radioterapia mejora las probabilidades del paciente de estar vivo en uno o dos años?
Antecedentes
En la mayoría de los países desarrollados, el cáncer de pulmón es uno de los tumores más frecuentes. Sólo 10% al 20% de los pacientes pueden ser tratados quirúrgicamente con perspectivas de curación. En muchos otros pacientes, la radioterapia al tórax se utiliza para aliviar los síntomas de tos, disnea y dolor. El número de tratamientos de radioterapia y la dosis de cada tratamiento varía ampliamente en todo el mundo. Desde finales de los años ochenta, muchos ensayos han tratado de responder cuál es el mejor esquema de radioterapia para aliviar los síntomas sin causar demasiados efectos secundarios.
Características de los estudios
Se encontraron 14 ensayos con 3576 pacientes que compararon al menos dos regímenes de radioterapia diferentes. Todos incluyeron pacientes con cáncer de pulmón incurable, pero el grado del cáncer y el estado físico de los pacientes variaron entre los estudios, lo que hizo difícil las comparaciones directas. Los regímenes de radioterapia en los ensayos variaron desde un tratamiento único hasta 30 tratamientos en el transcurso de seis semanas. Esta actualización no encontró nuevos ensayos y se realizó un metanálisis (que agrupó los resultados de todos los ensayos) para determinar si administrar dosis mayores de radiación dio lugar a una supervivencia más larga.
Todos los ensayos informaron cuánto tiempo vivieron los pacientes después del tratamiento y analizaron el efecto sobre los síntomas, además de registrar los efectos secundarios. Sin embargo, los ensayos no utilizaron los mismos métodos para registrar los síntomas y los efectos secundarios, ya que algunos utilizaron la evaluación del médico y algunos utilizaron la del paciente, lo que dificultó la comparación directa.
Resultados clave
Esta revisión muestra que un ciclo corto de radioterapia, con sólo una o dos visitas, mejora los síntomas frecuentes en la mayoría de los pacientes con tanta efectividad como los ciclos más prolongados, sin más efectos secundarios. No hay evidencia sólida para apoyar el criterio de que un ciclo más largo de radioterapia puede brindar mayores probabilidades de vivir uno o dos años, pero provoca más efectos secundarios inmediatos, especialmente deglución dolorosa.
Calidad de la evidencia
Todos los ensayos fueron aleatorizados, lo que significa que los pacientes involucrados en el estudio tuvieron iguales probabilidades de recibir cualquiera de los tratamientos. El uso de la evaluación del médico de los síntomas del paciente en algunos estudios puede haber dado lugar a un subestimación de los síntomas.
Authors' conclusions
Summary of findings
| More fractionated thoracic radiotherapy compared with less fractionated radiotherapy for non small cell lung cancer treated with palliative intent | ||||||
| Patient or population: adults with non small cell lung cancer who are not felt to be curable Settings: specialist oncology units offering external beam radiotherapy Intervention: More fractionated thoracic radiotherapy Comparison: Less fractionated radiotherapy | ||||||
| Outcomes | Illustrative comparative risks* (95% CI) | Relative effect | No of Participants | Quality of the evidence | Comments | |
| Assumed risk | Corresponding risk | |||||
| Fewer fractions | More fractions | |||||
| 1 year overall survival in patients of good performance status (WHO performance status 0‐1) | The mean 1 year overall survival was 25.6% and ranged across control groups from | The mean 1 year overall survival in the intervention groups was higher at | 1081 | ++OO | Heterogeneity considered too great for presentation of summary statistic. Not complete data set as unable to get additional data from all authors, high level of heterogeneity | |
| 1 year overall survival in patients of poor performance status (WHO performance status 2‐4) | The mean 1 year overall survival was 14.6% and ranged across control groups from | The mean 1 year overall survival in the intervention groups was higher at 17.5% (9.1% to 28.6%) | RR 0.96 (0.91 to 1.02) | 911 | +++O | Not complete data set as unable to get additional data from all authors |
| Oesophagitis (grade 3 to 4) | The mean 22.3% ranged across control groups from 0% to 50% | The mean rate of grade 3‐4 oesophagitis in the intervention groups was higher at 25.7% | RR 1.23 (0.81 to 1.87) | 1301 (8 studies) | ++OO | Not reported in all trials. Some reported as patient reported toxicity others physician assessed toxicity |
| Radiation Myelopathy (any grade) | The mean 0.30% ranged across control groups from | The mean rate of radiation myelopathy in the intervention groups was higher at 0.38% (0% to 1.61%) | RR 1.29 (0.37 to 4.51) | 2663 (11 studies) | +++O | Reported in most but not all studies. Not graded and most not confirmed at post‐mortem. |
| Radiation pneumonitis (any grade) | The mean 3.9% ranged across control groups from | The mean rate of radiation pneumonitis in the intervention groups was lower at 2.4% (1.6% to 4%) | RR 0.62 (0.23 to 1.66) | 533 (3 studies) | ++OO | Not reported in the majority of trials and not graded. |
| *The basis for the assumed risk (e.g. the median control group risk across studies) is provided in footnotes. The corresponding risk (and its 95% confidence interval) is based on the assumed risk in the comparison group and the relative effect of the intervention (and its 95% CI). | ||||||
| GRADE Working Group grades of evidence | ||||||
Background
Description of the condition
Lung cancer is one of the commonest malignant tumours for both men and women in developed countries and an increasing problem in developing countries (Boyle 2000). The majority of patients (66% to 74.3% in the most recent UK National Lung Cancer Audit; NLCA 2013) have non‐small cell lung cancer (squamous cell, adeno‐ and large cell undifferentiated carcinomas), of whom only 15 to 25% will have tumours that are potentially curable. The remainder are thought incurable, either because of the extent of local tumour, poor medical fitness of the patient or because of known metastases.
Description of the intervention
Radiotherapy (RT) to the primary tumour in the chest has been used to treat patients for many years. Although high dose, radical RT can be used in a small number of patients with the intention of long term disease control or cure, it is more often used in lower doses with the aim of controlling (palliating) troublesome local symptoms, most commonly cough, haemoptysis, chest pain and breathlessness. It is therefore an important treatment in the overall management of patients with this common disease. Estimates of clinical practice in the UK suggest that the treatment of lung cancer constitutes 20‐25% of radiation oncologists' time, 90% of treatments are palliative (Maher 1993) and that around 20% ‐30% of patients with lung cancer get palliative RT (Thorogood 1992).
Why it is important to do this review
The dose regimens for palliative RT evolved empirically from clinical experience and surveys in Europe and the USA in the early 1990s showed widespread variation in clinical practice (Maher 1992). However the regimens were not subject to rigorous evaluation in clinical trials until the late 1980s and 1990s.
Patients with advanced non‐small cell lung cancer (NSCLC) are increasingly being treated first with chemotherapy (NSLCCG 1995). Nevertheless, palliative RT is still an important treatment option for patients who are symptomatic either because they have not responded to chemotherapy, have relapsed, or have contra‐indications to potentially toxic drugs. However, it has not yet been clearly established which RT regimens give the most benefit and least toxicity. The effect of varying radiotherapy regimens on survival is also not clearly established but a published meta‐analysis concluded that improvement in survival favoured high dose radiotherapy although patients were more likely to experience toxicity and would require a greater investment of time.(Fairchild 2008) It is important to try and identify any sub‐groups who may benefit from longer duration of treatment.
Objectives
The two objectives of this review were:
1. To assess the effects of different palliative radiotherapy regimens on improving thoracic symptoms in patients with locally advanced or metastatic non‐small cell lung cancer who are not suitable for radical RT given with curative intent.
2. To assess the effects of radiotherapy dose on overall survival in patients with locally advanced or metastatic non‐small cell lung cancer who are not suitable for radical RT given with curative intent.
Methods
Criteria for considering studies for this review
Types of studies
Randomised controlled clinical trials (RCTs), fully published in journals and those identified from other sources (abstracts and proceedings of relevant scientific meetings, and contact with investigators) for which full details were available from the investigators. An RCT is a study in which people are allocated at random (by chance alone) to receive one of several clinical interventions. One of these interventions is the standard of comparison or control.
Types of participants
Patients with histologically or cytologically confirmed (or a high clinical likelihood of) lung cancer of non‐small cell type, locally advanced or metastatic and with thoracic symptoms.
Types of interventions
External beam, megavoltage RT to the chest given with palliative intent (i.e. with the intent of controlling symptoms, not cure) with a total tumour dose of less than 60 Gy in 2 Gy fractions, or its radiobiological equivalent. The doses given and their prescription points must have been clearly defined. RT with endobronchial brachytherapy and combination treatment with RT and chemotherapy were not considered. Studies must have compared at least two RT dose/fractionation regimens. Studies comparing immediate versus delayed treatment were not considered.
Types of outcome measures
Primary outcomes
Improvement of major thoracic symptoms for instance cough, chest pain, haemoptysis or breathlessness, both degree and duration
Secondary outcomes
Any measure of Quality of life (QoL)
Short‐term toxicity i.e. occurring within 90 days of treatment
Long‐term toxicity i.e. occurring more than 90 days after treatment
Radiological Response Rates
Survival from date of randomisation or first treatment.
Search methods for identification of studies
Two authors (RS and FM) reviewed all search results independently to identify potential studies that may be applicable to this review.
Electronic searches
Electronic searching of the Cochrane Central Register of Controlled Trials (CENTRAL) using the following strategy:
(Carcinoma and bronch*) or (lung and cancer) and radiotherapy and palliat* (Appendix 1) performed 14.01.2014.
Electronic search of MEDLINE and EMBASE using the strategies listed in Appendix 2 and Appendix 3 performed on 14.01.2014. All records from 1966 to Jan 2014 were searched.
Searching other resources
Reference lists from identified studies and other relevant publications were scrutinised. For the original review, hand searches were carried out in the following journals from January 1990 to January 2006: Journal of Clinical Oncology; Clinical Oncology; Lung Cancer; Radiotherapy and Oncology; International Journal of Radiation Oncology, Biology and Physics; Thorax; Chest; American Journal of Clinical Oncology. The abstracts from the following conferences were hand searched from 2006 to 2011: ASCO, AACR,ECCO. (Date of search 23.12.2011). As none of these hand searches identified additional studies further hand searches were not performed.
Colleagues, collaborators, and other experts were contacted regarding on‐going and unpublished trials.
Data collection and analysis
Selection of studies
The randomised trials identified by the search were assessed to establish if pre‐determined inclusion criteria were met. Three independent reviewers (RS, FM, ET) assessed the included trials for methodological quality using guidelines set out in the Cochrane Handbook (Higgins 2011). Each trial was assessed on randomisation, inclusion/exclusion criteria, assessment of adverse effects, quality of life assessment, data completeness, statistical methods and follow up. No formal scoring system was used.
Data extraction and management
Data were extracted from included studies using guidelines set out in the Cochrane Handbook (Higgins 2011). Where necessary, information was sought from the principal investigator of the trial concerned. Further data about outcome by performance status was sought from all the original authors if it was not included in the published data. The reviewers recorded data on data collection forms and RS compiled the data.
Assessment of risk of bias in included studies
RS assessed the risk of bias using the domains suggested in the Cochrane Handbook (Higgins 2011) (random sequence generation, allocation concealment, blinding, incomplete outcome data, selective reporting and other biases). Studies were considered to be at low risk of bias when true randomisation occurred, when there was blinding of assessors to treatment received, when patient reported outcome measures were assessed using patient diaries, when all patients were accounted for and included in the analysis on an intention to treat basis and when all outcome measures are reported. Other factors that may produce bias such as use of chemotherapy and percentage of patients with histological confirmation of lung cancer were also assessed. No attempt at concealing the bibliographical details during risk of bias assessment was made as many of the studies were well known to the reviewers. FM then reviewed the risk of bias assessment and if there was disagreement, further discussions were held to reach a consensus. Risk of bias is summarised in the results section and presented as a risk of bias table.
Measures of treatment effect
Treatment effect can be divided into two main groups, quantitative and patient reported outcomes.
Quantitative data such as survival and toxicity were analysed as dichotomous variables and expressed using relative risks (RR). It was unlikely that suitable time to event data would be available to analyse survival as a continuous variable. Adverse events were analysed as absent or present as most reports did not provide sufficient data to allow analysis of toxicity scores as ordinal variables.
Patient reported outcomes such as quality of life and symptomatic responses were assessed in a variety of ways in the different trials and so no attempt was made to combine these numerically. Instead, a descriptive approach was taken.
Unit of analysis issues
Studies with multiple treatment groups.
Three trials had more than two intervention arms (Reinfuss 1999;Simpson 1985Sundstrom 2004). It was decided that, if suitable data were available, for the Reinfuss 1999 paper the two arms which had immediate intervention would be used. For the Simpson paper, arm A (40Gy/20# split course) and arm C (40Gy/20#) would be combined as they had equal numbers of fractions. They would be compared to arm B (30Gy/10#). For the Sundstrom paper arm A (17Gy/2#) and arm C (50Gy/25#) would be included in the meta‐analysis as these had the largest and smallest number of fractions.
Assessment of heterogeneity
Clinical diversity was assessed by documenting the patient groups represented in each study focusing on key factors such as histological confirmation of diagnosis, age, disease stage and performance status. Methodological diversity was assessed by documenting trial design, in particular focusing on radiotherapy dose and fractionation and the assessment methods of tumour response and symptoms. Heterogeneity of quantitative data was assessed by calculating I2. I2 values were interpreted using the guide in the Cochrane Handbook (Higgins 2011) (I2 values of 75% to 100% are likely to represent considerable heterogeneity, values between 50% and 90% are likely to represent substantial heterogeneity, values between 30% and 60% are likely to represent moderate heterogeneity and values between 0% and 40% might not be important) and correlated with the data on clinical and methodological diversity.
Data synthesis
Quantitative outcomes were planned to be evaluated using RevMan 5.3 (RevMan 2014). Time to death analysis was planned to be approximated by analysing for different follow‐up periods, or by calculating a weighted average of median survival across studies. A fixed effects model was planned to be used for the primary analysis if appropriate.
If suitable time to event data was not available for assessment of survival then 1 and 2 year overall survival will be analysed.
One year survival would be analysed as a dichotomous variable.
If heterogeneity was deemed to be small, a fixed effects model would be used but where heterogeneity appeared large, a random effects model would also be used. If there was too great heterogeneity defined as I2 greater than 50% the summary statistic would not be presented in the forest plot. Results were expressed as risk ratios (RR). Analysis was done using the Revman software which uses the Mantel Haenszel method rather than the inverse variance model to allow for small study sizes.Greenland 1992; Mantel 1959
The clinical differences between the trials identified in the original review meant that meta‐analysis was only likely to produce useful results if sub‐group analysis was possible. The method of staging was not specified in many of the papers and it was felt that many patients may have been understaged due to lack of cross‐sectional imaging which would introduce bias. For this reason, sub‐group analysis by tumour stage was not attempted.
Performance status scores are clearly defined, easily assessed and have not altered in the time period covered by the published studies. They are known to have an impact on prognosis in advanced stage NSCLC and it was felt to be a suitable variable for sub‐group analysis. Attempts were made to contact all the authors of the studies to get further information on survival in the sub‐groups PS 0‐1 and PS 2‐4. For those studies that used the Karnofsky score, a conversion was made with Karnofsky score greater than or equal to 80 being considered as PS 0‐1.
Adverse events were analysed as dichotomous variables using a fixed effects model unless heterogeneity was high when a random effects model was used. Results were expressed as RR.
Summary of findings table
Results of the meta‐analyses were included in a summary of findings table summary of findings Table for the main comparison. RS made an assessment of the quality of evidence and this was confirmed by FM. If disagreement occurred, further discussions were held until consensus was reached. A GRADE approach to assessing quality of evidence was used as outlined in the Cochrane Handbook (Higgins 2011). Only quantitative data was included in the summary of findings table and assessment of qualitative data is confined to the main text of the review.
Results
Description of studies
Results of the search
See Figure 1

Study flow diagram for searches 2008‐2014.
A total of 14 RCTs which compared RT regimens and met the inclusion criteria were identified. All 14 had been published (Simpson 1985; Teo 1988; Abratt 1995; MRC 1991; MRC 1992; MRC 1996; Nestle 2000; Rees 1997; Reinfuss 1999; Bezjak 2002; Sundstrom 2004; Erridge 2005; Kramer 2005; Senkus‐Konefka 2005). One new trial Mohamed 2012 was identified as an abstract but the detailed results were not available even after attempting to contact the author.
Included studies
A summary of the characteristics of the included studies can be found in Characteristics of included studies
A total of 3708 patients were randomised in these RCTs, of whom 3576 were evaluable and reported.
Eleven studies had two‐way comparisons (Abratt 1995; MRC 1991; MRC 1992; MRC 1996; Nestle 2000; Rees 1997; Teo 1988; Erridge 2005; Kramer 2005; Bezjak 2002; Senkus‐Konefka 2005)and three had three arms (Simpson 1985; Sundstrom 2004; Reinfuss 1999). In one three‐arm study (Reinfuss 1999) the third arm was 'delayed' RT, given when the patients became symptomatic. Data from this arm are shown in the table of characteristics of included studies, but were not used in drawing conclusions on effectiveness or toxicity.
The doses of RT investigated ranged from 10 Gy in 1 fraction (10Gy/1F) to 60 Gy/30Fover six weeks, with a total of 19 different dose/ fractionation regimens. The biologically equivalent doses for acute reacting tissues (BED10), for carcinoma cells (BED25) and spinal cord (BED1.7) as suggested by Singer 1998 are presented for comparison in Table 1. In only one study (Nestle 2000) was one arm of the study a dose (60 Gy in 30 fractions) that would be normally considered as 'radical' and potentially curative, with a BED10 in excess of 70 Gy.
| RT REGIMEN | STUDY | BED(10): Gy | BED(25): Gy | BED(1.7): Gy |
| 60Gy/39F/6W | Nestle 2000 | 72 | 65 | 131 |
| 50Gy/25F/5W | Reinfuss 1999; Sundstrom 2004 | 60 | 54 | 109 |
| 45Gy/15/3.5W (4 days per week) | Abratt 1995 | 59 | 50 | 109 |
| 45Gy/18F/3.4W | Teo 1988 | 56 | 50 | 111 |
| 40GY/10F/4W(split) | Reinfuss 1999; Simpson 1985 | 56 | 46 | 134 |
| 42Gy/15F/3W | Sundstrom 2004 | 54 | 47 | 111 |
| 39Gy/13F/2.4W | MRC 1996 | 51 | 44 | 108 |
| 40Gy/20F/4W | Simpson 1985 | 48 | 43 | 87 |
| 36Gy/12F/2.3W | MRC1996 | 47 | 40 | 100 |
| 35Gy/10F/2.2W (4 days per week) | Abratt 1995 | 47 | 40 | 107 |
| 32Gy/16F/10d (twice daily) | Nestle 2000 | 38 | 35 | 70 |
| 31.2Gy/4F/4W (weekly) | Teo 1988 | 55 | 41 | 174 |
| 30Gy/10F/2W | MRC 1991, Simpson 1985, Kramer 2005, Erridge 2005 | 39 | 34 | 83 |
| 27Gy/6F/2W (3 days per week) | MRC 1991 | 39 | 32 | 98 |
| 22.5Gy/5F/5d | Rees 1997 | 33 | 27 | 82 |
| 20Gy/5F/5d | Senkus‐Konefka 2005, Bezjak 2002 | 28 | 23 | 67 |
| 17Gy/2F/8d (weekly) | MRC 1991, MRC 1992, MRC 1996, Rees 1997, Sundstrom 2004 | 31 | 23 | 102 |
| 16Gy/2F/8d (weekly) | Senkus‐Konefka 2005, Kramer 2005 | 29 | 21 | 91 |
| 10Gy/1F/1d | MRC 1992, Bezjak 2002, Erridge 2005 | 20 | 14 | 69 |
| BED(y): biologically effective dose (Gy), calculated by the formula: BED(y) = n x d (1+ d/ (alpha/beta)), where n=number of fractions, d= size of each fraction(Gy), and alpha/beta is constant, of value y, for a given tissue type (Fowler 1989, Joiner 1997) |
The studies included slightly different patient groups. The majority included only patients with histologically or cytologically proven NSCLC but one trial (Rees 1997) included 19% of patients in whom a histological diagnosis had not been made. Two studies (Rees 1997; Erridge 2005) included a few patients with small cell lung cancer (3% and 6% respectively). Another (Teo 1988) included 2 patients with bronchial carcinoid tumours. Inclusion of these patients is unlikely to influence the assessment of palliation or toxicity but might affect the survival results.
More important is the performance status (PS) of the patients. PS is a well known major determinant of prognosis in these patients. The Eastern Cooperative Oncology Group (ECOG) PS scale scores patients 0 to 4, with 0 being the best and 4 the worst score for living patients.Only one study (MRC 1992) specifically included patients with poor PS (ECOG 2 or worse). Kramer 2005 included ECOG PS 3 to 4 patients, or PS 0 to 2 patients with metastatic disease. Five studies (Abratt 1995; MRC 1996; Nestle 2000; Reinfuss 1999; Simpson 1985) only included patients with better PS (ECOG 0‐2), while four (MRC 1991; Rees 1997; Teo 1988; Sundstrom 2004) included patients with any PS. One study (Senkus‐Konefka 2005) excluded patients with PS 0, and two studies excluded PS 4 patients (Bezjak 2002; Erridge 2005).
Age data are reported differently in different studies. All but one (Simpson 1985) which excluded those over 75 years, included patients of any age. But the age ranges do seem to be different. Reinfuss 1999 did not exclude older patients, but only 43% of the population were over 60. In contrast, the five British studies (MRC 1991; MRC 1992; MRC 1996; Rees 1997; Erridge 2005) had between 59% and 77% of patients over 65 years. Although age has not been shown to be an independent prognostic factor, it may reflect co‐morbidity and give information about case selection.
Finally, one study (Reinfuss 1999) included patients who were asymptomatic, because in one arm of the trial RT was only given when the patients were, or became symptomatic. This arm addresses a different research question. Again it seemed reasonable to include data from the two 'immediate RT' arms in the comparative assessment of survival benefit.
Different outcomes were measured and reported in these studies. All reported survival as an outcome, although in the context of a palliative treatment this may be less important than the measurement of symptom control and quality of life (QOL).
The assessment of symptoms, both tumour related and treatment toxicity, as part of a RCT is difficult and the methodology for collecting and analysing the data have evolved and been validated during the time period of these trials (Aaronson 1993; Fayers 1991; Montazeri 1996; Hopwood 1994). There was no standard methodology for assessing symptoms and their change with time, nor for interpreting the data.
Seven studies (MRC 1991; MRC 1992; MRC 1996; Nestle 2000; Bezjak 2002; Sundstrom 2004; Senkus‐Konefka 2005) used the most thorough and systematic symptom assessment, with records of both the clinicians' and patients' assessment at each time point using validated instruments. The MRC studies also pioneered the use of daily diary cards (Fayers 1991) which gave particular insights into the time course of radiation oesophagitis and other acute symptoms following treatment. Two studies (Rees 1997; Kramer 2005) used only patient questionnaires. Four studies (Abratt 1995; Simpson 1985; Teo 1988; Erridge 2005) appear to have relied entirely on the clinicians' assessment of symptoms, which has been shown to underestimate symptoms compared to the patients' own assessment (Stephens 1997). Reinfuss 1999 did not specifically assess symptoms and only assessed tumour response radiologically.
Three studies reported QOL outcomes using validated tools (Sundstrom 2004; Bezjak 2002; Erridge 2005). Erridge 2005 used the patient‐completed Spitzer QOL index at baseline and after RT. Sundstrom 2004 used the European Organisation for Research and Treatment of Cancer (EORTC) QOL questionnaire (QLQ‐C30) and EORTC QOL questionnaire‐lung cancer‐specific module (LC13) at baseline, 2 and 6 weeks after RT and 8‐weekly thereafter up to 54 weeks. Bezjak 2002 used QLQ‐C30 and the Lung Cancer Symptom Scale (LCSS) at baseline at 1 month after RT.
It is therefore clear that these 14 studies are heterogeneous in the dose regimens compared, in the age and PS of the patients recruited and in the way in which key outcomes were assessed and reported. As a result in previous versions of this review formal meta‐analysis of the numerical data was felt to be inappropriate and only narrative synthesis was attempted. However for this update we decided to attempt a meta‐analysis and to explore heterogeneity more formally.
Further information on 1 year survival by performance status and treatment arm was sought from the corresponding authors in 2011 to allow sub‐group analysis. MRC 1991,MRC 1992; MRC 1996, Senkus‐Konefka 2005, Erridge 2005 and Kramer 2005 were able to provide additional data and Nestle 2000, Sundstrom 2004 and Bezjak 2002 had sufficient data in the published data. These have been included in the meta‐analysis.(Analysis 3.1) This represents 1992 patients out of a total of 3576 patients (56%).
The authors were satisfied that these papers had robust follow‐up with virtually no patients lost to follow‐up. The length of time since original publication meant there was insufficient data to do a time‐to event analysis but data was obtained for survival at 1 year broken down by performance status and treatment received.
One year survival was analysed as a dichotomous variable using a random effects model (high levels of heterogeneity). Two year survival was not analysed because of the extremely small number of survivors at 2 years.
The published meta‐analysis Fairchild 2008 attempted to calculate a biological equivalent dose (BED) for each of the radiotherapy regimens used and compare the effect of higher BED on survival. This approach led to difficulties in some comparisons when the BED was calculated to be similar in each arm. Instead, we divided the radiotherapy regimens into more fractionated or less fractionated regimens to test the hypothesis that more fractionated regimes may result in higher survival at one year.
Excluded studies
The literature search identified a number of randomised trials comparing RT with chemotherapy alone or in combination, which were not included (see Characteristics of excluded studies). Two studies, one randomised Exposito 1994 and one non‐randomised Carroll 1986 compared palliative RT with 'best supportive care' (Exposito 1994) or with delayed palliative RT (Carroll 1986). Neither were included. A further study Mohamed 2012 did appear to meet the inclusion criteria but has only been published in abstract and has insufficient data to be included in this review.
Risk of bias in included studies
Studies were assessed for risk of bias in the following categories: random sequence generation, allocation concealment, incomplete outcome data, selective reporting and other potential biases such as method of assessing symptoms, method of assessing tumour response,use of chemotherapy, rates of histological confirmation of diagnosis and inclusion of other lung cancer types. See Figure 2. None of the studies concealed the treatment given from the patients or treating physicians. This is standard in radiotherapy trials when concealment of allocation is difficult and prescription of radiotherapy is heavily regulated. For this reason, assessment of blinding of participants is not included in the risk of bias table. It was felt that blinding of treatment received was unlikely to affect bias when considering survival data.

Methodological quality summary: review authors' judgements about each methodological quality item for each included study.
All the studies included in this review were prospective randomised studies. The method of randomisation was not always clearly stated. The entry criteria and treatment options (including adequate technical details of the RT regimens) were clearly stated in all studies.
There were five studies (Simpson 1985; Sundstrom 2004; Teo 1988; Kramer 2005; Erridge 2005) in which there was a discrepancy between the numbers of patients randomised and those evaluated for outcomes. Of these, Kramer 2005 and Sundstrom 2004 included all patients in the survival analyses although not in other outcome measures.
In Simpson 1985, although 409 patients were randomised, only 316 were included in the final analysis. 45% of the patients that were excluded had been allocated to treatment but failed to complete the treatment due to failing health or patient choice. These should have been included in an intention to treat analysis.
A smaller percentage of patients were excluded from the analysis in Teo 1988. In this study, 291 patients were randomised but only 273 were included in the analysis. Patients were excluded if they refused treatment before or early after the commencement of radiation without apparent reason. Patients who died during treatment were included in the survival analysis.
In Erridge 2005, follow‐up data were not available on 23 of the 149 patients initially randomised. This was due to death before follow‐up (19), missing data forms (2) and failure of patients to attend follow‐up (2). All patients were included in the survival calculations with the exception of a single patient whose initial assessment form was missing.
In none of the studies was it reported that the clinicians who assessed response were blind to the allocation of treatment.
Two studies included patients with small cell lung cancer (SCLC). 6% of patients in Erridge 2005 had SCLC but these were evenly distributed between the two treatment arms and unlikely to introduce bias.3% of patients in Rees 1997 had SCLC and all these patients were in the two fraction arm, leading to possible bias. In addition, 19% of patients in Rees 1997 did not have a histological diagnosis.
The methods of symptom assessment and toxicity varied between studies in detail and quality. The use of physician assessment of symptoms and toxicities could lead to under‐estimation. Physician assessment was used in Abratt 1995 and the method of assessing symptoms was not stated in Reinfuss 1999; Simpson 1985 and Teo 1988. Grading of symptoms was inconsistent across the studies with some using common toxicity criteria grades, others describing toxicities in terms of mild/moderate/severe and some only reporting the presence or absence of toxicity.
Tumour radiological response was reported in 6 studies (Abratt 1995; MRC 1991; Nestle 2000; Reinfuss 1999; Senkus‐Konefka 2005; Simpson 1985) In all trials the standard terminology of complete response, partial response (greater than 50% reduction in tumour), stable disease (less than 50% reduction in tumour) and progressive disease was used. With the exception of Senkus‐Konefka 2005 the definition of response was either described or references to standardised criteria were made e.g. Miller 1981
The methods of statistical analysis were fully or partly described in all studies. Survival analysis was performed using the Kaplan‐Meier method in all trials except Abratt 1995 and Nestle 2000 where the precise method was not stated. Groups were compared using the Logrank test in all trials except Abratt 1995 where again the method used was not stated. All trials contained adequate information on the statistical tests used for analysis of differences in symptom control, toxicity differences and risk factor analysis where appropriate.
Effects of interventions
See: Summary of findings for the main comparison
Improvement of Major Thoracic Symptoms
All 13 studies that investigated symptoms reported that major thoracic symptoms improved following RT. Only three studies (Teo 1988; Bezjak 2002; Erridge 2005) reported a difference in symptom control between regimens tested. In Teo 1988, the higher dose and more fractionated regimen (45 Gy/18F) appeared to give significantly better palliation. It is not entirely clear how symptoms were assessed in this trial but it appears to have been solely by doctors. The definition of partial response "reduced severity or frequency for one or more of the pre‐treatment thoracic symptoms without concurrent emergence of new intrathoracic symptoms" is also imprecise. Of the 291 patients randomised, only 237 were included in the response assessment because of either defaulting (18) or dying (36) before the end of RT. The other two studies (Bezjak 2002; Erridge 2005) also reported better palliation with the higher dose, more fractionated regimen. In Bezjak 2002, changes on the Lung Cancer Symptom Scale (LCSS) showed that 20Gy/5F resulted in significant improvement in symptoms related to lung cancer. In Erridge 2005, the 30Gy/10F regimen was significantly better at reducing chest pain and dyspnoea compared to 10Gy/1F. In addition, a significant improvement in PS and less patient‐scored anxiety was reported with the 30Gy/10F regimen, but it is not clear if this was compared to 10Gy/1F or to the pre‐treatment baseline readings.
In MRC 1996 the shorter (2 fraction) regimen appeared to have a more rapid onset of effect in palliating symptoms than the longer, higher dose, 13 fraction regimen, although the differences in the proportion of patients with various symptoms who were palliated were not significant.
The duration of symptom control is a difficult endpoint to define and record. Only one trial showed a significant difference between the regimens investigated (Kramer 2005). This trial showed both regimens were effective in controlling symptoms, but the duration of palliative effect was significantly longer with 30Gy/10F compared to 16Gy/2F.
In MRC 1991, MRC 1992 and Sundstrom 2004, palliation seemed to last at least 50% of the survival time. Rees 1997 noted that only one symptom, haemoptysis, was improved in more than 50% of patients at eight weeks but that relief of other symptoms was "disappointing in both degree and duration".
In summary, all the studies showed a beneficial effect of RT on thoracic symptoms due to lung cancer, but there is no strong evidence to support the view that higher dose are associated with better or longer lasting palliation.
Quality of life
One study (Erridge 2005) reported no difference in QOL outcomes between the regimens tested. In Bezjak 2002, the LCSS scores reported significantly better global QOL with 20Gy/5F compared to 10Gy/1F (mean change in global QOL lung cancer symptom scale score at 1 month ‐0.51 in 5 fraction arm compared with 8.23 in 1 fraction arm, p=0.039) . Using QLQ‐C30 however, there was no difference in QOL between the two regimens tested except for a statistically significant improvement in pain scores with 20Gy/5F(mean change in QLQ‐C30 pain score at 1 month ‐9.22 in 5 fraction arm compared with 2.94 in single fraction arm, p=0.04). Sundstrom 2004 reported reduced physical and social functioning with 17Gy/2F compared to 50Gy/25F at week two (QLQ‐C30 score 57 for 17Gy compared with 63 for 50Gy, p<0.01) although this difference did not persist, and more emesis and appetite loss with 42Gy/15F compared to 50Gy/25F at two weeks (QLQ‐C30 score for emesis 15 for 42Gy compared with 11 for 50Gy, p<0.01, QLQ‐C30 score for appetite loss 48 for 42Gy compared with 34 for 50Gy, p<0.01). Again, these differences did not persist.Otherwise no differences were seen in QOL between the three RT schedules.
Toxicity
The acute side effects of RT to the chest, in particular radiation oesophagitis, tiredness and acute pneumonitis, are well recognised. These were reported as generally mild (Grade 1 or 2) for the majority of patients in all of the trials.Toxicity data is reported differently in the papers with some only reporting severe toxicity rates (i.e. WHO grade 3‐4) and some reporting any grade. Some papers do not give numerical values for toxicities, merely reporting them as similar in both arms. Given these limitations, the forest plots for adverse events Figure 3; Figure 5; Figure 4; Figure 5; should be interpreted with caution. Although these have failed to demonstrate a statistically significant difference in reports of adverse events there is high chance of bias from under‐reporting as well as the detection bias from physician based assessments in some trials as previously discussed.

Forest plot of comparison: 2 Adverse Events, outcome: 2.3 Oesophagitis (grade 3‐4).

Forest plot of comparison: 2 Adverse Events, outcome: 2.1 Radiation Myelopathy (any grade).
Forest plot of comparison: 2 Adverse Events, outcome: 2.2 Pneumonitis (any grade).
Oesophagitis
The best documented toxicity is radiation oesophagitis, especially in the MRC trials (MRC 1991, MRC 1992, MRC 1996) and Nestle 2000 where the patient diary cards clearly record the time course and intensity of dysphagia. Sundstrom 2004 reported earlier dysphagia with the two shorter treatment regimens.
In those reporting oesophagitis numerically, between 0% and 56% of patients experienced grade 3‐4 toxicity with a non‐significant increase in the higher fractionated regimes Figure 3. There is no clear relationship between number of fractions and incidence of oesophagitis. There was great heterogeneity in this data (I2=72%) and so we do not feel it appropriate to present a summary statistic. The absence of grading of toxicity in some papers and the difference in data collection, in particular physician assessment of symptoms rather than patient reported outcomes, means that no clear conclusion can be reached.
Radiation myelopathy
Radiation myelopathy was suspected (although not confirmed at autopsy) in one patient in MRC 1991 and confirmed in one patient in MRC 1992, both of whom received 17Gy/ 2 fractions. In MRC 1996, three patients ‐ one receiving 17Gy/ 2 fractions and two 39 Gy/ 13 fractions ‐ had clinical evidence of radiation myelopathy. In none of these trials was spinal shielding added or specific guidance given on the use of wedged fields to compensate for changes in antero‐posterior diameter of the chest, but clinicians had the option of giving 36 Gy/ 12 fractions rather than 39 Gy/ 13 fractions in MRC 1996. One patient in Sundstrom 2004 in the 50Gy/25F arm developed radiation myelopathy, but it is not stated whether this was a clinical or autopsy diagnosis. None of the other trials reported any cases of radiation myelopathy.
In two studies (Abratt 1995, Teo 1988) the spinal cord was shielded at tolerance doses. Simpson et al (Simpson 1985) limited the spinal cord dose to 25 Gy in the split course regimen and adjusted the field arrangement in the conventionally fractionated regimen, as did Nestle et al (Nestle 2000), to ensure the dose to the spinal cord did not exceed their tolerance limits. While this is necessary, it does introduce a degree of uncertainty to the dosimetry and in some cases may shield tumour itself.
No statistically significant difference in radiation myelopathy can be seen when comparing lower or higher fraction regimens but with an incidence between 0% and 1.61% any effect is likely to be small. The meta‐analysis of incidence of radiation myelopathy was RR 1.29 (95% CI 0.37 to 4.51; moderate quality of evidence) Figure 4. However randomised trials are not the most effective way of detecting uncommon, late toxicity and so the results of this meta‐analysis should be treated with caution.
Pneumonitis
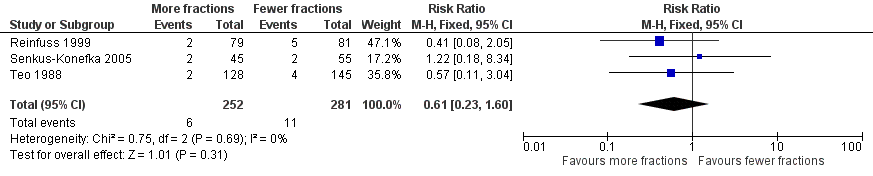
Radiation pneumonitis was only reported in 3 studies Reinfuss 1999; Senkus‐Konefka 2005; Teo 1988. Where pneumonitis was reported rates varied between 1.6% and 6%. No statistical difference was seen in the incidence of pneumonitis between lower and higher fraction regimens although mean incidence was lower in more fractionated regimens. The meta‐analysis of incidence of pneumonitis was RR 0.62 (95% CI 0.23 to 1.66; low quality of evidence) Figure 5
Tiredness
MRC 1996 also showed that the higher dose (13 fraction) regimen caused more tiredness and anorexia than the 2 fraction regimen. This outcome was not reported in other trials.
Other
None of the trials formally monitored or reported the side effects of acute chest pain, rigors, sweating and fevers which have been reported to occur in the first 24 hours in over 50% of patients receiving hypo‐fractionated RT (Devereux 1997).
Reinfuss 1999 reported broncho‐oesophageal fistulae in two patients who had significant comorbidity. This complication was not reported in any other trial.
In Simpson 1985, lung haemorrhage was seen in one patient (2%) given 30Gy/10F.
Radiological response
In the 7 studies (Abratt 1995; MRC 1991; Nestle 2000; Reinfuss 1999; Simpson 1985; Teo 1988; Senkus‐Konefka 2005) in which radiological response was reported, there was no significant difference reported between any of the RT regimens studied.
Measurement of radiological response was usually based on CXR rather than CT scan images and so should be considered unreliable.
Reinfuss et al (Reinfuss 1999) did report a difference in response of 44% compared to 34% in regimens of 50Gy/25F and 40Gy/10F respectively, but did not carry out a statistical test of significance.
Survival
All studies reported survival as an important endpoint and the data are summarised in Table 2.. The worst survival (median 3.6 months) is seen in the only study that specifically excluded better PS patients (MRC 1992). The 3 studies that specifically recruited patients with better PS (Abratt 1995; MRC 1996; Simpson 1985) had better survival (median 6.2 ‐ 9 months). This is in keeping with the well known prognostic significance of PS.
| STUDY | RT REGIMEN | Performance Status | Median survival | 1‐year survival | 2‐year survival |
| Abratt 1995 | 45Gy/15F | WHO 0‐2 | 8.5 months | 37% | N/A |
| Abratt 1995 | 35Gy/10F | WHO 0‐2 | 8.5 months | 40% | N/A |
| MRC 1991 | 30Gy/10F | Any | 5.9 months | 23% | 5% |
| MRC 1991 | 17Gy/2F | Any | 6.0 months | 20% | 5% |
| MRC 1991 (personal correspondence) | 30Gy/10F | WHO 0‐1 | 27.8% | N/A | |
| MRC 1991 (personal correspondence) | 30Gy/10F | WHO 2‐4 | 17.24% | N/A | |
| MRC 1991 (personal correspondence) | 17Gy/2F | WHO 0‐1 | 28.9% | N/A | |
| MRC 1991 (personal correspondence) | 17Gy/2F | WHO 2‐4 | 12.9% | N/A | |
| MRC 1992 | 17Gy/2F | WHO 2‐4 | 3.3 months | 14% | 2% |
| MRC 1992 | 10Gy/1F | WHO 2‐4 | 4.0 months | 9% | 3% |
| MRC 1996 | 17Gy/2F | WHO 0‐2 | 7 months | 31% | 12% |
| MRC 1996 | 36‐39Gy/12‐13F | WHO 0‐2 | 9 months | 36% | 9% |
| MRC 1996 (personal correspondence) | 17Gy/2F | WHO 0‐1 | 30.7% | N/A | |
| MRC 1996 (personal correspondence) | 17Gy/2F | WHO 2 | 29.5% | N/A | |
| MRC 1996 (personal correspondence) | 36‐39Gy/12‐13F | WHO 0‐1 | 38.4% | N/A | |
| MRC 1996 (personal correspondence) | 36‐39Gy/12‐13F | WHO 2 | 28.3% | N/A | |
| Nestle 2000 | 32Gy/16F | KPS ≥80 | 50% | 3.1% | |
| Nestle 2000 | 32Gy/16F | KPS ≥50 | 8.4 months | 36.1% | 9% |
| Nestle 2000 | 60Gy/30F | KPS ≥80 | 45.7% | 7% | |
| Nestle 2000 | 60Gy/30F | KPS ≥50 | 8.3 months | 38.1% | 9% |
| Rees 1997 | 17Gy/2F | Any | 6 months* | 18%* | 5%* |
| Rees 1997 | 22.5Gy/5F | Any | 6 months* | 22%* | 12%* |
| Reinfuss 1999 | 40Gy/10F (split) | KPS >50 | 8.3 months | 28% | 6% |
| Reinfuss 1999 | 50Gy/25F | KPS >50 | 12 months | 48% | 18% |
| Simpson 1985 | 30Gy/10F | KPS >60 | 6.4 months | 22%* | 8%* |
| Simpson 1985 | 40Gy/20F | KPS >60 | 6.9 months | 30%* | 8%* |
| Simpson 1985 | 40Gy/20F (split) | KPS >60 | 6.2 months | 30%* | 8%* |
| Sundstrom 2004 | 17Gy/2F | Any | 8.2 months | 29% | 8% |
| Sundstrom 2004 | 42Gy/15F | Any | 7 months | 29% | 13% |
| Sundstrom 2004 | 50Gy/25F | Any | 6.8 months | 31% | 10% |
| Teo 1988 | 31Gy/4F | Any | 5 months | 18%* | 5% |
| Teo 1988 | 45Gy/18F | Any | 5 months | 22%* | 5% |
| Senkus‐Konefka | 20Gy/5F | WHO 1‐4 | 5.3 months | 11% | N/A |
| Senkus‐Konefka | 16Gy/2F | WHO 1‐4 | 8 months | 27% | N/A |
| Senkus‐Konefka (personal correspondence) | 20Gy/5F | WHO 0‐1 | 12% | N/A | |
| Senkus‐Konefka (personal correspondence) | 20Gy/5F | WHO 2‐4 | 11% | N/A | |
| Senkus‐Konefka (personal correspondence) | 16Gy/2F | WHO 0‐1 | 29% | N/A | |
| Senkus‐Konefka (personal correspondence) | 16Gy/2F | WH0 2‐4 | 25% | N/A | |
| Kramer | 16Gy/2F | WHO 3‐4, or stage 4 WHO 0‐2 | N/A | 10.9% | N/A |
| Kramer | 30Gy/10F | WHO 3‐4, or stage 4 WHO 0‐2 | N/A | 19.6% | N/A |
| Kramer (personal correspondence) | 30Gy/10F | WHO 0‐1 | 28.6% | 9% | |
| Kramer (personal correspondence) | 30Gy/10F | WHO 2‐4 | 13.4% | 0% | |
| Kramer (personal correspondence) | 16Gy/2F | WHO 0‐1 | 7.8% | 0% | |
| Kramer (personal correspondence) | 16Gy/2F | WHO 2‐4 | 12.5% | 2.3% | |
| Bezjak | 10Gy/1F | WHO 0‐3 | 4.2 months | 15%* | N/A |
| Bezjak | 20Gy/5F | WHO 0‐3 | 6 months | 26%* | N/A |
| Erridge | 30Gy/10F | WHO 0‐3 | 22.7 weeks | 28% | 8% |
| Erridge | 10Gy/1F | WHO 0‐3 | 28.3 weeks | 19% | 4% |
| Erridge (personal correspondence) | 30Gy/10# | WHO 0‐1 | 31.6% | 7.9% | |
| Erridge (personal correspondence) | 30Gy/10# | WHO 2‐4 | 28.1% | 9.4% | |
| Erridge (personal correspondence) | 10Gy/1# | WHO 0‐1 | 25.7% | 5.7% | |
| Erridge (personal correspondence) | 10Gy/1# | WHO 2‐4 | 14.7% | 2.9% |
Four studies (MRC 1996; Reinfuss 1999; Bezjak 2002; Kramer 2005) showed a significant survival benefit for those patients treated with the higher dose regimen. In MRC 1996 the improvement was modest with a two month increase in median survival (9 months vs 7 months), and 5% and 3% increases in the 1‐ and 2‐year survival respectively.
Reinfuss 1999 reported a statistically significant survival benefit at two years (18% vs 6%) for the 50 Gy/25 fraction regimen compared to 40Gy/10 fraction split course regimen. This must be interpreted with caution for a number of reasons; The entry criteria were different in that asymptomatic patients were included, and the numbers of patients in each arm of the study (79 and 81) are small. In addition, the confidence limits of 1‐year and 2‐year survival figures were not reported. The patients were relatively young compared to those in other studies and were of generally good PS . The difference in BED25 was quite small (8 Gy) and so it is surprising that a significant difference in survival was found. However the difference may reflect the fact that the less effective 40Gy/10F regimen was a 'split' course with a 4 week gap in the middle. Prolonged, interrupted and split course treatments have been shown to be less effective than equivalent continuous treatments in non‐small cell lung cancer (Ching 2000; Cox 1993; Koukourakis 1996).
Kramer 2005 reported a significant improvement in 1‐year survival with 30Gy/10F compared to16Gy/2F (19.6% vs 10.9%). On subgroup analysis, this was only significant in patients with PS 0‐1, not in PS 2‐4. Interestingly, all the PS 0‐1 patients in this trial had stage 4 disease.
Bezjak 2002 reported a significant improvement in median survival with 20Gy/5F compared to 10Gy/1F (6 months vs 4.2 months). On post hoc subgroup analysis, the improvement only persisted for patients who were PS 0‐1 and had localised disease.
Senkus‐Konefka 2005 reported a significant improvement in median survival with 16Gy/2F compared to 20Gy/5F (8 months vs 5.3 months). This result must be interpreted with caution, as only 100 patients were randomised, and the study was closed early due to poor accrual resulting in an imbalance in the number of patients in each arm. In addition, the BED25 is higher in the 20Gy/5F regimen, making a true survival difference very unlikely.
It was not possible to get enough data for time‐to‐event analysis from the original authors. Given the long time‐scale since the studies were conducted, many no longer had the raw data available.
The results of the meta‐analyses of 1 year survival are shown in Analysis 2.1, Analysis 2.2, Analysis 3.1 and Analysis 3.2 and Figure 6 and Figure 7 using both fixed and random effects models. These show that overall there was a moderate degree of heterogeneity (I2 = 23%) and that any advantage favoured the more fractionated regimens.

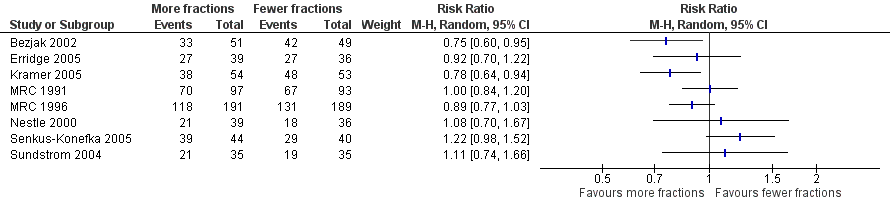
Forest plot of comparison: One year overall survival "more fractionated" vs "less fractionated" regimes, performance status 2‐4. Random effects analysis.
Forest plot of comparison: One year overall survival "more fractionated" vs "less fractionated" regimens, performance status 0‐1 ‐ random effects model,
The result of the meta‐analysis of 1 year overall survival for patients of any performance status, with the random effects model, was RR= 0.95, 95% CI 0.90‐1.00. With the fixed effects model, the meta‐analysis of 1 year overall survival showed a difference in favour of more fractionated regimens (RR= 0.95, 95% CI 0.90 to 0.99; moderate quality of evidence) just reaching statistical significance.
For the poorer performance patients the results are quite clear and show that there is no heterogeneity (I2= 0 using both methods) and that there appears to be no survival advantage from using more fractionated regimens. The meta‐analysis of 1 year survival for patients with poor performance status (WHO performance status 2‐4) was RR 0.96 (95% CI 0.91to 1.02; fixed effects; moderate quality of evidence).Figure 6
However for better performance patients there is greater heterogeneity (I2= 52%) and as a result we did not feel that it was appropriate to present a summary statistic.
Two year overall survival was not assessed because of the very small number of survivors at two years.
Discussion
This is the third update of this review and no new RCTs have been identified. At least two authors reviewed the literature searches each time and extracted the data from the included papers independently. The one non‐English paper (Reinfuss 1999) was not translated but the relevant data was extracted by two authors. One new trial Mohamed 2012 has been identified as an abstract but the detailed results were not available even after attempting to contact the author. As there have been no other new RCTs identified from the repeated searches or referred to in any other review over the past eight years it seems unlikely that new RCTs missed by this update have been published. There remains a possibility that other RCTs were carried out before 2000 but not published, and so there is a small risk of publication bias. Overall we believe that the risk of bias from the conduct of this review is low.
The objectives were to evaluate which are the most effective and least toxic regimens of palliative RT to improve thoracic symptoms. Three studies reported better palliation from higher dose more fractionated regimens (Teo 1988; Erridge 2005; Bezjak 2002). However, Teo 1988 and Erridge 2005 both used physician‐assessed scores, which may not be as accurate as patient self‐assessment and are subject to bias. In addition, the method of defining response in Teo 1988 was imprecise, and patient numbers in Erridge 2005 were small. Bezjak 2002 did show better symptom palliation at 1 month with the higher dose regimen and it is the only one of the three trials that collected outcome data using validated tools. It would have been interesting to know if the palliative benefit in Bezjak 2002 was only seen in PS 0‐1 patients, but these data were not presented. Kramer 2005 reported the duration of palliative effect was significantly longer with the higher dose regimen, but there were a higher proportion of PS 3 patients in the lower dose arm (34% vs 22%). It is possible that those patients with a poor PS have more thoracic and systemic symptoms, and therefore derived less durable palliative effect from RT, irrespective of dose. In addition, less than 40% of patients randomised were alive and assessable at 22 weeks when the difference between the regimens became statistically significant. There is good evidence that regimens with higher doses (or higher biological effective doses) give more toxicity, especially radiation oesophagitis. Overall, It would seem therefore that for most patients short hypofractionated regimens such as 10Gy/1F or 17Gy/2F are probably as effective at providing palliation as more protracted schedules, and have the advantage of fewer patient visits to hospital and reduced workload for RT departments.
Several non‐randomised studies have reported the use of hypofractionated regimens with 10Gy/ 1 fraction (Scolaro 1995), 16Gy/2F(Lupattelli 2000), 17Gy/2F (Stevens 1995; Vyas 1998) and 24Gy/3F (Slotman 1993). They give supporting evidence of the effectiveness and the patterns of toxicity of these regimens.
Toxicities not identified in the randomised trials but subsequently described (Devereux 1997; Lupattelli 2000; Old 2000; Scolaro 1995; Stevens 1995; Vyas 1998) include nausea, episodes of acute chest pain, or fever and rigors during the first 24 to 48 hours after treatment, experienced by up to 50% of patients receiving large fraction RT to the chest. These are transient, rarely severe and usually managed by appropriate medication and warning the patients. Hatton et al (Hatton 1997) documented changes in peak expiratory flow rate immediately after RT to the chest. This study included patients receiving fractions of 10 Gy, 8.5 Gy and 3 Gy. The numbers were small and they could not identify an increased risk with large fractions, but suggested caution and the use of corticosteroids in patients with severe airway obstruction.
More serious is the incidence of spinal cord damage (radiation myelitis) following the use of 17Gy/2Fand 39Gy/13F reported in MRC 1991, MRC 1992 and MRC 1996. Cases of probable radiation myelopathy following 17Gy/ 2 fractions to the chest have also been reported by Dardoufas et al (Dardoufas 1995), Stevens et al (Stevens 1995) and Vyas et al (Vyas 1998). A case was also reported in Sundstrom 2004 using 50Gy/25F. The data on myelopathy from the MRC studies was reviewed by Macbeth et al (Macbeth 1996) and the annual risks, with associated 95% confidence intervals, were presented. This suggested that the distribution of radiation myelopathy between regimens could have been random, but supported the conclusion of Schultheiss et al (Schultheiss 1992) that the alpha/beta ratio for spinal cord should be about 2. If an alpha/beta ratio of 1.7 is taken for spinal cord as proposed by Singer et al (Singer 1998), 17Gy/2F, 39 Gy/13F, and 50Gy/25F all give biological equivalent doses (BED1.7) of greater than 100Gy (see table 01). No regimen with a BED1.7 of less than 100 Gy has been reported as causing myelopathy. It should be recognised that above such level the risk of myelopathy increases and measures such as spinal cord shielding or oblique fields shielding should be introduced. The minimum time between treatment and the development of myelopathy in the cases reported was 6 weeks in Sundstrom 2004, which is much earlier than in other trials (earliest onset 8 months). However, it was not stated if the diagnosis was confirmed on autopsy. Definite conclusions about the risk of myelitis are difficult to make as some of the evidence cited above is from case reports and observational studies with a high risk of bias.
QOL was assessed using validated tools in only three trials (Sundstrom 2004; Erridge 2005; Bezjak 2002). There were no consistent findings between the trials, and it is not possible to comment on whether QOL is better with a particular RT regimen.
In conclusion, patients with NSCLC and thoracic symptoms needing palliation can be treated safely and effectively with 1 or 2‐fraction RT regimens. If 17Gy/2F is used, measures should be taken to reduce the dose to the spinal cord (Macbeth 1996). It may be more practical to reduce the dose to 16Gy/2F (BED1.7 = 91), which in a non‐randomised series of 91 patients (Lupattelli 2000) was shown to be effective, with no cases of myelopathy.
The second objective was to evaluate whether higher dose regimens are associated with increased survival. There is strong evidence for a modest increase in survival from one large high‐quality randomised controlled trial (5% at 1 year and 3% at 2 years) in patients with localised disease and better PS given higher dose RT.(MRC 1996). Three other trials have also reported a survival advantage with higher dose regimens (Reinfuss 1999; Bezjak 2002; Kramer 2005). In Reinfuss 1999 a large difference in survival was reported in a group of patients who seemed to have better PS. However the difference may reflect the fact that the less effective 40Gy/10F regimen was a 'split' course with a 4 week gap in the middle. Prolonged, interrupted and split course treatments have been shown to be less effective than equivalent continuous treatments in non‐small cell lung cancer (Ching 2000; Cox 1993; Koukourakis 1996) and other carcinomas (Fowler 1992), presumably because of accelerated tumour regrowth. The Bezjak 2002 trial supports the results from MRC 1996; Post hoc subgroup analysis showed the improvement in survival seen with the higher dose regimen only persisted for patients who were PS 0‐1 and had localised disease. The Kramer 2005 trial also showed that the survival advantage seen with the higher dose regimen only applied to good PS patients. Interestingly however, all the good PS patients in this trial had metastatic disease. Kramer 2005 is the only published RCT showing a survival advantage with higher RT doses in patients with metastatic disease, and therefore this result should be interpreted with caution. If the result were true, a possible explanation might be higher thoracic RT doses in patients with minimal metastatic spread improves local control and reduces the risk of death from local disease. With only 107 PS 0‐1patients in the Kramer 2005 trial, it seems unlikely a significant difference would be detected, particularly in view of the modest benefits seen in MRC 1996, a much bigger trial which only included good PS patients with no evidence of metastatic spread. In summary therefore, we have found no strong evidence for an improvement in survival for better PS patients from the use of more fractionated regimens.
None of the other studies demonstrated a significant difference in survival, although most were too small to reliably demonstrate changes in survival that might be clinically significant.
Due to the apparent heterogeneity of the studies in the regimens used and patients included, a formal meta‐analysis was not attempted in the original review. To answer the question of whether particular sub‐groups derived a survival benefit from differing RT schedules a subgroup analysis by performance status was attempted in this update. The studies not included in the meta‐analysis (Abratt 1995; Rees 1997; Reinfuss 1999; Simpson 1985; Teo 1988) were all older studies and data were no longer available. It is noted that these studies were all assessed as having a higher risk of bias Figure 2.
The results of our current meta‐analysis need to be treated with caution as data were only available for 56% of patients. The findings also require further explanation taking into account the potential sources of heterogeneity. One obvious source of heterogeneity is the choice of regimens used in the trials. The trials compare quite varied regimens and also present differences in the biologically effective dose (BED10) between the regimens being compared. For example, Nestle 2000 and Senkus‐Konefka 2005 are the two trials with more extreme dose ranges (34Gy and 1Gy, respectively) but neither of these trials (Nestle: RR 1.08, 95% CI 0.70‐1.67; Senkus‐Konefka; RR 1.22, 95% CI 0.98‐1.52) nor any of the others show an obvious correlation between the BED difference and the effect of more fractionated regimens. We therefore only carried out a meta‐analysis using a random effects model. This obvious clinical heterogeneity of the trials is reflected in the fact that the meta‐analysis of the PS 0‐1 subgroup shows a moderate to high degree of heterogeneity (I2 = 52%) and the overall meta‐analysis of all trials has moderate heterogeneity (I2 = 23%).
Secondly it is important to consider the findings of the Risk of Bias assessment Figure 2 especially in relation to the findings on 1 year survival. Most of the studies included in the meta‐analysis of PS 0‐1 patients have some uncertainties, the exceptions being MRC 1991 and 1996 and Sundstrom. In these low risk of bias trials, the two fractionation regimens obtain similar survival results both for the PS 0‐1 and PS 2‐4 patients . The two trials with significant results in favour of the more fractionated regimens have uncertainties that might lead to selection bias (Bezjak 2002 and Kramer 2005). Additionally, while 1 year survival for the PS 0‐1 patients is generally in the range of 25 to 40%, there are three trials that show unusually low survival. These trials are Bezjak with 14.3% in the less fractionated arm (10Gy/1F), Senkus‐Konefka 2005 with 11.4% in the more fractionated arm (20Gy/5F) and, most strikingly, Kramer 2005 with 9.4% in the less fractionated arm (16Gy/2F ) ‐ worse outcomes than for the poorer PS patients treated with that regimen (13.5%). All these studies have uncertainties that might lead to selection bias (Bezjak 2002 and Kramer 2005) or reporting bias (Senkus‐Konefka 2005).
Overall then, the meta‐analyses do not indicate that there is any significant survival advantage in giving patients, more fractionated regimens with higher biological doses. Although the point estimates all favour the more fractionated regimens, the results are not statistically significant for the whole group using a random effects model analysis. There is therefore no strong evidence for the use of these regimens, even in good PS patients. However even taking a very optimistic view of the effectiveness of more fractionated regimens, using the risk ratio point estimate of 0.89 (from the largest RCTin this group, MRC 1996) and assuming a 35% 1‐year survival rate in the lower dose arm for PS0‐1 patients, then the probability of survival might only increase to 39% (NNT 50).
The trials included in this review were published between 1985 and to 2006, many of them predating the use of CT imaging for staging and RT planning. There have also been significant technical advances in RT delivery since 2006. So would trials investigating this question using current technology give a different result? As these were all randomised trials with similar RT techniques used in both arms and all that differed was the dose/ fractionation regimen, it seems unlikely. It is of course probable that better staging and patient selection and the more consistent use of chemotherapy would result in better overall survival and that radiation toxicity might be less than in the past but the effect of RT dose/ fractionation regimens on palliation and survival might well not be different.
Summary of main results
Patients with inoperable lung cancer that is too large for radical RT have a poor prognosis and the therapeutic options are limited. Controlling their symptoms and maintaining their quality of life should therefore be the main aim of treatment. This review has shown that palliative RT to the chest appears to be effective in controlling troublesome symptoms from intrathoracic tumour. There was a consistent finding in all the studies that symptoms improved to some extent and for some time after RT. It is conceivable, but improbable, that this is a large and reproducible placebo effect.But there was no consistent evidence to support the view that that longer, more fractionated regimens were associated with better or more durable palliation.
Patients with NSCLC and thoracic symptoms needing palliation can be treated safely and effectively with 1 or 2‐fraction RT regimens. If 17Gy/2F is used, measures should be taken to reduce the dose to the spinal cord (Macbeth 1996). It may be more practical to reduce the dose to 16Gy/2F (BED1.7 = 91), which in a non‐randomised series of 91 patients (Lupattelli 2000) was shown to be effective, with no cases of myelopathy.
The meta‐analyses do not indicate that there is significant survival advantage in giving patients, more fractionated regimens with higher biological doses. Even if one assumes a 35% 1‐year survival rate in the lower dose arm for PS0‐1 patients, then the most optimistic analysis would suggest a more fractionated regimen might only increase that to 39%.
Higher dose palliative RT is clearly associated with more visits to hospital and more toxicity, and so the balance of benefit and risk needs to be carefully assessed and discussed openly with each patient.
The main findings are summarised in a summary of findings table. summary of findings Table for the main comparison
Overall completeness and applicability of evidence
The main purpose of this review was to assess the effect of palliative radiotherapy regimens on thoracic symptoms from NSCLC. All of the papers reported the effect on thoracic symptoms although the method of assessing these varied between the papers. This ranged between a physician's assessment of symptoms at fixed time points to daily diary cards completed by the patients themselves. Whatever the method of assessment, all radiotherapy regimens were reported as being associated with improvement in thoracic symptoms but no one radiotherapy schedule can be selected as offering the best palliation either in terms of size of effect or duration of effect.
Only 3 studies used validated QOL scores. In these studies, most domains measured did not show any significant difference between the two treatment arms. Where differences were seen, they tended to be short‐lived and not apparent at the next assessment point.
Both short and long term toxicities were reported in all the papers although the methods of assessment and reporting varied greatly between papers. No significant difference has been demonstrated between various regimens although the timing of onset of acute toxicities did vary according to fraction size in one paper (Sundstrom 2004). Radiation myelitis was rare but care should be taken with spinal cord doses and spinal cord shielding should be considered for higher BED regimens e.g. 17Gy/2#, 39Gy/13#.
The effect of radiotherapy on radiological response is less well documented with fewer studies reporting this outcome and many studies only assessing radiological response with CXR rather than CT. No conclusions can be drawn on which RT schedule has the biggest effect on radiological response.
The known effect of performance status on overall survival was shown with studies recruiting only poor PS patients having the lowest median survival and those recruiting only good PS patients having the highest survival. When stratified for performance status, RT regimens with more fractions did not show any statistical difference in 1 year survival compared with regimens with fewer fractions.
Meta‐analysis by stage was not attempted as many of the original studies did not specify their staging methods and a large proportion of patients would have been treated without modern staging tools such as CT/PET.
Quality of the evidence
Fourteen randomised trials are included in this review representing 3708 patients of which 3576 were evaluable and whose outcomes were reported.
A number of key limitations have been identified. The methods of symptom assessment and toxicity varied between studies in detail and quality (see Description of Studies, above). Only 3 studies used validated QOL scores leading to low quality of evidence when assessing acute toxicity. Reporting of radiation myelopathy was more consistent and here it was felt the quality of evidence was moderate.There was a wide range of radiotherapy regimens used making it difficult to perform comparisons and data stratified by performance status was only available for 56% of patients and so the conclusions drawn from the meta‐analysis are only felt to represent moderate quality of evidence.
Assessment of stage and tumour response often did not use cross‐sectional imaging leading to low quality of evidence when assessing radiological response.
Potential biases in the review process
It is likely that most of the relevant trials have been included in this review as a systematic literature search was performed with broad search criteria as well as consultation with experts in lung radiotherapy. Where insufficient data was available in published reports, attempts were made to obtain unpublished data. Mohamed 2012 which was only reported in abstract form and for which insufficient data were available has not been included.
It was not possible to obtain survival data stratified by performance status for all the subjects and only 56% of patients are represented in the meta‐analysis of 1 year OS. Data on radiotherapy toxicity was also incomplete. All trials reported the effect of radiotherapy on major thoracic symptoms but the means of assessment was not standardised between the trials and so comparisons are difficult.
Agreements and disagreements with other studies or reviews
The meta‐analysis in this paper is in contrast to the Fairchild 2008 meta‐analysis which showed a survival benefit for radiotherapy regimens with a higher calculated 'biological equivalent dose' (BED). However, this meta‐analysis included treatment arms with roughly equivalent BED (e.g. Senkus‐Konefka 2005 whose two arms had calculated BED of 28Gy and 29.6Gy) and mis‐allocated the treatment arms in Teo 1988 (43.7Gy allocated as "lower dose" arm, 42.8Gy allocated as "higher dose" arm). The Reinfuss 1999 paper is not included in the Fairchild paper although the two "immediate arms" would have met their inclusion criteria. It is not clear from the paper how the three‐armed Simpson 1985 patients were distributed. In the printed tables, the number of participants in each arm is stated as 136 although the maximum number of patients in any arm was 112. Similarly, the data for Sundstrom 2004 shows 146 patients in the lower BED arm and 130 patients in the higher BED arm, neither of which exactly matches any of the arms as reported in the paper.These errors and omissions may have led to unintended confounding factors and so resulted in an apparent significant difference in survival when such a difference does not exist. It should be noted that the hypothesis in the Fairchild paper differs to ours as they were looking for a difference in survival according to calculated BED while we were looking for a difference in survival according to total number of fractions prescribed.
The Fairchild 2008 meta‐analysis took a different approach from ours in using the calculated BED to compare regimens. We chose a different approach by comparing the regimens on the basis of the number of fractions used in the regimens. We felt that this would be a more useful comparison with greater clinical relevance as the larger number of fractions involves not only more resource use but also more inconvenience for patients.

Study flow diagram for searches 2008‐2014.
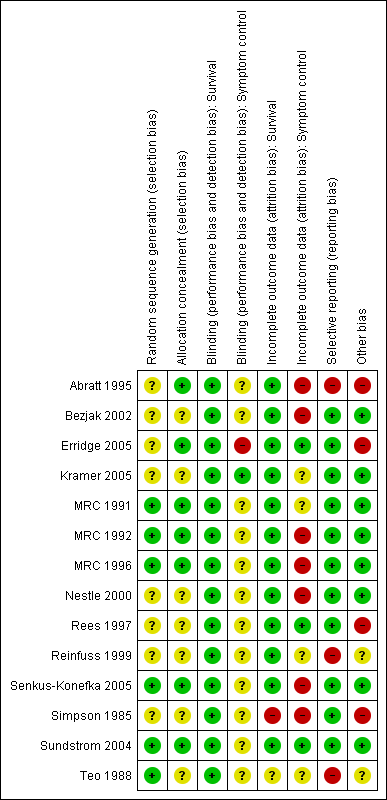
Methodological quality summary: review authors' judgements about each methodological quality item for each included study.
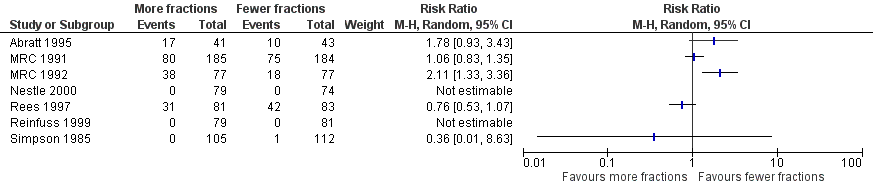
Forest plot of comparison: 2 Adverse Events, outcome: 2.3 Oesophagitis (grade 3‐4).

Forest plot of comparison: 2 Adverse Events, outcome: 2.1 Radiation Myelopathy (any grade).

Forest plot of comparison: 2 Adverse Events, outcome: 2.2 Pneumonitis (any grade).
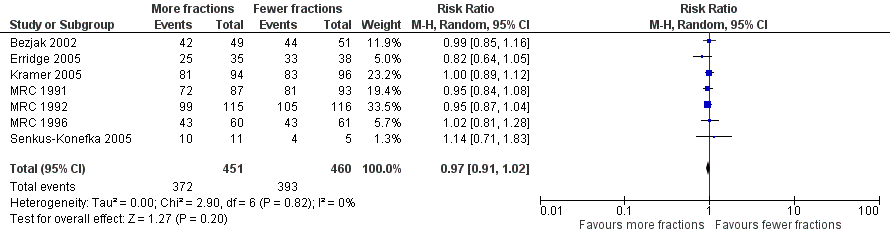
Forest plot of comparison: One year overall survival "more fractionated" vs "less fractionated" regimes, performance status 2‐4. Random effects analysis.

Forest plot of comparison: One year overall survival "more fractionated" vs "less fractionated" regimens, performance status 0‐1 ‐ random effects model,

Comparison 1 Adverse Events, Outcome 1 Radiation Myelopathy (any grade).
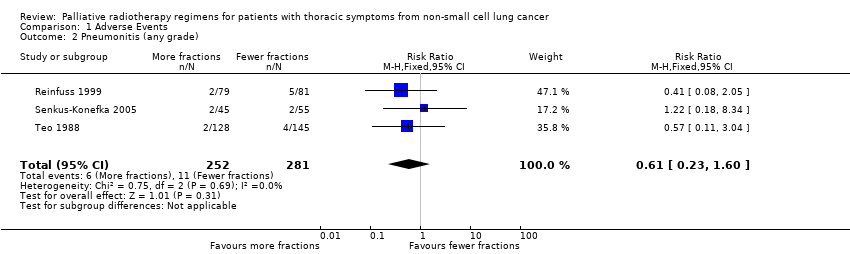
Comparison 1 Adverse Events, Outcome 2 Pneumonitis (any grade).
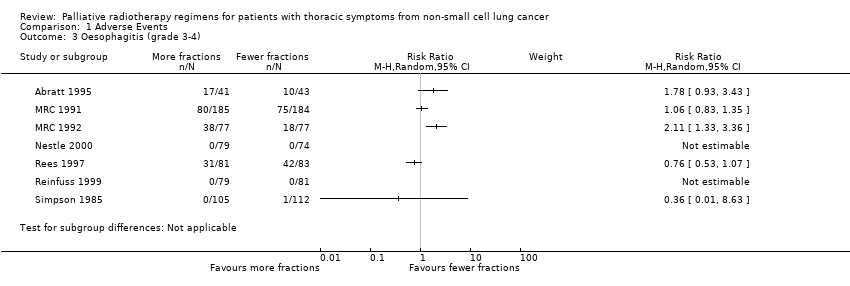
Comparison 1 Adverse Events, Outcome 3 Oesophagitis (grade 3‐4).

Comparison 1 Adverse Events, Outcome 4 Oesophagitis (any grade).
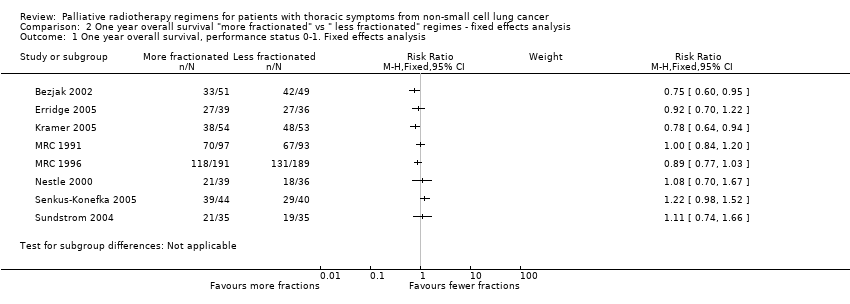
Comparison 2 One year overall survival "more fractionated" vs " less fractionated" regimes ‐ fixed effects analysis, Outcome 1 One year overall survival, performance status 0‐1. Fixed effects analysis.

Comparison 2 One year overall survival "more fractionated" vs " less fractionated" regimes ‐ fixed effects analysis, Outcome 2 One year overall survival, performance status 2‐4. Fixed effects analysis.
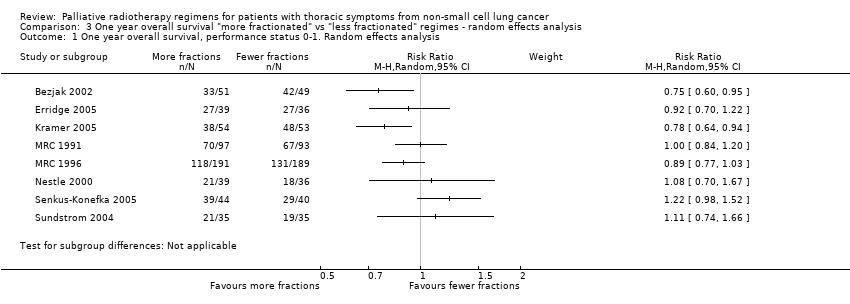
Comparison 3 One year overall survival "more fractionated" vs "less fractionated" regimes ‐ random effects analysis, Outcome 1 One year overall survival, performance status 0‐1. Random effects analysis.

Comparison 3 One year overall survival "more fractionated" vs "less fractionated" regimes ‐ random effects analysis, Outcome 2 One year overall survival, performance status 2‐4. Random effects analysis.
| More fractionated thoracic radiotherapy compared with less fractionated radiotherapy for non small cell lung cancer treated with palliative intent | ||||||
| Patient or population: adults with non small cell lung cancer who are not felt to be curable Settings: specialist oncology units offering external beam radiotherapy Intervention: More fractionated thoracic radiotherapy Comparison: Less fractionated radiotherapy | ||||||
| Outcomes | Illustrative comparative risks* (95% CI) | Relative effect | No of Participants | Quality of the evidence | Comments | |
| Assumed risk | Corresponding risk | |||||
| Fewer fractions | More fractions | |||||
| 1 year overall survival in patients of good performance status (WHO performance status 0‐1) | The mean 1 year overall survival was 25.6% and ranged across control groups from | The mean 1 year overall survival in the intervention groups was higher at | 1081 | ++OO | Heterogeneity considered too great for presentation of summary statistic. Not complete data set as unable to get additional data from all authors, high level of heterogeneity | |
| 1 year overall survival in patients of poor performance status (WHO performance status 2‐4) | The mean 1 year overall survival was 14.6% and ranged across control groups from | The mean 1 year overall survival in the intervention groups was higher at 17.5% (9.1% to 28.6%) | RR 0.96 (0.91 to 1.02) | 911 | +++O | Not complete data set as unable to get additional data from all authors |
| Oesophagitis (grade 3 to 4) | The mean 22.3% ranged across control groups from 0% to 50% | The mean rate of grade 3‐4 oesophagitis in the intervention groups was higher at 25.7% | RR 1.23 (0.81 to 1.87) | 1301 (8 studies) | ++OO | Not reported in all trials. Some reported as patient reported toxicity others physician assessed toxicity |
| Radiation Myelopathy (any grade) | The mean 0.30% ranged across control groups from | The mean rate of radiation myelopathy in the intervention groups was higher at 0.38% (0% to 1.61%) | RR 1.29 (0.37 to 4.51) | 2663 (11 studies) | +++O | Reported in most but not all studies. Not graded and most not confirmed at post‐mortem. |
| Radiation pneumonitis (any grade) | The mean 3.9% ranged across control groups from | The mean rate of radiation pneumonitis in the intervention groups was lower at 2.4% (1.6% to 4%) | RR 0.62 (0.23 to 1.66) | 533 (3 studies) | ++OO | Not reported in the majority of trials and not graded. |
| *The basis for the assumed risk (e.g. the median control group risk across studies) is provided in footnotes. The corresponding risk (and its 95% confidence interval) is based on the assumed risk in the comparison group and the relative effect of the intervention (and its 95% CI). | ||||||
| GRADE Working Group grades of evidence | ||||||
| RT REGIMEN | STUDY | BED(10): Gy | BED(25): Gy | BED(1.7): Gy |
| 60Gy/39F/6W | Nestle 2000 | 72 | 65 | 131 |
| 50Gy/25F/5W | Reinfuss 1999; Sundstrom 2004 | 60 | 54 | 109 |
| 45Gy/15/3.5W (4 days per week) | Abratt 1995 | 59 | 50 | 109 |
| 45Gy/18F/3.4W | Teo 1988 | 56 | 50 | 111 |
| 40GY/10F/4W(split) | Reinfuss 1999; Simpson 1985 | 56 | 46 | 134 |
| 42Gy/15F/3W | Sundstrom 2004 | 54 | 47 | 111 |
| 39Gy/13F/2.4W | MRC 1996 | 51 | 44 | 108 |
| 40Gy/20F/4W | Simpson 1985 | 48 | 43 | 87 |
| 36Gy/12F/2.3W | MRC1996 | 47 | 40 | 100 |
| 35Gy/10F/2.2W (4 days per week) | Abratt 1995 | 47 | 40 | 107 |
| 32Gy/16F/10d (twice daily) | Nestle 2000 | 38 | 35 | 70 |
| 31.2Gy/4F/4W (weekly) | Teo 1988 | 55 | 41 | 174 |
| 30Gy/10F/2W | MRC 1991, Simpson 1985, Kramer 2005, Erridge 2005 | 39 | 34 | 83 |
| 27Gy/6F/2W (3 days per week) | MRC 1991 | 39 | 32 | 98 |
| 22.5Gy/5F/5d | Rees 1997 | 33 | 27 | 82 |
| 20Gy/5F/5d | Senkus‐Konefka 2005, Bezjak 2002 | 28 | 23 | 67 |
| 17Gy/2F/8d (weekly) | MRC 1991, MRC 1992, MRC 1996, Rees 1997, Sundstrom 2004 | 31 | 23 | 102 |
| 16Gy/2F/8d (weekly) | Senkus‐Konefka 2005, Kramer 2005 | 29 | 21 | 91 |
| 10Gy/1F/1d | MRC 1992, Bezjak 2002, Erridge 2005 | 20 | 14 | 69 |
| BED(y): biologically effective dose (Gy), calculated by the formula: BED(y) = n x d (1+ d/ (alpha/beta)), where n=number of fractions, d= size of each fraction(Gy), and alpha/beta is constant, of value y, for a given tissue type (Fowler 1989, Joiner 1997) |
| STUDY | RT REGIMEN | Performance Status | Median survival | 1‐year survival | 2‐year survival |
| Abratt 1995 | 45Gy/15F | WHO 0‐2 | 8.5 months | 37% | N/A |
| Abratt 1995 | 35Gy/10F | WHO 0‐2 | 8.5 months | 40% | N/A |
| MRC 1991 | 30Gy/10F | Any | 5.9 months | 23% | 5% |
| MRC 1991 | 17Gy/2F | Any | 6.0 months | 20% | 5% |
| MRC 1991 (personal correspondence) | 30Gy/10F | WHO 0‐1 | 27.8% | N/A | |
| MRC 1991 (personal correspondence) | 30Gy/10F | WHO 2‐4 | 17.24% | N/A | |
| MRC 1991 (personal correspondence) | 17Gy/2F | WHO 0‐1 | 28.9% | N/A | |
| MRC 1991 (personal correspondence) | 17Gy/2F | WHO 2‐4 | 12.9% | N/A | |
| MRC 1992 | 17Gy/2F | WHO 2‐4 | 3.3 months | 14% | 2% |
| MRC 1992 | 10Gy/1F | WHO 2‐4 | 4.0 months | 9% | 3% |
| MRC 1996 | 17Gy/2F | WHO 0‐2 | 7 months | 31% | 12% |
| MRC 1996 | 36‐39Gy/12‐13F | WHO 0‐2 | 9 months | 36% | 9% |
| MRC 1996 (personal correspondence) | 17Gy/2F | WHO 0‐1 | 30.7% | N/A | |
| MRC 1996 (personal correspondence) | 17Gy/2F | WHO 2 | 29.5% | N/A | |
| MRC 1996 (personal correspondence) | 36‐39Gy/12‐13F | WHO 0‐1 | 38.4% | N/A | |
| MRC 1996 (personal correspondence) | 36‐39Gy/12‐13F | WHO 2 | 28.3% | N/A | |
| Nestle 2000 | 32Gy/16F | KPS ≥80 | 50% | 3.1% | |
| Nestle 2000 | 32Gy/16F | KPS ≥50 | 8.4 months | 36.1% | 9% |
| Nestle 2000 | 60Gy/30F | KPS ≥80 | 45.7% | 7% | |
| Nestle 2000 | 60Gy/30F | KPS ≥50 | 8.3 months | 38.1% | 9% |
| Rees 1997 | 17Gy/2F | Any | 6 months* | 18%* | 5%* |
| Rees 1997 | 22.5Gy/5F | Any | 6 months* | 22%* | 12%* |
| Reinfuss 1999 | 40Gy/10F (split) | KPS >50 | 8.3 months | 28% | 6% |
| Reinfuss 1999 | 50Gy/25F | KPS >50 | 12 months | 48% | 18% |
| Simpson 1985 | 30Gy/10F | KPS >60 | 6.4 months | 22%* | 8%* |
| Simpson 1985 | 40Gy/20F | KPS >60 | 6.9 months | 30%* | 8%* |
| Simpson 1985 | 40Gy/20F (split) | KPS >60 | 6.2 months | 30%* | 8%* |
| Sundstrom 2004 | 17Gy/2F | Any | 8.2 months | 29% | 8% |
| Sundstrom 2004 | 42Gy/15F | Any | 7 months | 29% | 13% |
| Sundstrom 2004 | 50Gy/25F | Any | 6.8 months | 31% | 10% |
| Teo 1988 | 31Gy/4F | Any | 5 months | 18%* | 5% |
| Teo 1988 | 45Gy/18F | Any | 5 months | 22%* | 5% |
| Senkus‐Konefka | 20Gy/5F | WHO 1‐4 | 5.3 months | 11% | N/A |
| Senkus‐Konefka | 16Gy/2F | WHO 1‐4 | 8 months | 27% | N/A |
| Senkus‐Konefka (personal correspondence) | 20Gy/5F | WHO 0‐1 | 12% | N/A | |
| Senkus‐Konefka (personal correspondence) | 20Gy/5F | WHO 2‐4 | 11% | N/A | |
| Senkus‐Konefka (personal correspondence) | 16Gy/2F | WHO 0‐1 | 29% | N/A | |
| Senkus‐Konefka (personal correspondence) | 16Gy/2F | WH0 2‐4 | 25% | N/A | |
| Kramer | 16Gy/2F | WHO 3‐4, or stage 4 WHO 0‐2 | N/A | 10.9% | N/A |
| Kramer | 30Gy/10F | WHO 3‐4, or stage 4 WHO 0‐2 | N/A | 19.6% | N/A |
| Kramer (personal correspondence) | 30Gy/10F | WHO 0‐1 | 28.6% | 9% | |
| Kramer (personal correspondence) | 30Gy/10F | WHO 2‐4 | 13.4% | 0% | |
| Kramer (personal correspondence) | 16Gy/2F | WHO 0‐1 | 7.8% | 0% | |
| Kramer (personal correspondence) | 16Gy/2F | WHO 2‐4 | 12.5% | 2.3% | |
| Bezjak | 10Gy/1F | WHO 0‐3 | 4.2 months | 15%* | N/A |
| Bezjak | 20Gy/5F | WHO 0‐3 | 6 months | 26%* | N/A |
| Erridge | 30Gy/10F | WHO 0‐3 | 22.7 weeks | 28% | 8% |
| Erridge | 10Gy/1F | WHO 0‐3 | 28.3 weeks | 19% | 4% |
| Erridge (personal correspondence) | 30Gy/10# | WHO 0‐1 | 31.6% | 7.9% | |
| Erridge (personal correspondence) | 30Gy/10# | WHO 2‐4 | 28.1% | 9.4% | |
| Erridge (personal correspondence) | 10Gy/1# | WHO 0‐1 | 25.7% | 5.7% | |
| Erridge (personal correspondence) | 10Gy/1# | WHO 2‐4 | 14.7% | 2.9% |
| Outcome or subgroup title | No. of studies | No. of participants | Statistical method | Effect size |
| 1 Radiation Myelopathy (any grade) Show forest plot | 11 | 2663 | Risk Ratio (M‐H, Fixed, 95% CI) | 1.27 [0.39, 4.13] |
| 2 Pneumonitis (any grade) Show forest plot | 3 | 533 | Risk Ratio (M‐H, Fixed, 95% CI) | 0.61 [0.23, 1.60] |
| 3 Oesophagitis (grade 3‐4) Show forest plot | 7 | Risk Ratio (M‐H, Random, 95% CI) | Subtotals only | |
| 4 Oesophagitis (any grade) Show forest plot | 10 | Risk Ratio (M‐H, Random, 95% CI) | Subtotals only | |
| Outcome or subgroup title | No. of studies | No. of participants | Statistical method | Effect size |
| 1 One year overall survival, performance status 0‐1. Fixed effects analysis Show forest plot | 8 | Risk Ratio (M‐H, Fixed, 95% CI) | Subtotals only | |
| 2 One year overall survival, performance status 2‐4. Fixed effects analysis Show forest plot | 7 | 911 | Risk Ratio (M‐H, Fixed, 95% CI) | 0.96 [0.91, 1.02] |
| Outcome or subgroup title | No. of studies | No. of participants | Statistical method | Effect size |
| 1 One year overall survival, performance status 0‐1. Random effects analysis Show forest plot | 8 | Risk Ratio (M‐H, Random, 95% CI) | Subtotals only | |
| 2 One year overall survival, performance status 2‐4. Random effects analysis Show forest plot | 7 | 911 | Risk Ratio (M‐H, Random, 95% CI) | 0.97 [0.91, 1.02] |