Regímenes de radioterapia paliativa para pacientes con síntomas torácicos de cáncer de pulmón de células no pequeñas
Appendices
Appendix 1. Cochrane Library Search Strategy 2014
Cochrane Library (Wiley)
| ID | Search | Hits | Edit | Delete |
| #1 | 3948 | |||
| #2 | MeSH descriptor Carcinoma, Non‐Small‐Cell Lung explode all trees | 1811 | ||
| #3 | 7308 | edit | ||
| #4 | (non small cell):ti,kw,ab or (non‐small cell):ti,kw,ab or (nsclc):ti,kw,ab | 3962 | edit | |
| #5 | 7318 | edit | ||
| #6 | 3615 | edit | ||
| #7 | 3615 | edit | ||
| #8 | 4338 | |||
| #9 | 17159 | edit | ||
| #10 | 17305 | edit | ||
| #11 | 1185 | |||
| #12 | 258 | |||
| #13 | 61 | |||
| #14 | (symptom*):ti,kw,ab NEAR/2 (control* or relief* or manag*):ti,kw,ab | 3222 | edit | |
| #15 | (palliat* or symptom*):ti,ab,kw NEAR (palliat* or radiat* or intent*):ti,ab,kw | 2532 | edit | |
| #16 | 5794 | edit | ||
| #17 | 75 | edit | ||
| #18 | 5 | edit |
Appendix 2. MEDLINE search strategy 2014
1. exp lung neoplasms/
2. carcinoma, non‐small‐cell lung/
3. (lung adj2 cancer).tw.
4. (lung adj2 carcinoma$).tw.
5. (lung adj2 neoplas$).tw.
6. (pulmonary adj2 neoplas$).tw.
7. (lung$ adj2 metast$).tw.
8. exp carcinoma,bronchogenic/
9. exp bronchial neoplasms/
10. (bronch$ adj2 cancer$).tw.
11. (bronch$ adj2 carcinoma$).tw.
12. exp pleural neoplasms/
13. or/1‐12
14. (lung$ or bronch$ or pulmonary).tw.
15. exp carcinoma, squamous cell/
16. exp adenocarcinoma/
17. ((round adj cell) and (carcinoma$ or cancer$)).tw.
18. ((reserve adj cell) and (carcinoma$ or cancer$)).tw.
19. ((large adj cell) and (carcinoma$ or cancer$)).tw.
20. ((squamous adj cell) and (carcinoma$ or cancer$)).tw.
21. adenocarcinoma$.tw.
22. carcinoma, large cell/
23. or/15‐22
24. 14 and 23
25. 13 or 24
26. exp radiotherapy/
27. exp radiotherapy, computer‐assisted/
28. exp radiation dosage/
29. exp radiotherapy dosage/
30. exp radiotherapy, high‐energy/
31. exp radiotherapy,adjuvant/
32. exp dose fractionation/
33. exp brachytherapy/
34. exp radiation oncology/
35. radiotherap$.tw.
36. (thorac$ adj2 radiotherap$).mp.
37. (radiat$ adj2 therap$).mp.
38. (thorac$ adj2 radiat$).mp.
39. irradiation.tw.
40. (endobronch$ adj2 brachytherap$).mp.
41. or/26‐40
42. exp palliative care/
43. exp terminal care/
44. exp quality of life/
45. (symptom$ adj2 control$).mp.
46. (symptom$ adj2 relief).mp.
47. (symptom$ adj2 manag$).mp.
48. (palliat$ adj2 manag$).mp.
49. exp appetite/
50. exp fatigue/
51. exp cough/
52. exp dyspnea/
53. dyspnoea.tw.
54. exp hemoptysis/
55. haemoptysis.tw.
56. exp chest pain/
57. exp deglutition disorders/
58. exp nausea/
59. exp weight loss/
60. tiredness.tw.
61. exp hoarseness/
62. breathlessness.tw.
63. (symptom$ adj2 palliat$).mp.
64. (palliat$ adj2 radiat$).mp.
65. (palliat$ adj2 intent$).mp.
66. or/42‐65
67. 41 and 66
68. 25 and 67
69. randomized controlled trial.pt.
70. controlled clinical trial.pt.
71. randomized.ab.
72. placebo.ab.
73. drug therapy.fs.
74. randomly.ab.
75. trial.ab.
76. groups.ab.
77. or/69‐76
78. exp animals/ not humans.sh.
79. 77 not 78
80. 68 and 79
81 (201112* or 2012* or 2013* or 2014*).em.
80 and 81
Appendix 3. EMBASE Search Strategy 2014
Embase (OVID)
1 exp Lung Tumor/
2 exp lung cancer/
3 exp Lung non Small Cell Cancer/
4 ((lung$ or pulmon$ or bronch$) adj3 (cancer$ or carcinoma$ or neoplas$ or tum?or$ or malignan$ or adenocarcinoam$)).tw.
5 respiratory tract tumor/ or exp bronchus cancer/
6 exp bronchus tumor/
7 exp respiratory tract cancer/
8 exp pleura cancer/
9 exp pleura tumor/
10 (lung$ or bronch$ or pleur$ or pulomon$).tw.
11 exp Squamous Cell Carcinoma/
12 exp adenocarcinoma/ 79038
13 exp Large Cell Carcinoma/
14 or/11‐13 170794
15 10 and 14 24159
16 or/1‐9 318837
17 15 or 16 321481
18 exp Radiotherapy/ 382577
19 exp cancer radiotherapy/
20 exp brachytherapy/
21 radiotherap$.tw.
22 (radiat$ adj2 therap$).tw.
23 ((thorac$ or thorax) adj2 (radio$ or radiat$)).tw.
24 (endobronch$ adj2 brachytherap$).tw.
25 or/18‐24
26 exp Palliative Therapy/
27 exp Terminal Care/
28 exp "Quality of Life"/
29 (symptom$ adj2 (control$ or relief$ or manag$)).tw.
30 ((palliat$ or symptom$) adj2 (palliat$ or radiat$ or intent$)).tw.
31 or/26‐30
32 Crossover Procedure/
33 double‐blind procedure/
34 randomized controlled trial/
35 single‐blind procedure/
36 (random$ or factorial$ or crossover$ or cross over$ or placebo$ or assign$ or allocat$ or volunteer$).mp.
37 ((doubl$ or singl$) adj blind$).mp.
38 or/32‐37
39 17 and 25 and 31 and 38
40 limit 39 to yr="2012 ‐Current
Appendix 4. Systemic Review Searching Record
Literature search details 2008
Date Restriction & Why 2005 ‐> update of existing review
Language Restriction & Why ‐ none
| Database name | Dates Covered | No of references found | No of references retrieved (if screened) | Finish date of search |
| Medline | 2005 ‐ present | 128 | N/A | 16.04.09 |
| Premedline | 16.04.09 | 0 |
| 16.04.09 |
| Embase | 2005‐ present | 761 |
| 22.04.09 |
| Cochrane Library | 2005‐present | 9 |
| 22.04.09 |
Total References retrieved (after de‐duplication): 878
Any further comments:
Cancerlit not searched as a separate database as the original database absorbed by MEDLINE.
Literature search details 2011
Date Restriction & Why all 2008 ‐> present (update)
Language Restriction & Why None
| Database name | Dates Covered
All 2008 ‐> | No of references found | Finish date of search |
| Medline |
| 108 | 09.12.11 |
| Premedline |
| 0 | 09.12.11 |
| Embase |
| 114 | 12.12.11 |
| Cochrane Library |
| 5 | 12.12.11 |
| Web of Science |
| 88 | 22.12.11 |
| AMED |
| 0 | 22.12.11 |
| LILACS |
| 0 | 23.12.11 |
| Biomed Central |
| 0 | 23.12.11 |
Total References retrieved (after de‐duplication): 227
Optimal Cochrane RCT filter updated.
Literature search details 2014
Date Restriction & Why: Update to all records added to database from Dec 2011 – Jan 2014 inclusive – entry date rather than publication date used where available
Language Restriction & Why: None
| Database name | Update 1 2008 ‐ 2011 date of search | No of refs
| Update 2 2011‐ 2014 date of search | No. of refs |
| Medline | 09.12.11 | 108 | 14.01.14 | 68 |
| Medline in process | 09.12.11 | 0 | 14.01.14 | 4 |
| Embase | 12.12.11 | 114 | 14.01.14 | 227 |
| Cochrane Library | 12.12.11 | 5 | Issue 1 2014 | 0 |
| Web of Science | 22.12.11 | 88 | 14.01.14 | 64 |
| AMED | 22.12.11 | 0 | 14.01.14 | 0 |
| LILACS | 23.12.11 | 0 | 14.01.14 | 0 |
| Biomed Central | 23.12.11 | 0 | 14.01.14 | 0 |
| ICTRP Search Portal
| N/A | N/A | No date restriction as not searched before | 1 |
|
|
|
|
|
|
| total |
|
|
| 364 |
| After de‐duplication |
|
|
| 330 |
|
|
|
|
|
|

Study flow diagram for searches 2008‐2014.
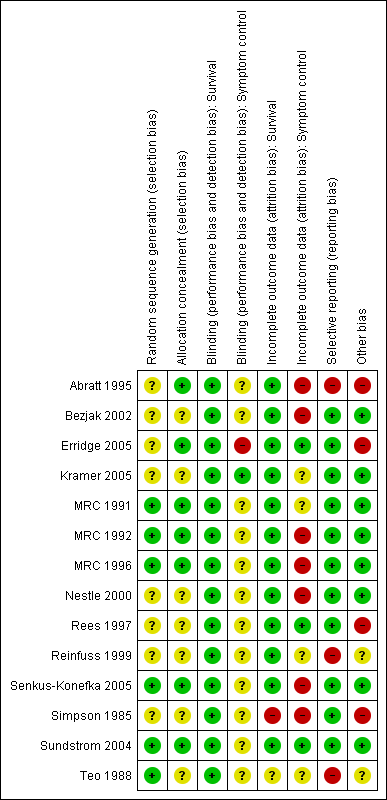
Methodological quality summary: review authors' judgements about each methodological quality item for each included study.
Forest plot of comparison: 2 Adverse Events, outcome: 2.3 Oesophagitis (grade 3‐4).

Forest plot of comparison: 2 Adverse Events, outcome: 2.1 Radiation Myelopathy (any grade).

Forest plot of comparison: 2 Adverse Events, outcome: 2.2 Pneumonitis (any grade).
Forest plot of comparison: One year overall survival "more fractionated" vs "less fractionated" regimes, performance status 2‐4. Random effects analysis.

Forest plot of comparison: One year overall survival "more fractionated" vs "less fractionated" regimens, performance status 0‐1 ‐ random effects model,

Comparison 1 Adverse Events, Outcome 1 Radiation Myelopathy (any grade).
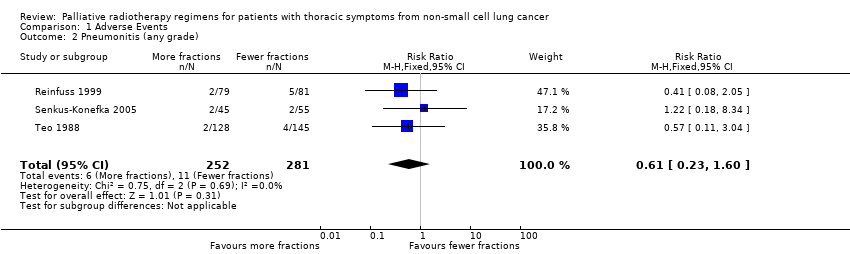
Comparison 1 Adverse Events, Outcome 2 Pneumonitis (any grade).
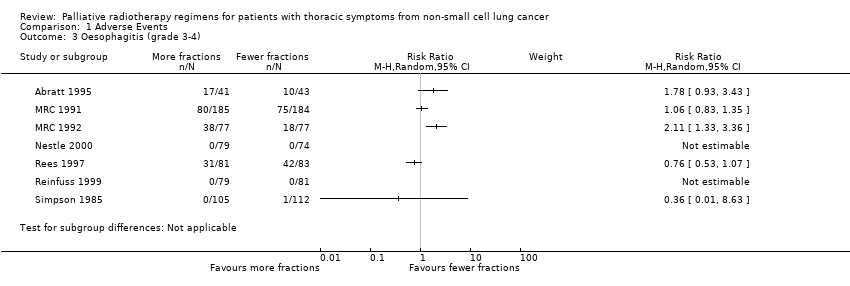
Comparison 1 Adverse Events, Outcome 3 Oesophagitis (grade 3‐4).

Comparison 1 Adverse Events, Outcome 4 Oesophagitis (any grade).
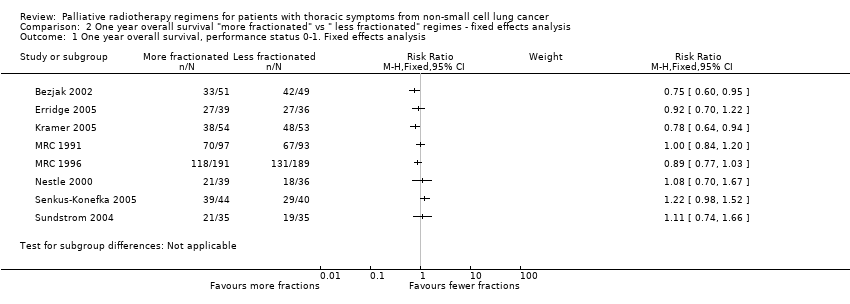
Comparison 2 One year overall survival "more fractionated" vs " less fractionated" regimes ‐ fixed effects analysis, Outcome 1 One year overall survival, performance status 0‐1. Fixed effects analysis.

Comparison 2 One year overall survival "more fractionated" vs " less fractionated" regimes ‐ fixed effects analysis, Outcome 2 One year overall survival, performance status 2‐4. Fixed effects analysis.
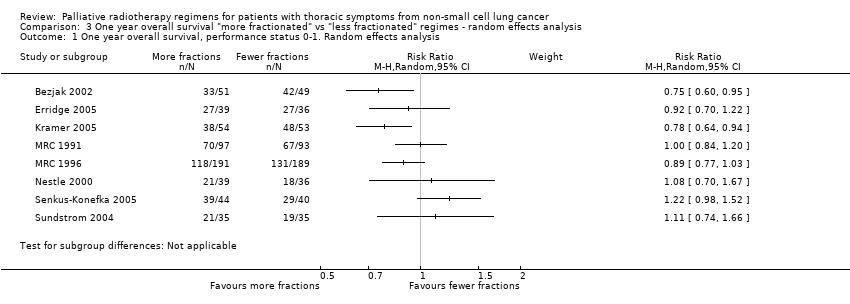
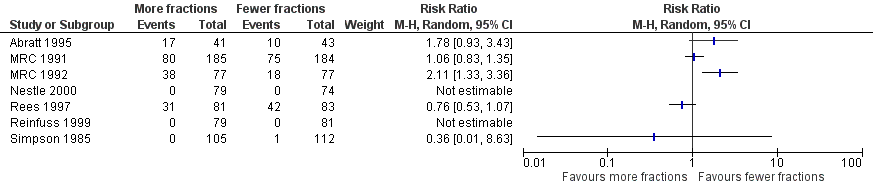
Comparison 3 One year overall survival "more fractionated" vs "less fractionated" regimes ‐ random effects analysis, Outcome 1 One year overall survival, performance status 0‐1. Random effects analysis.

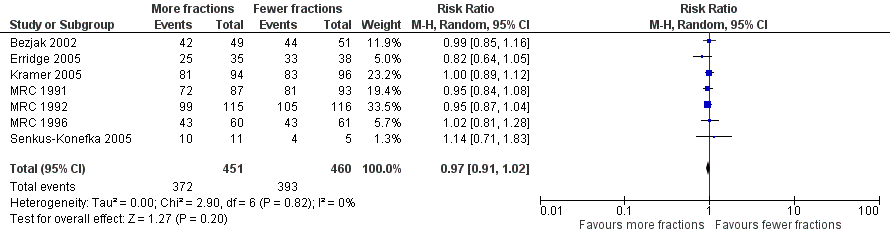
Comparison 3 One year overall survival "more fractionated" vs "less fractionated" regimes ‐ random effects analysis, Outcome 2 One year overall survival, performance status 2‐4. Random effects analysis.
| More fractionated thoracic radiotherapy compared with less fractionated radiotherapy for non small cell lung cancer treated with palliative intent | ||||||
| Patient or population: adults with non small cell lung cancer who are not felt to be curable Settings: specialist oncology units offering external beam radiotherapy Intervention: More fractionated thoracic radiotherapy Comparison: Less fractionated radiotherapy | ||||||
| Outcomes | Illustrative comparative risks* (95% CI) | Relative effect | No of Participants | Quality of the evidence | Comments | |
| Assumed risk | Corresponding risk | |||||
| Fewer fractions | More fractions | |||||
| 1 year overall survival in patients of good performance status (WHO performance status 0‐1) | The mean 1 year overall survival was 25.6% and ranged across control groups from | The mean 1 year overall survival in the intervention groups was higher at | 1081 | ++OO | Heterogeneity considered too great for presentation of summary statistic. Not complete data set as unable to get additional data from all authors, high level of heterogeneity | |
| 1 year overall survival in patients of poor performance status (WHO performance status 2‐4) | The mean 1 year overall survival was 14.6% and ranged across control groups from | The mean 1 year overall survival in the intervention groups was higher at 17.5% (9.1% to 28.6%) | RR 0.96 (0.91 to 1.02) | 911 | +++O | Not complete data set as unable to get additional data from all authors |
| Oesophagitis (grade 3 to 4) | The mean 22.3% ranged across control groups from 0% to 50% | The mean rate of grade 3‐4 oesophagitis in the intervention groups was higher at 25.7% | RR 1.23 (0.81 to 1.87) | 1301 (8 studies) | ++OO | Not reported in all trials. Some reported as patient reported toxicity others physician assessed toxicity |
| Radiation Myelopathy (any grade) | The mean 0.30% ranged across control groups from | The mean rate of radiation myelopathy in the intervention groups was higher at 0.38% (0% to 1.61%) | RR 1.29 (0.37 to 4.51) | 2663 (11 studies) | +++O | Reported in most but not all studies. Not graded and most not confirmed at post‐mortem. |
| Radiation pneumonitis (any grade) | The mean 3.9% ranged across control groups from | The mean rate of radiation pneumonitis in the intervention groups was lower at 2.4% (1.6% to 4%) | RR 0.62 (0.23 to 1.66) | 533 (3 studies) | ++OO | Not reported in the majority of trials and not graded. |
| *The basis for the assumed risk (e.g. the median control group risk across studies) is provided in footnotes. The corresponding risk (and its 95% confidence interval) is based on the assumed risk in the comparison group and the relative effect of the intervention (and its 95% CI). | ||||||
| GRADE Working Group grades of evidence | ||||||
| RT REGIMEN | STUDY | BED(10): Gy | BED(25): Gy | BED(1.7): Gy |
| 60Gy/39F/6W | Nestle 2000 | 72 | 65 | 131 |
| 50Gy/25F/5W | Reinfuss 1999; Sundstrom 2004 | 60 | 54 | 109 |
| 45Gy/15/3.5W (4 days per week) | Abratt 1995 | 59 | 50 | 109 |
| 45Gy/18F/3.4W | Teo 1988 | 56 | 50 | 111 |
| 40GY/10F/4W(split) | Reinfuss 1999; Simpson 1985 | 56 | 46 | 134 |
| 42Gy/15F/3W | Sundstrom 2004 | 54 | 47 | 111 |
| 39Gy/13F/2.4W | MRC 1996 | 51 | 44 | 108 |
| 40Gy/20F/4W | Simpson 1985 | 48 | 43 | 87 |
| 36Gy/12F/2.3W | MRC1996 | 47 | 40 | 100 |
| 35Gy/10F/2.2W (4 days per week) | Abratt 1995 | 47 | 40 | 107 |
| 32Gy/16F/10d (twice daily) | Nestle 2000 | 38 | 35 | 70 |
| 31.2Gy/4F/4W (weekly) | Teo 1988 | 55 | 41 | 174 |
| 30Gy/10F/2W | MRC 1991, Simpson 1985, Kramer 2005, Erridge 2005 | 39 | 34 | 83 |
| 27Gy/6F/2W (3 days per week) | MRC 1991 | 39 | 32 | 98 |
| 22.5Gy/5F/5d | Rees 1997 | 33 | 27 | 82 |
| 20Gy/5F/5d | Senkus‐Konefka 2005, Bezjak 2002 | 28 | 23 | 67 |
| 17Gy/2F/8d (weekly) | MRC 1991, MRC 1992, MRC 1996, Rees 1997, Sundstrom 2004 | 31 | 23 | 102 |
| 16Gy/2F/8d (weekly) | Senkus‐Konefka 2005, Kramer 2005 | 29 | 21 | 91 |
| 10Gy/1F/1d | MRC 1992, Bezjak 2002, Erridge 2005 | 20 | 14 | 69 |
| BED(y): biologically effective dose (Gy), calculated by the formula: BED(y) = n x d (1+ d/ (alpha/beta)), where n=number of fractions, d= size of each fraction(Gy), and alpha/beta is constant, of value y, for a given tissue type (Fowler 1989, Joiner 1997) |
| STUDY | RT REGIMEN | Performance Status | Median survival | 1‐year survival | 2‐year survival |
| Abratt 1995 | 45Gy/15F | WHO 0‐2 | 8.5 months | 37% | N/A |
| Abratt 1995 | 35Gy/10F | WHO 0‐2 | 8.5 months | 40% | N/A |
| MRC 1991 | 30Gy/10F | Any | 5.9 months | 23% | 5% |
| MRC 1991 | 17Gy/2F | Any | 6.0 months | 20% | 5% |
| MRC 1991 (personal correspondence) | 30Gy/10F | WHO 0‐1 | 27.8% | N/A | |
| MRC 1991 (personal correspondence) | 30Gy/10F | WHO 2‐4 | 17.24% | N/A | |
| MRC 1991 (personal correspondence) | 17Gy/2F | WHO 0‐1 | 28.9% | N/A | |
| MRC 1991 (personal correspondence) | 17Gy/2F | WHO 2‐4 | 12.9% | N/A | |
| MRC 1992 | 17Gy/2F | WHO 2‐4 | 3.3 months | 14% | 2% |
| MRC 1992 | 10Gy/1F | WHO 2‐4 | 4.0 months | 9% | 3% |
| MRC 1996 | 17Gy/2F | WHO 0‐2 | 7 months | 31% | 12% |
| MRC 1996 | 36‐39Gy/12‐13F | WHO 0‐2 | 9 months | 36% | 9% |
| MRC 1996 (personal correspondence) | 17Gy/2F | WHO 0‐1 | 30.7% | N/A | |
| MRC 1996 (personal correspondence) | 17Gy/2F | WHO 2 | 29.5% | N/A | |
| MRC 1996 (personal correspondence) | 36‐39Gy/12‐13F | WHO 0‐1 | 38.4% | N/A | |
| MRC 1996 (personal correspondence) | 36‐39Gy/12‐13F | WHO 2 | 28.3% | N/A | |
| Nestle 2000 | 32Gy/16F | KPS ≥80 | 50% | 3.1% | |
| Nestle 2000 | 32Gy/16F | KPS ≥50 | 8.4 months | 36.1% | 9% |
| Nestle 2000 | 60Gy/30F | KPS ≥80 | 45.7% | 7% | |
| Nestle 2000 | 60Gy/30F | KPS ≥50 | 8.3 months | 38.1% | 9% |
| Rees 1997 | 17Gy/2F | Any | 6 months* | 18%* | 5%* |
| Rees 1997 | 22.5Gy/5F | Any | 6 months* | 22%* | 12%* |
| Reinfuss 1999 | 40Gy/10F (split) | KPS >50 | 8.3 months | 28% | 6% |
| Reinfuss 1999 | 50Gy/25F | KPS >50 | 12 months | 48% | 18% |
| Simpson 1985 | 30Gy/10F | KPS >60 | 6.4 months | 22%* | 8%* |
| Simpson 1985 | 40Gy/20F | KPS >60 | 6.9 months | 30%* | 8%* |
| Simpson 1985 | 40Gy/20F (split) | KPS >60 | 6.2 months | 30%* | 8%* |
| Sundstrom 2004 | 17Gy/2F | Any | 8.2 months | 29% | 8% |
| Sundstrom 2004 | 42Gy/15F | Any | 7 months | 29% | 13% |
| Sundstrom 2004 | 50Gy/25F | Any | 6.8 months | 31% | 10% |
| Teo 1988 | 31Gy/4F | Any | 5 months | 18%* | 5% |
| Teo 1988 | 45Gy/18F | Any | 5 months | 22%* | 5% |
| Senkus‐Konefka | 20Gy/5F | WHO 1‐4 | 5.3 months | 11% | N/A |
| Senkus‐Konefka | 16Gy/2F | WHO 1‐4 | 8 months | 27% | N/A |
| Senkus‐Konefka (personal correspondence) | 20Gy/5F | WHO 0‐1 | 12% | N/A | |
| Senkus‐Konefka (personal correspondence) | 20Gy/5F | WHO 2‐4 | 11% | N/A | |
| Senkus‐Konefka (personal correspondence) | 16Gy/2F | WHO 0‐1 | 29% | N/A | |
| Senkus‐Konefka (personal correspondence) | 16Gy/2F | WH0 2‐4 | 25% | N/A | |
| Kramer | 16Gy/2F | WHO 3‐4, or stage 4 WHO 0‐2 | N/A | 10.9% | N/A |
| Kramer | 30Gy/10F | WHO 3‐4, or stage 4 WHO 0‐2 | N/A | 19.6% | N/A |
| Kramer (personal correspondence) | 30Gy/10F | WHO 0‐1 | 28.6% | 9% | |
| Kramer (personal correspondence) | 30Gy/10F | WHO 2‐4 | 13.4% | 0% | |
| Kramer (personal correspondence) | 16Gy/2F | WHO 0‐1 | 7.8% | 0% | |
| Kramer (personal correspondence) | 16Gy/2F | WHO 2‐4 | 12.5% | 2.3% | |
| Bezjak | 10Gy/1F | WHO 0‐3 | 4.2 months | 15%* | N/A |
| Bezjak | 20Gy/5F | WHO 0‐3 | 6 months | 26%* | N/A |
| Erridge | 30Gy/10F | WHO 0‐3 | 22.7 weeks | 28% | 8% |
| Erridge | 10Gy/1F | WHO 0‐3 | 28.3 weeks | 19% | 4% |
| Erridge (personal correspondence) | 30Gy/10# | WHO 0‐1 | 31.6% | 7.9% | |
| Erridge (personal correspondence) | 30Gy/10# | WHO 2‐4 | 28.1% | 9.4% | |
| Erridge (personal correspondence) | 10Gy/1# | WHO 0‐1 | 25.7% | 5.7% | |
| Erridge (personal correspondence) | 10Gy/1# | WHO 2‐4 | 14.7% | 2.9% |
| Outcome or subgroup title | No. of studies | No. of participants | Statistical method | Effect size |
| 1 Radiation Myelopathy (any grade) Show forest plot | 11 | 2663 | Risk Ratio (M‐H, Fixed, 95% CI) | 1.27 [0.39, 4.13] |
| 2 Pneumonitis (any grade) Show forest plot | 3 | 533 | Risk Ratio (M‐H, Fixed, 95% CI) | 0.61 [0.23, 1.60] |
| 3 Oesophagitis (grade 3‐4) Show forest plot | 7 | Risk Ratio (M‐H, Random, 95% CI) | Subtotals only | |
| 4 Oesophagitis (any grade) Show forest plot | 10 | Risk Ratio (M‐H, Random, 95% CI) | Subtotals only | |
| Outcome or subgroup title | No. of studies | No. of participants | Statistical method | Effect size |
| 1 One year overall survival, performance status 0‐1. Fixed effects analysis Show forest plot | 8 | Risk Ratio (M‐H, Fixed, 95% CI) | Subtotals only | |
| 2 One year overall survival, performance status 2‐4. Fixed effects analysis Show forest plot | 7 | 911 | Risk Ratio (M‐H, Fixed, 95% CI) | 0.96 [0.91, 1.02] |
| Outcome or subgroup title | No. of studies | No. of participants | Statistical method | Effect size |
| 1 One year overall survival, performance status 0‐1. Random effects analysis Show forest plot | 8 | Risk Ratio (M‐H, Random, 95% CI) | Subtotals only | |
| 2 One year overall survival, performance status 2‐4. Random effects analysis Show forest plot | 7 | 911 | Risk Ratio (M‐H, Random, 95% CI) | 0.97 [0.91, 1.02] |