비소 세포 폐암에 대한 수술후 방사선 치료
초록
배경
완전 절제된 비소 세포 폐암 (NSCLC) 환자의 치료에서 수술 후 방사선 치료 (PORT)의 역할은 명확하지 않았다. 체계적인 검토와 개별 참가자 데이터 메타 분석을 통해 무작위 통제 연구 (RCT)에서 얻은 증거를 평가했다. 그 결과는 2013년 Lung Cancer에 처음으로 출판됐다.
목적
완전 절제 된 비소 세포 폐암 환자에서 PORT가 생존과 재발에 미치는 영향을 평가 하고자 한다. 미리 정의 된 환자 하위 그룹이 PORT에 어느 정도 도움이 되는지 조사한다.
검색 전략
우리는 MEDLINE 및 CANCERLIT (1965년 7월 8일부터 2016년 7월 8일까지)에 시행 등록부의 정보, 관련 회의 진행 과정의 수색했고 시행자 및 조직과의 토론을 보완했다.
선정 기준
치료에 대한 사전 지식을 배제한 방법을 사용하여 비소 세포 폐암으로 참가자를 무작위 추출한 경우, 수술 대 수술과 방사선 요법의 임상 시험을 포함시켰다.
자료 수집 및 분석
우리는 모든 무작위 임상 시험의 개별 참가자로부터 업데이트 된 정보를 사용하여 정량적 메타 분석을 수행했다. 우리는 연구에 속한 사람들로부터 모든 참가자에 대한 데이터를 모색했다. 생존과 마지막 추적 관찰 날짜뿐만 아니라 치료 할당, 무작위 날짜, 연령, 성별, 조직 세포 유형, 단계, 노드 상태 및 수행 상태에 대한 세부 정보를 업데이트 된 개별 참가자 데이터 (IPD)를 얻었다. 잠재적 편향을 피하기 위해 우리는 조사자의 원래 분석에서 제외 된 참가자를 포함하여 모든 무작위 참가자에 대한 정보를 요청했다. 우리는 생존 종점에 대한 치료 의도에 대한 모든 분석을 실시했다.
주요 결과
우리는 수술 대 수술과 방사선 치료를 평가하는 14가지 임상 시험을 확인했다. 개별 참가자 데이터는 이 실험 중 11회에 적용되었으며 우리의 분석은 2343명의 참가자 (1511명 사망)를 기준으로 했다. 결과적으로 PORT가 생존율에 완전한 반대 영향을 미쳤으며, 위험율은 1.18이거나 사망 위험이 18% 증가했다. 이는 2 년 (95% 신뢰 구간 (CI) 2% ˜ 9%)에서 5%의 절대적인 손실로 전체 생존율을 58%에서 53%로 낮추는 것과 동일하다. 하위 집단 분석은 참가자의 하위 집단 공변량에 의한 PORT의 영향에 차이가 없음을 보여 주었다.
우리는 삶의 질과 부작용에 대한 PORT의 효과분석을 수행하지 않았다. 연구원들은 이러한 시도 중에 삶의 질 정보를 정기적으로 수집하지 않았으며, PORT의 이점이 관찰 된 자료의 단점을 상쇄하지는 않을 것 이다. 임상 시험에서 비뚤림 위험은 낮다고 간주된다.
연구진 결론
11건의 실험과 2343명의 참가자의 결과는 PORT가 완전히 절제 된 비소 세포 폐암 환자에게 해로우며 이러한 환자의 일상적인 치료에 사용되어서는 안된다는 것을 보여준다. 진행중인 RCT의 결과가 N2 종양 환자에게 미치는 현대 방사선 사용의 효과를 명확히 할 것이다.
PICO
쉬운 말 요약
비소 세포 폐암에 대한 수술후 방사선 치료
연구의 질문
수술 후 방사선 치료를 받으면 비소 세포 폐암 환자의 수명이 더 길어 집니까?
배경
비소 세포 폐암은 가장 흔한 유형의 폐암이다. 종양이 초기 단계이고 너무 크지 않고 신체의 다른 부위로 퍼지지 않은 경우 의사는 대개 종양을 제거하기 위해 수술한다. 방사선 치료 (엑스레이로 치료)는 수술 후 남은 암세포를 죽이려고 사용될 수 있다.
1998년에 우리는 개별 환자 데이터를 체계적으로 검토하고 메타 분석하여 이 치료법의 시도 인 수술 후 방사선 요법 (PORT)을 관찰했다. 이 리뷰에서는 유사한 임상 시험에 참여한 모든 환자의 정보를 수집했다. 이 실험을 통해 수술 후 방사선 치료를 받은 비소 세포 폐암 환자와 방사선 요법을 사용하지 않은 수술 환자를 비교 했다. 결과는 1998년 The Lancet에 처음 게시됐다.
이 검토가 완료된 후 많은 실험이 이루어졌다. 용이한 증거가 가능한 한 최신 상태로 유지되도록 우리는 이전 및 신규 모든 시도를 포함하는 개별 참여자 데이터의 새로운 체계적 검토 및 메타 분석을 수행했다. 1998년의 리뷰에서는 수술 후 방사선 치료를받는 것이 (1) 환자가 더 오래 살 수있게하고, (2) 암의 재발을 막고 (재발), (3) 암이 신체의 다른 부위로 퍼지는 것을 멈추는지를 알아내는 것을 목표로했다 (전이).
이 업데이트 된 결과는 2013년 Lung Cancer에 처음 게시됐다.
연구 특성
2016년 7월 8일까지 관련 연구를 수색했습니다. 이 연구는 전 세계에서 시행 된 11개의 임상 시험과 2343개의 임상 시험 자료를 제공한다. 연구는 1966년 부터 1998년 사이 시행됐다.
주요 결과
결과적으로 PORT 치료를 받은 환자의 수가 수술 후 2년 (100명 중 53명)이 수술 후 PORT를받지 않은 환자 (100명 중 58명)보다 적은 것으로 나타났다. 연구원은 임상 시험에 포함 된 환자 유형별로 PORT의 효과에 차이가 없다고 보고했다.
연구원은 삶의 질 정보를 규칙적으로 수집하지 않았으며, PORT의 이점이 관찰 된 자료의 불이익을 상쇄하지는 않을 것이다.
비소 세표 폐암 환자에게 수술시 종양을 성공적으로 제거한 후에 시행되는 방사선 치료는 유용하지 않으며 일상적인 치료로 사용되어서는 안된다. 그러나 재발 위험이 높은 환자를위한 새로운 유형의 방사선 치료에 대한 연구가 계속 진행 중이다.
근거의 질
이러한 체계적인 검토 및 메타 분석은 개별 참가자 데이터를 사용하며 이러한 유형의 검토는 일반적으로 우수한 수준으로 간주된다. 우리는 언어 또는 출판지의 제약 받지 않고 가능한 한 모든 연구를 조사했다. 이 메타 분석에는 자격을 갖춘 모든 참가자의 88%가 참여했다.
연구가 잘 설계되고 수행되었으며, 재검토 질문에 대한 언급이 이루어졌으며, 시험 전반에 걸쳐 일관된 효과가 나타났다. 분석에 포함되지 않은 모든 데이터의 영향은 적다.
Authors' conclusions
Background
Description of the condition
Worldwide, carcinoma of the lung is the main cause of cancer death. More than 1.5 million new cases are diagnosed each year (Jemal 2011), about 85% of which involve non‐small cell lung cancer (American Cancer Society 2007). Surgery is the treatment of choice for early non‐small cell lung cancer (NSCLC) (NSCLCCG 1995), but only about 20% of tumours are suitable for potentially curative surgery (Datta 2003). Even for patients with apparently completely resected disease, survival is only around 40% at five years. In an effort to improve local‐regional control of the disease and to increase survival, investigators have explored adjuvant postoperative radiotherapy (PORT) as a therapeutic option.
Description of the intervention
This review concentrated on randomised controlled trials (RCTs) that tested surgery alone compared with surgery followed by radiotherapy. Radiotherapy in these trials was given by cobalt therapy, by cobalt therapy and linear accelerators or by linear accelerators only.
How the intervention might work
Radiotherapy may be given after surgery with the aim of killing any remaining cancer cells.
Why it is important to do this review
Despite the conduct of several RCTs (most in the 1980s and 1990s) that recruited a total of more than 2000 patients, the role of PORT in the treatment of patients with NSCLC has remained unclear. Individually, trials showed inconclusive and conflicting results. However, because of their size (74 to 539 participants), individual trials did not have sufficient statistical power to detect the moderate survival differences that might be expected with PORT. We therefore initiated an individual participant data meta‐analysis to assess this question. This approach to meta‐analysis and systematic review involves the central collection, validation and analysis of original trial data. It does not rely on data extracted from publications. At the outset, the project management group contacted the investigators responsible for each trial and established the PORT Meta‐analysis Trialists Group, under whose auspices the meta‐analysis was conducted and published. This review was first published in The Lancet in 1998 (PORT 1998). In 2005, the meta‐analysis was updated (PORT 2005) with data from one new trial (Italy 2002). In 2009, the meta‐analysis was updated again to include data from another new trial (Korea 2007). However, since this review was last updated, new methods developed to assess treatment by patient covariates that are methodologically more appropriate and less prone to bias have prompted this latest update of the Cochrane review (Fisher 2011). Furthermore, changes over time to the tumour‐node‐metastasis (TNM) staging system have been taken into account in this update, and although the data did not permit use of the seventh TNM edition, they did allow us to convert tumour stage from the fourth (Mountain 1987) to the fifth/sixth (Mountain 1997) edition.
Objectives
To evaluate effects of PORT on survival and recurrence in patients with completely resected NSCLC. To investigate whether predefined patient subgroups benefit more or less from PORT.
Methods
Criteria for considering studies for this review
Types of studies
To be included, both published and unpublished completed trials had to be properly randomised using established methods (not quasi‐randomised). Trials could not have been confounded by additional therapeutic differences between the two arms and must have commenced randomisation on or after 1 January 1965. Trials should have aimed to randomise participants with completely resected non‐small cell lung cancer between radiotherapy and no immediate further treatment. Trials should not have used orthovoltage radiotherapy.
Types of participants
Eligible trials included individuals with histologically confirmed NSCLC who had undergone a potentially curative resection. We included in the meta‐analyses individual participant data from all randomised participants and, when possible, obtained data for individuals who had been excluded from the original trial analyses. We excluded from the meta‐analyses, participants with small cell lung cancer, who were included in early trials that randomised all types of lung cancer.
Types of interventions
-
Surgery versus surgery + postoperative radiotherapy (PORT).
Types of outcome measures
-
Survival.
-
Recurrence‐free survival.
-
Local recurrence‐free survival.
-
Distant recurrence‐free survival.
Primary outcomes
The primary outcome of overall survival was defined as the time from randomisation until death by any cause. Living participants were censored on the date of last follow‐up.
Secondary outcomes
Recurrence‐free survival was defined as the time from randomisation until first recurrence, or death by any cause. Participants alive without disease were censored on the date of last follow‐up. To avoid bias from under‐reporting of subsequent events, time to local‐regional recurrence was defined as the time from randomisation until first local‐regional recurrence, with participants experiencing earlier distant recurrences censored at the time of distant recurrence. Similarly, for time to distant recurrence, participants experiencing earlier local‐regional recurrences were censored on that date. Participants who died without recurrence were censored on the date of death. Data on quality of life were not routinely collected in these trials; therefore we could not analyse the data in this review.
Search methods for identification of studies
To limit publication bias, we included published and unpublished trials with no restrictions based on language. We carried out searches of MEDLINE (Appendix 1) and CANCERLIT from 1965 (using The Cochrane Collaboration's optimal strategy (Lefebvre 2001; Lefebvre 2008). We supplemented searches of trial registers by conducting handsearches of conference proceedings and reference lists of trial publications and review articles. We asked our collaborators if they knew of additional trials. We carried out the most recent searches in July 2016.
In 1997, we identified trials by electronic searches of MEDLINE and CANCERLIT, using a modified version of the optimal search strategy of The Cochrane Collaboration (Dickersin 1995), supplemented by handsearches of Proceedings of the American Society of Clinical Oncology (ASCO) (1990 to 2016) and the World Conference on Lung Cancer (1990 to 2015) and bibliographies of books, reviews and specialist journals. We also searched trial registers (Cochrane Central Register of Controlled Trials (CENTRAL), the National Cancer Institute Physicians Data Query Clinical Protocols and United Kingdom Co‐ordinating Committee for Cancer Research)and asked all trialists who took part in the meta‐analysis to help to identify additional trials. We regularly updated searches to identify new trials and to assess the status of any ongoing trials. Search updates in October 2002 and August 2003 identified one new eligible trial (Italy 2002), and the search update carried out in 2009 identified two new eligible trials: a Polish trial (Dymek 2003) and a Korean trial published as an abstract (Korea 2007). We last carried out searches in July 2016 and identified no new eligible trials.
Electronic searches
We modified The Cochrane Collaboration's optimum search strategy for retrieving RCTs from MEDLINE (Appendix 1) to specifically retrieve RCTs of radiotherapy for NSCLC, and we used this search strategy to search MEDLINE and CANCERLIT (1965 to 2016).
In addition, we searched the following electronic bibliographic databases.
-
The Cochrane Central Register of Controlled Trials (CENTRAL) (1995 to 8 July 2016) (Appendix 2).
-
Proceedings of annual meetings of the American Society for Clinical Oncology (ASCO) (1995 to 2016).
We used the following trial registers to supplement searches of electronic databases with trials that were not (yet) published or were still recruiting patients.
-
United Kingdom Coordinating Committee on Cancer Research (UKCCCR) Trials Register.
-
ClinicalTrials.gov.
-
Physicians Data Query Protocols (open and closed).
-
Current Controlled Trials ‘metaRegister’ of controlled trials.
Searching other resources
Handsearches
We carried out the following handsearches to identify trials that may have been reported only as abstracts, or that might have been missed in the searches described above.
-
Proceedings of the American Society for Clinical Oncology (ASCO), 1990 to 1994.
-
Proceedings of the International Association for the Study of Lung Cancer (IASLC) World Lung Cancer Conference 1990 to 2015.
Searches of reference lists
We searched the bibliographies of all identified trials and review articles.
Correspondence
We asked all participating trialists to review and supplement a provisional list of trials.
Data collection and analysis
Selection of studies
Two members of the Project Management Group (SB, LR) checked all titles and abstracts identified by electronic searching and handsearching of conference proceedings, and obtained full publications for those thought to be potentially relevant. We sought individual participant data (IPD) from trial authors, including updated follow‐up, when available.
Data extraction and management
We sought IPD for all eligible trials, as well as updated information on survival, recurrence and date of last follow‐up, and details of treatment allocated, date of randomisation, age, sex, histological cell type, stage and performance status.
We used standard checks to identify missing data. We verified data, for example, by checking the order of the dates of randomisation, and assessed data validity and consistency. To assess randomisation integrity, we checked patterns of treatment allocation and balance of baseline characteristics by treatment arm. We checked follow‐up of surviving participants to ensure that it was balanced by treatment arm and up‐to‐date. We resolved queries, and each trial investigator or statistician verified the final database.
As stage was recorded using different classification systems, for the purposes of this meta‐analysis we translated all stage data to a common staging system, which has been updated since the original analysis to reflect the TNM sixth edition classification (Table 1; Table 2).
| T stage | N stage | M stage | Meta‐analysis stage | AJCC stage |
| 0, 1, 2, X, iS | 0 | 0 | I | I |
| 0, 1, 2, X, iS | 1 | 0 | II | II |
| Any | 2, 3 | 0 | III | III non‐metastatic |
| 3, 4 | Any | 0 | III | III non‐metastatic |
| Any | Any | 1 | IV | Any metastatic |
AJCC = American Joint Committee on Cancer.
| T stage | N stage | M stage | Meta‐analysis stage |
| 1, 2 | 0 | 0 | I |
| 1, 2 | 1 | 0 | II |
| 3 | 0 | 0 | II |
| 1, 2 | 2 | 0 | III |
| 3 | 1, 2 | 0 | III |
| Any | Any | 1 | IV |
Assessment of risk of bias in included studies
We assessed included studies using the risk of bias tool of The Cochrane Collaboration, as outlined in Table 8.5c of the Cochrane Handbook for Systematic Reviews of Interventions (Higgins 2011), two authors (SB, LR) checked these studies. We considered adequate sequence generation and allocation concealment to be most important; therefore a judgement of low risk was desirable for these domains for all trials. Blinding was not appropriate owing to the nature of the treatments, and any issues surrounding reporting of incomplete outcome data, selective outcome reporting or attrition bias were overcome by collection of IPD.
Measures of treatment effect
Unless otherwise stated, we prespecified all analyses in the protocols and carried out an intention‐to‐treat analysis. For each outcome, we used the log‐rank expected number of events and variance to calculate individual trial hazard ratios (HRs), which we pooled across trials using the fixed‐effect model (Yusuf 1985). We presented overall survival using simple (non‐stratified) Kaplan‐Meier curves (Kaplan 1958) and computed median follow‐up for all participants by using the reverse Kaplan‐Meier method (Schemper 1996).
We analysed 'raw' IPD using in‐house software (SCHARP), then entered the log‐rank summary statistics of these analyses (O‐E and variance) into RevMan (RevMan 2014). We presented results as absolute differences at five years, calculated with the HR and baseline event rate on the surgery alone arm; we assumed proportional hazards (Parmar 1995). We similarly calculated confidence intervals for absolute differences from the baseline event rate and the HR at 95% confidence interval boundary values.
To explore any impact of trial characteristics on effects of adjuvant chemotherapy on overall survival, we calculated pooled HRs for each prespecified trial group and used Chi2 tests for interaction to investigate differences in treatment effect across trial groups.
Dealing with missing data
We outlined all desired variables in a protocol (available on request) and requested missing variables from those who carried out the trials.
Assessment of heterogeneity
We used Chi2 tests and the I2 statistic (Higgins 2002) to test for differences in treatment effect across groups of trials or groups of participants.
Assessment of reporting biases
As we collected IPD, we encountered no reporting biases.
Data synthesis
When we could get data, we included all eligible trials in the analyses. We carried out these analyses in SCHARP (in‐house software), Stata (Stata 2013) and RevMan (RevMan 2014).
Subgroup analysis and investigation of heterogeneity
To investigate differences in treatment effect across participant subgroups, we undertook Cox regressions, including the relevant treatment by subgroup interaction term within each trial. We pooled these interaction coefficients (HRs) across trials (Fisher 2011) and investigated whether differences in treatment effect could be identified that varied with participant age, sex, histological cell type, tumour stage or performance status.
Sensitivity analysis
We outlined in the protocol that HRs for overall survival would be calculated, excluding any trials that were clear outliers.
Results
Description of studies
We identified 14 eligible trials (one unpublished) and included 11 trials in the review (see Characteristics of included studies). We could not include three trials: Data for two trials were unavailable (Dymek 2003 (150 participants); LCSG 841 (five participants)), and it was unclear whether one study of 155 participants, which was reported as a randomised controlled trial (RCT), was indeed randomised. We were unable to obtain appropriate data for this trial (Austria 1996) (see Characteristics of excluded studies).
Therefore, this update is based on the results of 11 RCTs (Belgium 1966; CAMS 1981; EORTC 08861; GETCB 04CB86; GETCB 05CB88; Italy 2002; Korea 2007; LCSG 773; Lille 1985; MRC LU11; Slovenia 1988) and 2343 individuals. Across these trials, PORT doses ranged from 30 Gy to 60 Gy, given in between 10 and 30 fractions, and considerable diversity was evident in other aspects of radiotherapy planning. All trials included participants with completely resected tumours for which the disease stage was no greater than IIIA. Most trials provided updated follow‐up giving a median of 4.4 years for surviving participants (2.3 to 11.4 years for individual trials). Baseline participant characteristics show that most participants were male with stage II/III squamous cell carcinoma (although histology was unknown for a relatively large number of participants) with good performance status (Table 3).
| Characteristic | Postoperative RT | Surgery only | Total |
| AGE (data from 11 trials) | |||
| < 54 years | 294 | 327 | 621 |
| 55 to 59 years | 267 | 261 | 528 |
| 60 to 64 years | 290 | 276 | 566 |
| > 65 years | 312 | 315 | 627 |
| Unknown | 0 | 1 | 1 |
| SEX (data from 11 trials) | |||
| Male | 988 | 992 | 1980 |
| Female | 175 | 187 | 362 |
| Not recorded | 0 | 1 | 1 |
| HISTOLOGY (data from 9 trials) | |||
| Adenocarcinoma | 195 | 218 | 413 |
| Squamous | 522 | 545 | 1067 |
| Other | 66 | 54 | 120 |
| Unknown | 380 | 363 | 743 |
| META‐ANALYSIS STAGE (data from 11 trials) | |||
| I | 328 | 338 | 666 |
| II | 353 | 366 | 719 |
| III | 463 | 455 | 918 |
| IV | 1 | 0 | 1 |
| Unknown | 18 | 21 | 39 |
| WHO PERFORMANCE STATUS (data from 4 trials; not used) | |||
| Good (0, 1) | 195 | 196 | 391 |
| Poor (2, 3, 4) | 77 | 83 | 160 |
| Unknown | 22 | 21 | 43 |
Risk of bias in included studies
We included only trials with adequate methods of randomisation. We excluded trials that used quasi‐random methods, such as birth date. We thoroughly checked all raw data received on individual participants to ensure both the accuracy of the meta‐analysis database and the quality of randomisation and follow‐up. We resolved all queries and verified final database entries through discussion with the responsible trial investigator or statistician. No RCTs were blinded owing to the nature of the intervention, but the primary outcome is not likely to be influenced by lack of blinding. For two trials, allocation concealment was unclear ‐ one trial was unpublished (EORTC 08861), and one was published only as an abstract (Korea 2007) ‐ but checks on IPD and correspondence with those who supplied the data reassured us that the data had been adequate. We received IPD for all outcomes of interest; therefore we considered reporting bias to be low for all RCTs. We considered all included trials to be at low risk of bias (see Figure 1 and Figure 2).

Methodological quality graph: review authors' judgements about each methodological quality item presented as percentages across all included studies.

Methodological quality summary: review authors' judgements about each methodological quality item for each included study.
Effects of interventions
Results were based on information from 11 RCTs (2343 participants), representing 88% of individuals from all eligible randomised trials. We collected data for 140 out of 142 participants who had been excluded from the original published trial analyses and were reinstated in this meta‐analysis. For one trial, which randomised all histological types of lung cancer (Belgium 1966), we excluded the 20 participants with small cell tumours from the meta‐analysis. Survival and recurrence data were available for all trials. All trials provided information on age, sex and stage, and nine trials provided data on histology (Belgium 1966; CAMS 1981; EORTC 08861; Italy 2002; Korea 2007; LCSG 773; Lille 1985; MRC LU11; Slovenia 1988). Performance status data were available for only four trials (EORTC 08861; Italy 2002; MRC LU11; Slovenia 1988) and were insufficient for assessment of treatment by covariate interactions. All but two trials provided cause of death data (coded as NSCLC, treatment‐related or other) (Italy 2002; LCSG 773), although the trialists themselves questioned the reliability of this information for many trials.
Survival
Survival data were available for all trials and included information from 2343 participants and 1511 deaths (777 PORT, 734 surgery alone). Although the confidence intervals (CIs) for individual trial results were wide, combined results showed a significant adverse effect of PORT on survival (P = 0.001), with a hazard ratio (HR) of 1.18 (95% CI 1.07 to 1.31) (Analysis 1.1), or an 18% relative increase in risk of death. This was equivalent to an absolute detriment of 5% at two years (95% CI 2% to 9%), reducing overall survival from 58% to 53%. Survival curves (Figure 3) appeared to diverge at around four months and remained apart for the five years to which they could be drawn with reasonable reliability. There was some evidence of increased statistical heterogeneity between trials in the current update (I2 = 40%, P = 0.08), compared with the original 1998 meta‐analysis. However, the random‐effects result is similar (HR 1.17, 95% CI 1.02 to 1.34, P = 0.02), and heterogeneity appears largely driven by the Italian trial (Italy 2002). A sensitivity analysis excluding this trial reduces heterogeneity (I2 = 31%, P = 0.16) and gives similar fixed‐effect (HR 1.20, 95% CI 1.08 to 1.33, P = 0.0005) and random‐effects results (HR 1.20, 95% CI 1.06 to 1.37, P = 0.005).
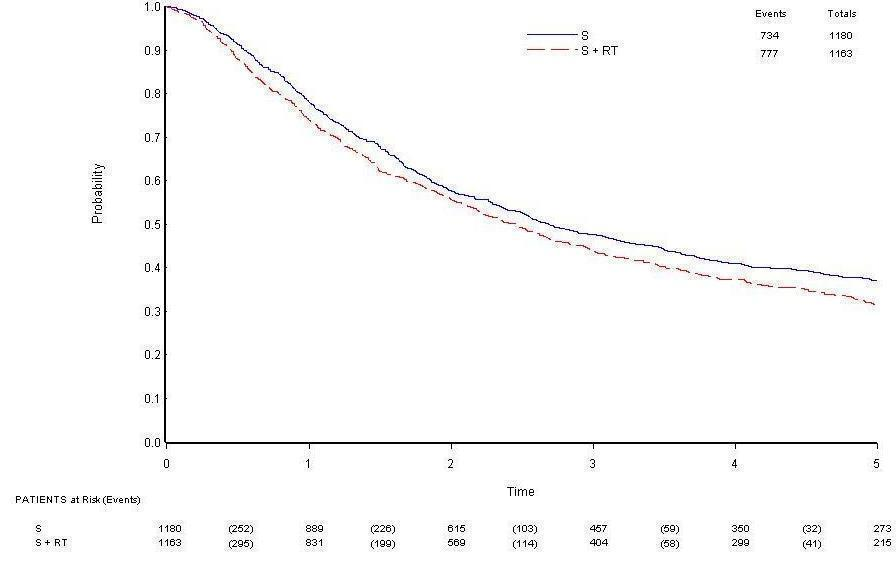
Overall survival.
Cause of death information coded as NSCLC, treatment related or other was available for nine trials. Of 595 coded deaths on PORT, 82% were attributed to NSCLC, 4% to treatment‐related causes and 14% to other causes. For the 565 coded deaths on surgery alone, these figures are 89%, 2% and 9%, respectively.
Local recurrence‐free survival
Data on local‐regional recurrence were available from all trials. Analysis of local‐regional recurrence‐free survival, based on 1556 events (498 local‐regional recurrences (200 on PORT, 298 on surgery alone) and 1058 deaths (593 on PORT, 465 on surgery alone)), gave a HR of 1.12 (95% CI 1.01 to 1.24), significantly in favour of surgery alone (P = 0.03) (Analysis 1.2). There was evidence of statistical heterogeneity between trials (I2 = 47%, P = 0.04), which was not apparent in the 1998 analysis (I2 = 29%, P = 0.19), and for this outcome, the random‐effects result is less convincing (HR 1.10, 95% CI 0.95 to 1.27, P = 0.19) than the fixed‐effect result. However, exclusion of the Italian trial (Italy 2002) again reduces heterogeneity to non‐significant levels (I2 = 22%, P = 0.23), as well as giving similar fixed‐effect (HR 1.15, 95% CI 1.04 to 1.27, P = 0.008) and random‐effects estimates (HR 1.15, 95% CI 1.02 to 1.29, P = 0.02). Results may suggest an increase in local‐regional recurrence on the PORT arm, but the number of local‐regional recurrences alone shows less local‐regional recurrence on the PORT arm and more events when deaths without local‐regional recurrence are included.
Distant recurrence‐free survival
All trials provided data on distant recurrence. Analysis of distant recurrence‐free survival based on 1570 events (892 distant recurrences (438 on PORT, 454 on surgery alone) and 678 deaths (361 on PORT, 317 on surgery alone)) gave an HR of 1.13 (95% CI 1.02 to 1.24) in favour of surgery alone (P = 0.02) (Analysis 1.3). There was no evidence of gross statistical heterogeneity between trials (I2 = 31%, P = 0.15).
Overall recurrence‐free survival
A total of 1597 events were observed, 810 on PORT and 787 on surgery alone. Of these, 445 first events were deaths, 260 participants had local‐regional recurrences and 654 had distant recurrences (238 participants had both local‐regional and distant recurrences, of which 110 were recorded on the same date). The overall HR of 1.10 (95% CI 0.99 to 1.21) potentially suggests an adverse effect of PORT (P = 0.07) (Analysis 1.4). This 10% relative increase in risk of recurrence or death was equivalent to an absolute detriment of 3% at two years (95% CI 0% to 7%), reducing the recurrence‐free survival rate from 48% to 45%. As with local‐regional recurrence‐free survival, there was some evidence of increased statistical heterogeneity between trials (I2 = 44%, P = 0.06) that was not present in the 1998 analysis (I2 = 26%, P = 0.21), and a random‐effects analysis produces a less convincing result (HR 1.09, 95% CI 0.95 to 1.25, P = 0.23). However, a sensitivity analysis excluding the Italian trial (Italy 2002) not only reduces heterogeneity (I2 = 20%, P = 0.26) but also gives similar fixed‐effect (HR 1.13, 95% CI 1.02 to 1.24, P = 0.02) and random‐effects (HR 1.13, 95% CI 1.00 to 1.26, P = 0.04) results.
Analyses by trial characteristics
We planned analysis for overall survival by trial characteristic based on the planned energy beam delivery method (cobalt only, cobalt and linac, linac only) and radiotherapy dose (< 45 Gy, ≥ 45 Gy). We found no difference in effects of treatment on overall survival depending on delivery method (P = 0.18) (Analysis 1.5). We did find a difference by dose of radiotherapy (P = 0.02) (Analysis 1.6), but 80% of data is in the >=45 Gy group, and the result in the < 45 Gy group subgroup alone is not significant.
Analyses by participant covariates
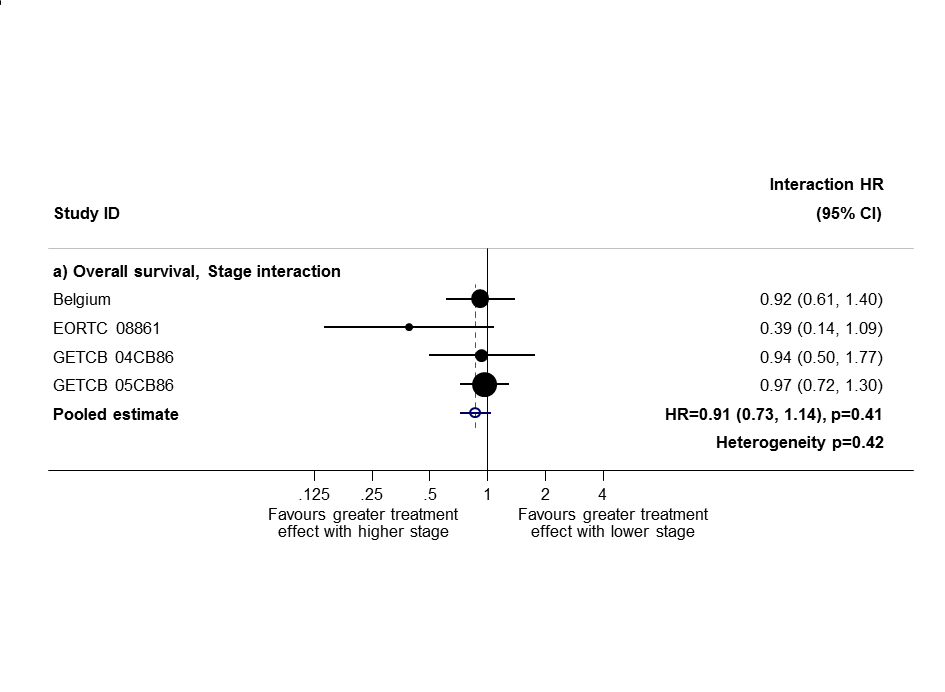
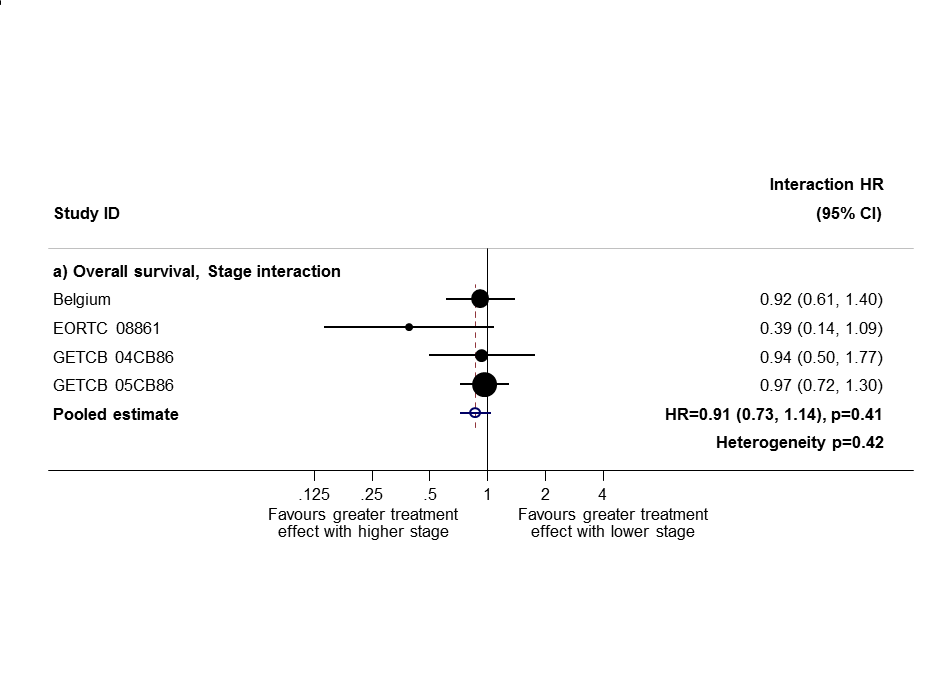
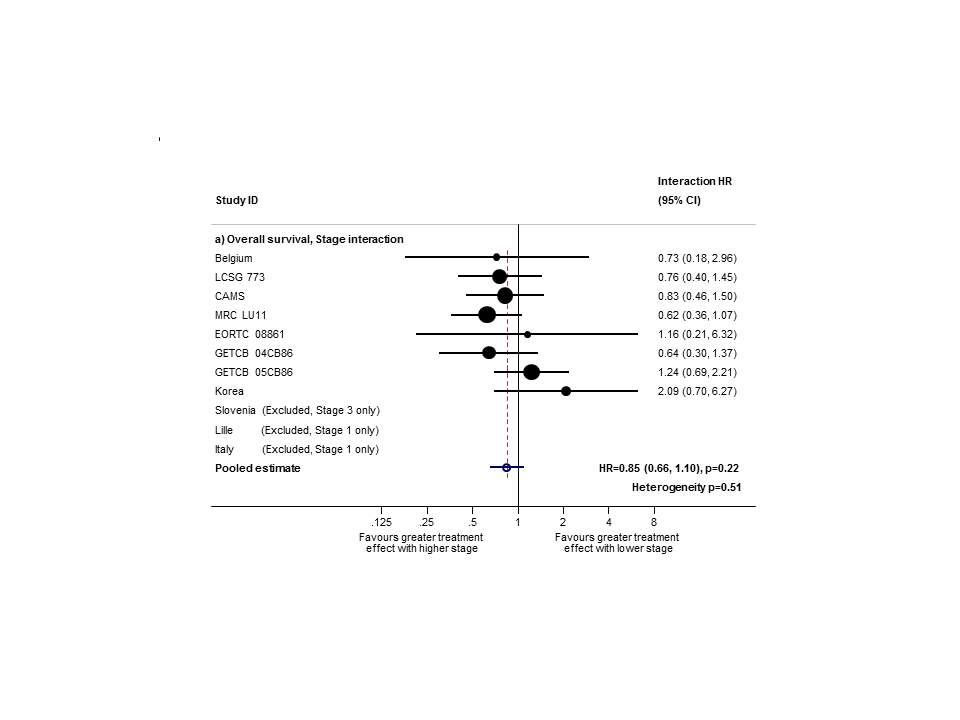
Based on data from all trials, for survival there was no evidence to suggest that PORT was differentially effective by age (interaction P = 0.67), sex (P = 0.49) or histology (P = 0.38). For analysis by stage, we could not include three trials because all participants were in a single stage category (Italy 2002, Lille 1985 stage I only; Slovenia 1988 stage III only). Data from the remaining eight trials provide no evidence to suggest that PORT was differentially effective by stage within individual trials (Figure 4), but the meta‐analysis of these interactions suggests that PORT may be most detrimental in earlier‐stage patients, although the result was not significant (HR = 0.87, 95% CI 0.72 to 1.04, P = 0.12) (Figure 5). Similar results were observed whether or not trials included all three stages or only stage II and III participants (Figure 6; Figure 7). Exploratory analyses of how the effect of PORT on local‐regional, distant and overall recurrence‐free survival varies by stage gave similar results. For analysis by nodal status, we could not include four trials because all participants were in a single subgroup category with N0 (Belgium 1966; Italy 2002; Lille 1985) or N2/3 (Slovenia 1988) disease. Data from the remaining seven trials provided no evidence to suggest that PORT was differentially effective by nodal status within individual trials (Figure 8), nor in a meta‐analysis of these interactions (HR = 0.92, 95% CI 0.76 to 1.11, P = 0.39) (Figure 3).

PORT effect on overall survival by trial according to stage.
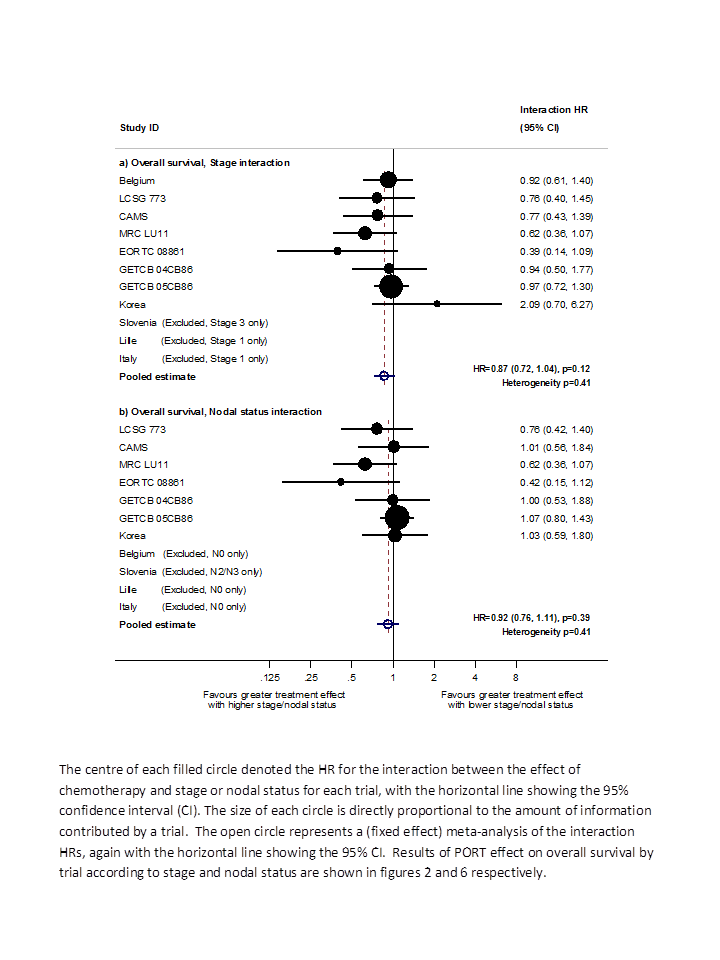
Hazard ratio (HR) for the interaction between the effect of PORT on survival and (a) stage or (b) nodal status.
Sensitivity analysis 1: only trials with all stage subgroups included.

Sensitivity analysis (2): only trials with stage II and III subgroups represented.
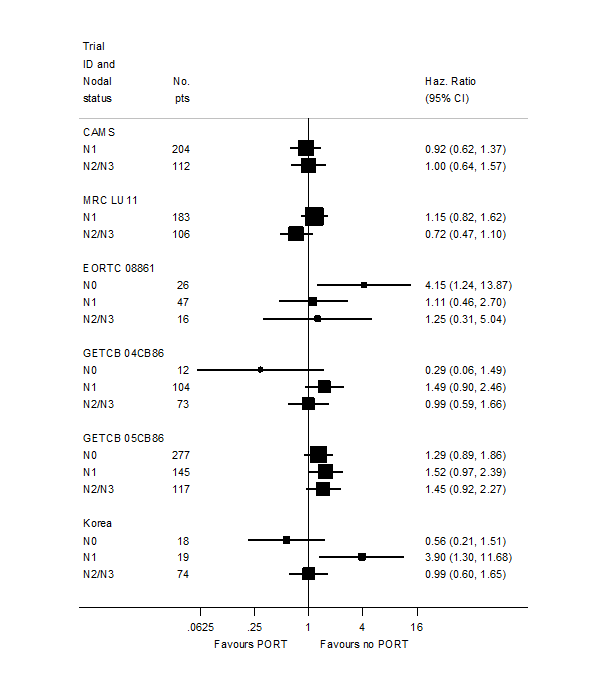
PORT effect on overall survival by trial according to nodal status.
Results for stage and nodal status are different from previously published results (PORT 1998; PORT 2005) largely for two reasons. Here, we have used a method (Fisher 2011) to examine whether the effect of PORT varied by participant covariates that was different from the method used in the original review in 1998 (PORT 1998), and in the previous updates in 2005 and 2009 (PORT 2005). This new method is more appropriate and is less prone to bias. We could not calculate several covariate interactions for trials contributing participants in only a single covariate category; therefore we did not include these studies; this approach, although correct, can provide less power than the methods used previously. Trials not included here also happen to have quite extreme results and have had undue influence on previous analyses.
In this update, we wanted to take account of changes to the TNM staging system; although the data do not allow us to use the seventh edition, they do allow us to convert stage from the fourth to the sixth edition; the major impact of this is that patients previously classified as T3N0M0 (stage IIIA) have been reclassified as stage IIB. This change affected 98 participants and Table 4 shows results for stage and nodal status according to the combination of changes made.
| Trend or interaction 1998 | Trend or interaction 2005 | Trend or interaction 2010 'old' methods | Trend or interaction 2010 'new' methods and TNM changes | |
| Age | P = 0.34 | P = 0.44 | P = 0.32 | P = 0.20 |
| Sex | P = 0.94 | P = 0.92 | P = 0.84 | P = 0.49 |
| Histology | P = 0.75 | P = 0.61 | P = 0.42 | P = 0.38 |
| Stage | P = 0.0003 | P = 0.003 | P = 0.003 | P = 0.12 |
| Nodal status | P = 0.016 | P = 0.02 | P = 0.03 | P = 0.39 |
Discussion
At the outset of this project, despite enrolment of more than 2000 participants in randomised trials, it remained unclear whether postoperative radiotherapy (PORT) was effective for the treatment of patients with non‐small cell lung cancer (NSCLC). The original 1998 meta‐analysis found a significant adverse effect of PORT on survival (P = 0.001) with a hazard ratio (HR) of 1.21 (95% confidence interval (CI) 1.08 to 1.34), or a 21% relative increase in risk of death. We undertook this systematic review and individual participant data meta‐analysis to produce a comprehensive, reliable and up‐to‐date summary of the average effect of PORT in patients with NSCLC, to provide reliable guidance for clinical practice and future research. Therefore, when a new trial of 111 participants was published (Korea 2007), we included this study in an update of the analyses.
Overall, for the primary endpoint of survival, there was clear evidence of a detrimental effect of PORT for patients with completely resected NSCLC. The 18% relative increase in risk of death associated with PORT, equivalent to an overall reduction in survival from 58% to 53% at five years, represents a considerable hazard for these patients. In contrast to the original meta‐analysis and previous updates, this update, using new and more appropriate methods, did not provide evidence that the relative effect of PORT was smaller or larger for patients of any category defined by age, sex or histology. For analysis by stage, PORT tended to be most detrimental in patients with earlier‐stage disease, but this result was not significant once 98 patients had been reclassified according to the updated TNM system. Likewise, analysis by nodal status shows a much less convincing relationship between the effect of PORT and nodal status. Also, in the case of both stage and nodal status analyses, trials with participants in only a single stage or nodal status category (Lille 1985; Italy 2002; Slovenia 1988) had a major impact on the original analyses, and so their appropriate exclusion from these analyses is significant. However, this means that despite inclusion of more trials overall, less data were included in this compared with the original analyses so power is more limited.
All analyses of local‐regional (P = 0.02), distant (P = 0.02) and overall (P = 0.08) recurrence‐free survival (i.e. time to recurrence or death) have suggested an overall adverse effect of PORT. However, the observed detriment was less for these endpoints than for overall survival. For local‐regional recurrence‐free survival, results were driven largely by survival (as deaths account for the majority of events). This suggests that antitumour activity may be attributable to radiotherapy, and that increased risk of death from PORT may be attributable to other mechanisms. Analysis of the local‐regional recurrence‐free interval (i.e. the time to local‐regional recurrence with death and distant recurrence censored) was not presented because such analysis would be difficult to interpret and would be potentially seriously flawed. This difficulty arose because increased risk of death with PORT may mean that patients treated with PORT die before their tumour has had time to recur locally. Thus, such measurement was likely to be an overestimation of local‐regional control.
Inclusion of the most recent trial (Korea 2007) has brought the total number of participants to 2343 across 11 randomised controlled trials (RCTs). As would be expected, the addition of this modestly sized trial has not substantially changed the overall effect of PORT on survival. As evidence from new trials has accumulated, there has been some increase in heterogeneity, particularly in relation to the Italian trial (Italy 2002), which, it should be noted, included only participants with stage I disease.
However, a significant detriment of PORT for survival persists, with similar estimates, irrespective of whether a fixed‐effect or a random‐effects model is used. Results for local‐regional and overall recurrence‐free survival are less convincing. Furthermore, although trials have been conducted over a period of 40 years, with changes in diagnosis and assessment of recurrence and radiotherapy, no clear evidence indicates that the effect of PORT has improved over the decades.
In particular, much discussion over the past few years has focused on modern radiotherapy techniques such as those used in some of the trials included here; the suggestion is that modern radiotherapy (delivered by linear accelerator) may be less detrimental than older methods (delivered by cobalt machines). Recent literature‐based meta‐analyses (Billiet 2014) could not confirm this, providing a reported risk ratio (RR) for overall survival of 0.85 (95% confidence interval (CI) 0.59 to 1.22, P = 0.38) for trials that used only linear accelerators. Indeed when we ran this same analysis using our individual participant data, for those trials that used only linear accelerators (albeit on a different selection of trials), we observed a hazard ratio (HR) for overall survival of 1.02 (95% CI 0.80 to 1.31, P = 0.85; Analysis 1.5). Another recent literature‐based meta‐analysis (Patel 2014) has suggested benefit of PORT for overall survival when radiotherapy has been given only with linear accelerators (HR = 0.77, 95% CI 0.62 to 0.92, P = 0.02); however, this review used a combination of three RCTs (some of which included chemotherapy) and eight retrospective studies. Results of an ongoing trial may clarify this matter (Lung ART‐IGR 2006/1202).
Although this meta‐analysis did not directly address quality of life (none of the trials collected data on patient‐reported quality of life measures), it was unlikely that any benefits of PORT would offset the observed survival disadvantage. Indeed the additional time spent undergoing treatment and the side effects of radiation could reasonably be expected to impair at least short‐term quality of life.
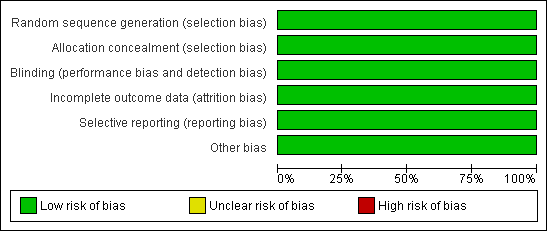
Methodological quality graph: review authors' judgements about each methodological quality item presented as percentages across all included studies.

Methodological quality summary: review authors' judgements about each methodological quality item for each included study.

Overall survival.
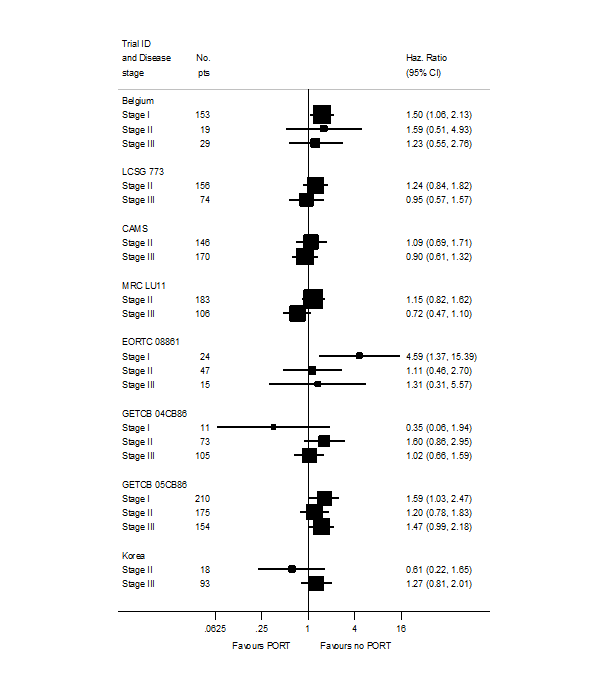
PORT effect on overall survival by trial according to stage.

Hazard ratio (HR) for the interaction between the effect of PORT on survival and (a) stage or (b) nodal status.
Sensitivity analysis 1: only trials with all stage subgroups included.
Sensitivity analysis (2): only trials with stage II and III subgroups represented.

PORT effect on overall survival by trial according to nodal status.

Comparison 1 Surgery + PORT versus surgery alone, Outcome 1 Survival.
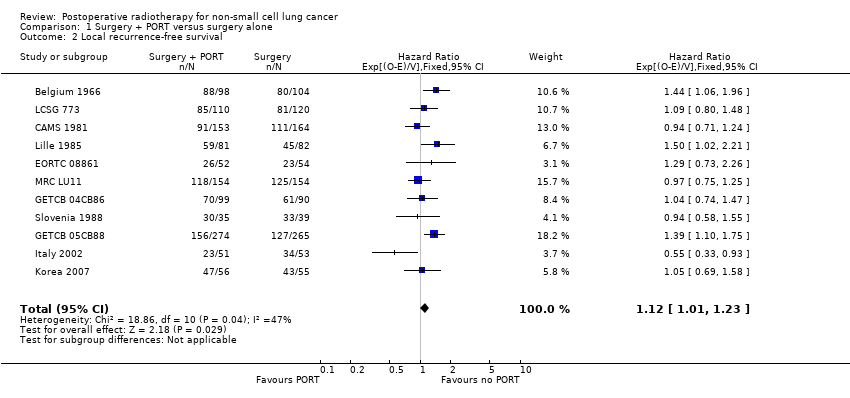
Comparison 1 Surgery + PORT versus surgery alone, Outcome 2 Local recurrence‐free survival.
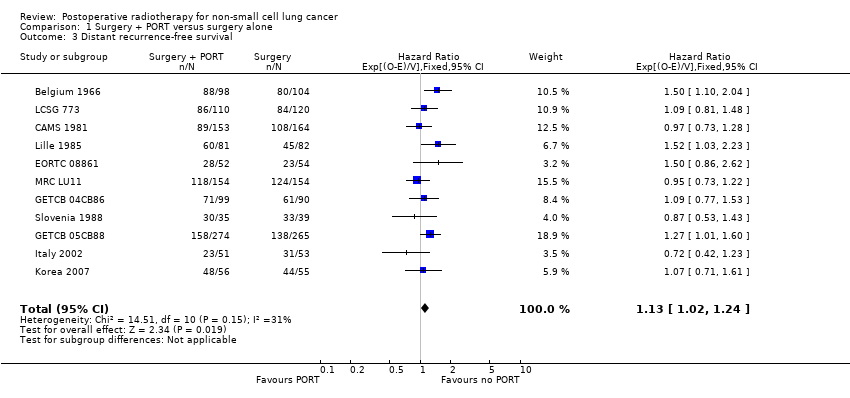
Comparison 1 Surgery + PORT versus surgery alone, Outcome 3 Distant recurrence‐free survival.

Comparison 1 Surgery + PORT versus surgery alone, Outcome 4 Recurrence‐free survival.
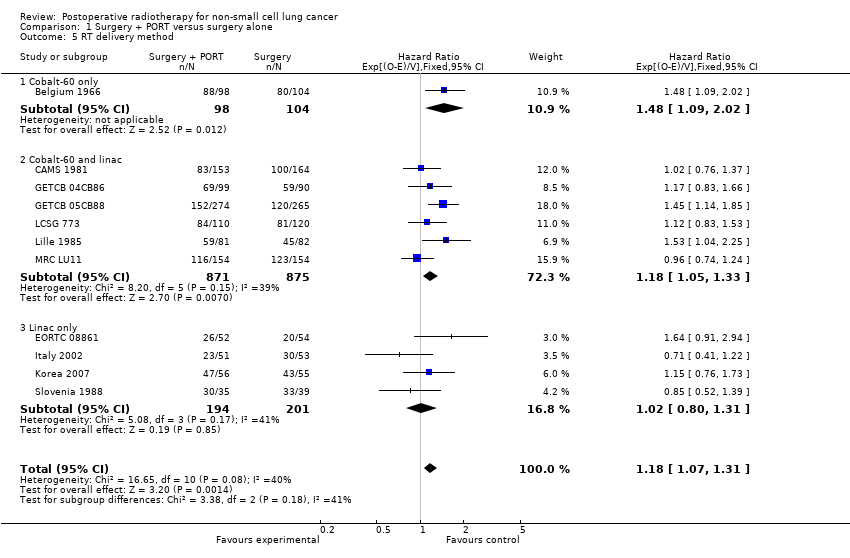
Comparison 1 Surgery + PORT versus surgery alone, Outcome 5 RT delivery method.
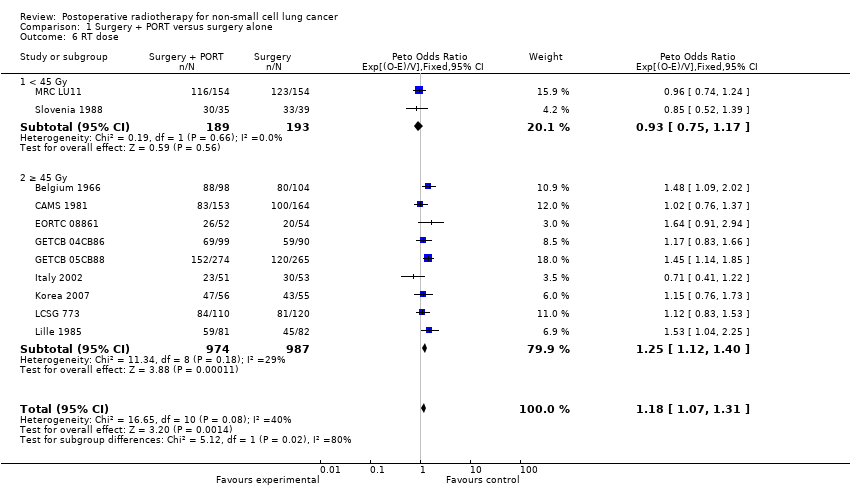
Comparison 1 Surgery + PORT versus surgery alone, Outcome 6 RT dose.
| T stage | N stage | M stage | Meta‐analysis stage | AJCC stage |
| 0, 1, 2, X, iS | 0 | 0 | I | I |
| 0, 1, 2, X, iS | 1 | 0 | II | II |
| Any | 2, 3 | 0 | III | III non‐metastatic |
| 3, 4 | Any | 0 | III | III non‐metastatic |
| Any | Any | 1 | IV | Any metastatic |
| AJCC = American Joint Committee on Cancer. | ||||
| T stage | N stage | M stage | Meta‐analysis stage |
| 1, 2 | 0 | 0 | I |
| 1, 2 | 1 | 0 | II |
| 3 | 0 | 0 | II |
| 1, 2 | 2 | 0 | III |
| 3 | 1, 2 | 0 | III |
| Any | Any | 1 | IV |
| Characteristic | Postoperative RT | Surgery only | Total |
| AGE (data from 11 trials) | |||
| < 54 years | 294 | 327 | 621 |
| 55 to 59 years | 267 | 261 | 528 |
| 60 to 64 years | 290 | 276 | 566 |
| > 65 years | 312 | 315 | 627 |
| Unknown | 0 | 1 | 1 |
| SEX (data from 11 trials) | |||
| Male | 988 | 992 | 1980 |
| Female | 175 | 187 | 362 |
| Not recorded | 0 | 1 | 1 |
| HISTOLOGY (data from 9 trials) | |||
| Adenocarcinoma | 195 | 218 | 413 |
| Squamous | 522 | 545 | 1067 |
| Other | 66 | 54 | 120 |
| Unknown | 380 | 363 | 743 |
| META‐ANALYSIS STAGE (data from 11 trials) | |||
| I | 328 | 338 | 666 |
| II | 353 | 366 | 719 |
| III | 463 | 455 | 918 |
| IV | 1 | 0 | 1 |
| Unknown | 18 | 21 | 39 |
| WHO PERFORMANCE STATUS (data from 4 trials; not used) | |||
| Good (0, 1) | 195 | 196 | 391 |
| Poor (2, 3, 4) | 77 | 83 | 160 |
| Unknown | 22 | 21 | 43 |
| Trend or interaction 1998 | Trend or interaction 2005 | Trend or interaction 2010 'old' methods | Trend or interaction 2010 'new' methods and TNM changes | |
| Age | P = 0.34 | P = 0.44 | P = 0.32 | P = 0.20 |
| Sex | P = 0.94 | P = 0.92 | P = 0.84 | P = 0.49 |
| Histology | P = 0.75 | P = 0.61 | P = 0.42 | P = 0.38 |
| Stage | P = 0.0003 | P = 0.003 | P = 0.003 | P = 0.12 |
| Nodal status | P = 0.016 | P = 0.02 | P = 0.03 | P = 0.39 |
| Outcome or subgroup title | No. of studies | No. of participants | Statistical method | Effect size |
| 1 Survival Show forest plot | 11 | 2343 | Hazard Ratio (95% CI) | 1.18 [1.07, 1.31] |
| 2 Local recurrence‐free survival Show forest plot | 11 | 2343 | Hazard Ratio (95% CI) | 1.12 [1.01, 1.23] |
| 3 Distant recurrence‐free survival Show forest plot | 11 | 2343 | Hazard Ratio (95% CI) | 1.13 [1.02, 1.24] |
| 4 Recurrence‐free survival Show forest plot | 11 | 2343 | Hazard Ratio (95% CI) | 1.10 [0.99, 1.21] |
| 5 RT delivery method Show forest plot | 11 | 2343 | Hazard Ratio (95% CI) | 1.18 [1.07, 1.31] |
| 5.1 Cobalt‐60 only | 1 | 202 | Hazard Ratio (95% CI) | 1.48 [1.09, 2.02] |
| 5.2 Cobalt‐60 and linac | 6 | 1746 | Hazard Ratio (95% CI) | 1.18 [1.05, 1.33] |
| 5.3 Linac only | 4 | 395 | Hazard Ratio (95% CI) | 1.02 [0.80, 1.31] |
| 6 RT dose Show forest plot | 11 | 2343 | Peto Odds Ratio (95% CI) | 1.18 [1.07, 1.31] |
| 6.1 < 45 Gy | 2 | 382 | Peto Odds Ratio (95% CI) | 0.93 [0.75, 1.17] |
| 6.2 ≥ 45 Gy | 9 | 1961 | Peto Odds Ratio (95% CI) | 1.25 [1.12, 1.40] |