Cleavage stage versus blastocyst stage embryo transfer in assisted reproductive technology
Referencias
References to studies included in this review
References to studies excluded from this review
Additional references
Characteristics of studies
Characteristics of included studies [ordered by study ID]
Ir a:
| Methods | Randomisation: computer generated random list Blinded: no Size: 52 D2 55 D5‐6 Single centre: Clermont Ferrand Université d'Auvergne, Biologie de la reproduction CECOS EA 975, Clermont Ferrand, France | |
| Participants | Criteria: If more than 5 oocytes were retrieved and 3 top quality embryos (3 4 blastomeres, < 20% fragmentation without multinuclear blastomeres) were observed at day 2, the couples were included in the study. Cause/duration: NA. Previous Treatment:NA. Fert rate: NA. Blast rate: NA | |
| Interventions | Ov Stim: NS Luteal support: NS Media: Sequential commercial brand Culture method: NS AHA: N SET | |
| Outcomes | Cumulative pregnancy rate (D2 versus D5/6) 51.9 versus 49.1%. Clinical pregnancy rate per ET (D2 versus D5/6): 46.2% versus 41.8% | |
| Notes | ||
| Risk of bias | ||
| Bias | Authors' judgement | Support for judgement |
| Random sequence generation (selection bias) | Low risk | Computer generated random list |
| Allocation concealment (selection bias) | Unclear risk | Not stated |
| Blinding (performance bias and detection bias) | High risk | Not blinded |
| Incomplete outcome data (attrition bias) | Unclear risk | Not stated |
| Selective reporting (reporting bias) | Low risk | |
| Other bias | Unclear risk | Not stated |
| Methods | Randomisation: sealed envelope on day3 | |
| Participants | Criteria: D3 3 or more 8‐cell embryos <20% fragmentation, <40, BMI<30, FSH<12 | |
| Interventions | Ov Stim: GnRHa long + rFSH + HCG 35hr | |
| Outcomes | Primary | |
| Notes | Prognosis: good | |
| Risk of bias | ||
| Bias | Authors' judgement | Support for judgement |
| Random sequence generation (selection bias) | Low risk | Sealed envelope |
| Allocation concealment (selection bias) | Unclear risk | Not stated |
| Blinding (performance bias and detection bias) | High risk | Not blinded |
| Incomplete outcome data (attrition bias) | Low risk | No dropouts or exclusions |
| Selective reporting (reporting bias) | Low risk | |
| Other bias | Low risk | |
| Methods | Randomisation: enrolled consecutively sealed envelope until day of fert check | |
| Participants | Criteria: 4 or more zygotes | |
| Interventions | Ov Stim: GnRH down regulation hMG + 36hr trigger | |
| Outcomes | Primary | |
| Notes | Prognosis: good | |
| Risk of bias | ||
| Bias | Authors' judgement | Support for judgement |
| Random sequence generation (selection bias) | Unclear risk | Not stated |
| Allocation concealment (selection bias) | Low risk | Sealed envelopes |
| Blinding (performance bias and detection bias) | High risk | Not blinded |
| Incomplete outcome data (attrition bias) | Low risk | No dropouts or exclusions |
| Selective reporting (reporting bias) | Low risk | |
| Other bias | High risk | Reported no provision for Day 5 freezing |
| Methods | Randomisation: | |
| Participants | Criteria: <40y, >4 previous cycles | |
| Interventions | Ov Stim: NS | |
| Outcomes | Primary | |
| Notes | Prognosis: poor | |
| Risk of bias | ||
| Bias | Authors' judgement | Support for judgement |
| Random sequence generation (selection bias) | Unclear risk | Not stated |
| Allocation concealment (selection bias) | Unclear risk | Not stated |
| Blinding (performance bias and detection bias) | Unclear risk | Not stated |
| Incomplete outcome data (attrition bias) | Low risk | No dropouts or exclusions |
| Selective reporting (reporting bias) | Unclear risk | Not stated |
| Other bias | Unclear risk | Not stated |
| Methods | Randomisation: computer generated block randomisation Allocation: identical, sequentially numbered, dark‐sealed envelopes | |
| Participants | Criteria: <35y, with regular cycles, serum day‐3 FSH concentration <9.5 IU/l and antral follicle count >6. At least at least four good‐quality embryos on day 3. | |
| Interventions | Ov Stim: long luteal‐phase GnRH agonist down regulation protocol and both recombinant FSH and human menopausal gonadotrophin | |
| Outcomes | LB: D3 35% (35/100) | |
| Notes | ||
| Risk of bias | ||
| Bias | Authors' judgement | Support for judgement |
| Random sequence generation (selection bias) | Low risk | Prospective randomised controlled trial |
| Allocation concealment (selection bias) | Low risk | |
| Blinding (performance bias and detection bias) | Unclear risk | Open label |
| Incomplete outcome data (attrition bias) | Low risk | |
| Selective reporting (reporting bias) | Low risk | |
| Other bias | Low risk | |
| Methods | Randomisation: list with permuted blocks for each new cycle | |
| Participants | Criteria: <39y, 3 or less previous cycles, 4 or more 2PN on day1 | |
| Interventions | Ov Stim: GnRHa, hMG, HCG 36h | |
| Outcomes | Primary | |
| Notes | Prognosis: mixed unselected | |
| Risk of bias | ||
| Bias | Authors' judgement | Support for judgement |
| Random sequence generation (selection bias) | Low risk | Randomisation list with permuted blocks for each new cycle |
| Allocation concealment (selection bias) | Unclear risk | Not stated |
| Blinding (performance bias and detection bias) | High risk | Not blinded |
| Incomplete outcome data (attrition bias) | High risk | 10 women were subsequently excluded for protocol violations |
| Selective reporting (reporting bias) | Low risk | |
| Other bias | Low risk | |
| Methods | Randomisation: N/A Blinded: N/A Size: 20 D3 8 D5 12 No dropouts Single centre: Private practice. USA Power calc: these are preliminary results and no ulterior study has been published (4 years later) | |
| Participants | Criteria: D3 3 or more 8‐cell embryos <20% fragmentation, <40, BMI<30, FSH<12 Age: D3 31.3 D5 31.2 Cause/duration: NS Previous Treatment:first or second cycle:D3 84% D5 88% ICSI: D3 51% D5 64%(lower blast rate in ICSI than IVF) FSH: D3 6.5 D5 6.5 #eggs: D3 12.8+/‐4.4D5 13.5+/‐5.3 Fert rate: D3 60.2%D5 60.7% Blast rate: 55.2% ET policy: 2 embryos both groups #ET: D3 2.0 D5 1.96(2 patients D5 had 1 only due to lack of blasts) Pregnancy determination: HCG + US 7 weeks. Inclusion criteria: "Women <41, with <=2 prior fresh cycles with at least one embryo on day 3 GES R70 and sHLA‐G OD: 0.148–0.210" | |
| Interventions | n/a | |
| Outcomes | Pregnancy rate: 92% versus 50% | |
| Notes | ||
| Risk of bias | ||
| Bias | Authors' judgement | Support for judgement |
| Random sequence generation (selection bias) | Unclear risk | Not stated |
| Allocation concealment (selection bias) | Unclear risk | Not stated |
| Blinding (performance bias and detection bias) | Unclear risk | Not stated |
| Incomplete outcome data (attrition bias) | Low risk | No dropouts |
| Selective reporting (reporting bias) | High risk | Preliminary data |
| Other bias | Unclear risk | Not stated |
| Methods | Randomisation: computer generated randomisation table. Allocation concealed until intervention assigned. Randomisation day of OPU. | |
| Participants | Criteria: <39y, 3 or less previous cycles, 4 or more 2PN on day 1 | |
| Interventions | Ov Stim: NS | |
| Outcomes | Primary | |
| Notes | Prognosis: good | |
| Risk of bias | ||
| Bias | Authors' judgement | Support for judgement |
| Random sequence generation (selection bias) | Low risk | Computer generated randomisation table |
| Allocation concealment (selection bias) | Unclear risk | Allocation was concealed but method not given |
| Blinding (performance bias and detection bias) | High risk | Not blinded |
| Incomplete outcome data (attrition bias) | Low risk | Intention‐to‐treat analysis was applied |
| Selective reporting (reporting bias) | Low risk | |
| Other bias | Low risk | |
| Methods | Randomisation: computer generated on day 8 prior to OPU | |
| Participants | Criteria: all ages and >10 follicles on day of trigger | |
| Interventions | Ov Stim: NS | |
| Outcomes | Primary | |
| Notes | Prognosis: good <1 previous cycle and >10 follicles | |
| Risk of bias | ||
| Bias | Authors' judgement | Support for judgement |
| Random sequence generation (selection bias) | Low risk | Computer generated random list |
| Allocation concealment (selection bias) | Unclear risk | Not stated |
| Blinding (performance bias and detection bias) | Unclear risk | Not stated |
| Incomplete outcome data (attrition bias) | Unclear risk | Need more information |
| Selective reporting (reporting bias) | Low risk | |
| Other bias | High risk | No age limit |
| Methods | Randomisation: NS Allocation: sealed envelope on day prior to HCG | |
| Participants | Criteria: 6 follicles day prior to hCG | |
| Interventions | Ov Stim: long‐course GnRHa or short centrorelix | |
| Outcomes | Primary | |
| Notes | Prognosis: good excluded poor responders. | |
| Risk of bias | ||
| Bias | Authors' judgement | Support for judgement |
| Random sequence generation (selection bias) | Unclear risk | Not stated |
| Allocation concealment (selection bias) | Low risk | Sealed envelope |
| Blinding (performance bias and detection bias) | High risk | Not blinded |
| Incomplete outcome data (attrition bias) | Low risk | No dropouts or exclusions |
| Selective reporting (reporting bias) | Low risk | |
| Other bias | Low risk | |
| Methods | Randomisation: sealed envelope on D1 fert check | |
| Participants | Criteria: 5 or more zygotes | |
| Interventions | Ov Stim: GnRH long and short + rFSH and HP FSH + 35hr trigger | |
| Outcomes | Primary | |
| Notes | Prognosis: moderate, young women, moderately high oocyte numbers. Large difference in embryo ET# between groups | |
| Risk of bias | ||
| Bias | Authors' judgement | Support for judgement |
| Random sequence generation (selection bias) | Unclear risk | Not stated |
| Allocation concealment (selection bias) | Low risk | Sealed envelopes |
| Blinding (performance bias and detection bias) | High risk | Not blinded |
| Incomplete outcome data (attrition bias) | Low risk | No dropouts or exclusions |
| Selective reporting (reporting bias) | Low risk | |
| Other bias | Low risk | |
| Methods | Randomisation: computer generated list. Sequence not concealed. Prior to stimulation | |
| Participants | Criteria: <43y, no PGD or azoospermia | |
| Interventions | Ov Stim: initially GnRHa long protocol with HMG, replaced by GnRH antagonist with rFSH | |
| Outcomes | Primary | |
| Notes | Prognosis: mixed unselected | |
| Risk of bias | ||
| Bias | Authors' judgement | Support for judgement |
| Random sequence generation (selection bias) | Low risk | Computer generated list |
| Allocation concealment (selection bias) | High risk | The sequence of randomisation was not concealed |
| Blinding (performance bias and detection bias) | High risk | Not stated |
| Incomplete outcome data (attrition bias) | Low risk | No dropouts or exclusions |
| Selective reporting (reporting bias) | Low risk | |
| Other bias | Low risk | |
| Methods | Randomisation: computer generated random number table, blinded sealed envelopes prior to treatment. | |
| Participants | Criteria: min 3 failed IVF cycles, <37, adequate ovarian response | |
| Interventions | Ov Stim: GnRHa long and short +hMG doses adjusted daily, + hCG 36‐38hr | |
| Outcomes | Primary | |
| Notes | Prognosis: both good and poor | |
| Risk of bias | ||
| Bias | Authors' judgement | Support for judgement |
| Random sequence generation (selection bias) | Low risk | Computer generated randomisation list |
| Allocation concealment (selection bias) | Low risk | Sealed envelopes |
| Blinding (performance bias and detection bias) | Unclear risk | Not clear which of participants or outcome assessors were blinded |
| Incomplete outcome data (attrition bias) | Low risk | No dropouts or exclusions |
| Selective reporting (reporting bias) | Low risk | |
| Other bias | Low risk | |
| Methods | Randomisation: sealed envelope performed on day1 post OPU | |
| Participants | Criteria: <38y, <5 prev IVF, | |
| Interventions | Ov Stim: NS | |
| Outcomes | Primary | |
| Notes | Prognosis: moderate | |
| Risk of bias | ||
| Bias | Authors' judgement | Support for judgement |
| Random sequence generation (selection bias) | Unclear risk | Method of randomisation unknown |
| Allocation concealment (selection bias) | Low risk | Sealed envelope |
| Blinding (performance bias and detection bias) | Unclear risk | Blinded, unclear who was blinded |
| Incomplete outcome data (attrition bias) | High risk | 20 women were excluded post randomisation as they did not have a transfer, not clear from which group they came |
| Selective reporting (reporting bias) | Low risk | |
| Other bias | Low risk | |
| Methods | Randomisation: sealed envelope | |
| Participants | Size: 79 recruited | |
| Interventions | Ov Stim: GnRH long+ rFSH + hCG 36 hr trigger | |
| Outcomes | Primary | |
| Notes | Prognosis: high | |
| Risk of bias | ||
| Bias | Authors' judgement | Support for judgement |
| Random sequence generation (selection bias) | Low risk | Computer generated |
| Allocation concealment (selection bias) | Low risk | Sealed envelope |
| Blinding (performance bias and detection bias) | Unclear risk | Not possible to blind |
| Incomplete outcome data (attrition bias) | Unclear risk | 20 recruited but not randomised |
| Selective reporting (reporting bias) | Low risk | Live birth and multiple pregnancy rate reported |
| Other bias | Unclear risk | Single blastocyst transfer (Day 5) but double embryo transfer (Day 3) |
| Methods | Randomisation:"randomly assigned" | |
| Participants | Criteria: unselected | |
| Interventions | Ov Stim: down reg with gonadotropin 150‐450 | |
| Outcomes | Primary | |
| Notes | Prognosis: moderate to good. No letter sent | |
| Risk of bias | ||
| Bias | Authors' judgement | Support for judgement |
| Random sequence generation (selection bias) | Unclear risk | Not stated |
| Allocation concealment (selection bias) | Unclear risk | Not stated |
| Blinding (performance bias and detection bias) | Unclear risk | Not stated |
| Incomplete outcome data (attrition bias) | Unclear risk | Not stated |
| Selective reporting (reporting bias) | Unclear risk | Not stated |
| Other bias | Unclear risk | Not stated |
| Methods | Randomisation: not stated Allocation: not stated Blinded: no Size: 243, D2 81, D3 81, D5 81 No dropouts Single centre: Greece | |
| Participants | <41 years olf. less than 4 previous unsuccessful ART attempts | |
| Interventions | Ov Stim: long or short protocol, using GnRH agonist and recombinant FSH; Luteal support: NS Media: sequential media commercial AHA: N | |
| Outcomes | Total: Pregnancy rate: D2 46.9%, D3: 48.1%, D5 37% | |
| Notes | ||
| Risk of bias | ||
| Bias | Authors' judgement | Support for judgement |
| Random sequence generation (selection bias) | Unclear risk | Not stated |
| Allocation concealment (selection bias) | Unclear risk | Not stated |
| Blinding (performance bias and detection bias) | High risk | Not blinded |
| Incomplete outcome data (attrition bias) | Low risk | |
| Selective reporting (reporting bias) | Low risk | |
| Other bias | Low risk | |
| Methods | Randomisation: computer generated list | |
| Participants | Criteria: 4 good quality embryos on D3, <38y, | |
| Interventions | Ov Stim: 2 types | |
| Outcomes | Primary | |
| Notes | Prognosis: high, 4 high qual embryos D3, young women | |
| Risk of bias | ||
| Bias | Authors' judgement | Support for judgement |
| Random sequence generation (selection bias) | Unclear risk | Computer generated list |
| Allocation concealment (selection bias) | High risk | No concealment |
| Blinding (performance bias and detection bias) | High risk | Not blinded |
| Incomplete outcome data (attrition bias) | Low risk | No dropouts |
| Selective reporting (reporting bias) | Low risk | |
| Other bias | Low risk | |
| Methods | Randomisation: computer generated list | |
| Participants | Criteria: single embryo transfer, <36y, <3 cycles FSH ≤12 on D3 | |
| Interventions | Ov Stim: GnRH antagonist | |
| Outcomes | Primary | |
| Notes | Prognosis: high, young women | |
| Risk of bias | ||
| Bias | Authors' judgement | Support for judgement |
| Random sequence generation (selection bias) | Low risk | Computer generation list |
| Allocation concealment (selection bias) | High risk | Not concealed |
| Blinding (performance bias and detection bias) | High risk | Not blinded |
| Incomplete outcome data (attrition bias) | Low risk | Intention‐to‐treat analysis was applied |
| Selective reporting (reporting bias) | Low risk | |
| Other bias | Low risk | |
| Methods | Randomisation: computer generated randomised list. Randomised on day 1 following OPU | |
| Participants | Criteria: <38y, ICSI only, 8 or more zygotes | |
| Interventions | Ov Stim: down reg with rFSH + hCG trigger 36h | |
| Outcomes | Primary | |
| Notes | Prognosis: Good | |
| Risk of bias | ||
| Bias | Authors' judgement | Support for judgement |
| Random sequence generation (selection bias) | Low risk | Computer generated list |
| Allocation concealment (selection bias) | Unclear risk | Method of allocation not stated |
| Blinding (performance bias and detection bias) | High risk | Not blinded |
| Incomplete outcome data (attrition bias) | Low risk | No dropouts |
| Selective reporting (reporting bias) | Low risk | |
| Other bias | Low risk | |
| Methods | Randomisation: method NS "randomly allocated" on day1 fert check | |
| Participants | Criteria: 8 or more MII oocytes and 3 zygotes | |
| Interventions | Ov Stim: NS | |
| Outcomes | Primary | |
| Notes | Prognosis: ? unclear ? moderate #eggs | |
| Risk of bias | ||
| Bias | Authors' judgement | Support for judgement |
| Random sequence generation (selection bias) | Unclear risk | Not stated |
| Allocation concealment (selection bias) | Unclear risk | Not stated |
| Blinding (performance bias and detection bias) | Unclear risk | Not stated |
| Incomplete outcome data (attrition bias) | Unclear risk | No dropouts or exclusions |
| Selective reporting (reporting bias) | Unclear risk | Not stated |
| Other bias | Unclear risk | Not stated |
| Methods | Randomisation: method NS "distributed randomly" on day 3 fert check | |
| Participants | Criteria: at least one embryo type A and 2 type B | |
| Interventions | day 3 versus day 5 | |
| Outcomes | clinical pregnancy rate but cumulative pregnancy rate later number of frozen embryos | |
| Notes | abstract only | |
| Risk of bias | ||
| Bias | Authors' judgement | Support for judgement |
| Random sequence generation (selection bias) | Unclear risk | Distributed randomly |
| Allocation concealment (selection bias) | Unclear risk | Distributed randomly |
| Blinding (performance bias and detection bias) | Unclear risk | Not stated |
| Incomplete outcome data (attrition bias) | Unclear risk | Not stated |
| Selective reporting (reporting bias) | Low risk | |
| Other bias | Unclear risk | It is an abstract |
| Methods | Randomisation: blind randomisation with sealed envelope at start of hormone stimulation | |
| Participants | Criteria: unselected | |
| Interventions | Ov Stim: NS | |
| Outcomes | Primary | |
| Notes | Prognosis: mixed ‐ unselected | |
| Risk of bias | ||
| Bias | Authors' judgement | Support for judgement |
| Random sequence generation (selection bias) | Low risk | Not stated |
| Allocation concealment (selection bias) | Low risk | Sealed envelopes |
| Blinding (performance bias and detection bias) | High risk | Not blinded |
| Incomplete outcome data (attrition bias) | Low risk | |
| Selective reporting (reporting bias) | Low risk | |
| Other bias | Low risk | |
ET ‐ embryo transfer
Blast ‐ blastocyst
Fert ‐ fertilization
OPU ‐ oocyte pick up
AH ‐ assisted hatching
# ‐ number
NS ‐ not stated
US ‐ ultrasound
Fz ‐ freeze
D3 ‐ embryo transfer on day 3 post OPU (i.e early cleavage stage)
D5 ‐ embryo transfer on day 5 post OPU (i.e. blastocyst stage)
Imp ‐ implantation
Clin preg ‐ clinical pregnancy
IM ‐ intramuscular injection
Ov Stim ‐ ovarian stimulation regimen
FCS ‐ fetal chord serum
G1/G2 sequential media from Vitrolife
emb ‐ embryo
trans ‐ transfer
years ‐ years
Unex ‐ unexplained
morula‐ embryonic stage prior to blastocysts (usually embryos with delayed development on day5)
rFSH ‐ recombinant follicle stimulating hormone (fertility ovarian stimulation drug)
IU ‐ international unit of drug administration
hCG ‐ human chorionic gonadotropin (trigger injection that initiates ovulation and maturation of oocytes)
Blastocyte rate ‐ number of blastocysts developed divided by number of 2PN embryos available
Characteristics of excluded studies [ordered by study ID]
Ir a:
| Study | Reason for exclusion |
| Used co‐culture | |
| Used co‐culture | |
| Duplicate of Levitas 2004 | |
| Quasi Randomised | |
| Included transfer of embryos on two separate days within the same cycle | |
| Used co‐culture | |
| Duplicate data | |
| Duplicate data | |
| non‐randomised study (sequentially numbered) | |
| non‐randomised study ‐ according to even or odd year of birth | |
| non‐randomised study ‐ according to even or odd year of birth |
Data and analyses
| Outcome or subgroup title | No. of studies | No. of participants | Statistical method | Effect size |
| 1 Live birth per couple Show forest plot | 12 | 1510 | Peto Odds Ratio (Peto, Fixed, 95% CI) | 1.40 [1.13, 1.74] |
| Analysis 1.1  Comparison 1 Live birth rate, Outcome 1 Live birth per couple. | ||||
| 2 Live birth per couple: grouped by number of embryos transferred Show forest plot | 12 | Peto Odds Ratio (Peto, Fixed, 95% CI) | Subtotals only | |
| Analysis 1.2  Comparison 1 Live birth rate, Outcome 2 Live birth per couple: grouped by number of embryos transferred. | ||||
| 2.1 more cleavage stage than blastocyst embyros transferred | 6 | 483 | Peto Odds Ratio (Peto, Fixed, 95% CI) | 1.52 [1.03, 2.23] |
| 2.2 single embryo transfer | 2 | 458 | Peto Odds Ratio (Peto, Fixed, 95% CI) | 1.46 [0.98, 2.19] |
| 2.3 equal number of embryos transferred | 6 | 1027 | Peto Odds Ratio (Peto, Fixed, 95% CI) | 1.35 [1.04, 1.75] |
| 3 Live birth rate per couple: grouped by prognosis Show forest plot | 12 | 1510 | Odds Ratio (M‐H, Random, 95% CI) | 1.37 [1.01, 1.85] |
| Analysis 1.3  Comparison 1 Live birth rate, Outcome 3 Live birth rate per couple: grouped by prognosis. | ||||
| 3.1 good prognostic factors | 8 | 1126 | Odds Ratio (M‐H, Random, 95% CI) | 1.43 [0.99, 2.07] |
| 3.2 poor prognostic factors | 2 | 77 | Odds Ratio (M‐H, Random, 95% CI) | 1.99 [0.49, 8.04] |
| 3.3 unselected group | 2 | 307 | Odds Ratio (M‐H, Random, 95% CI) | 1.05 [0.56, 1.97] |
| 4 Live birth rate: grouped by day of randomisation Show forest plot | 12 | 1510 | Odds Ratio (M‐H, Random, 95% CI) | 1.37 [1.01, 1.85] |
| Analysis 1.4  Comparison 1 Live birth rate, Outcome 4 Live birth rate: grouped by day of randomisation. | ||||
| 4.1 randomisation at start of cycle | 5 | 819 | Odds Ratio (M‐H, Random, 95% CI) | 1.25 [0.90, 1.73] |
| 4.2 randomised on day of OPU and day 1 after OPU | 3 | 245 | Odds Ratio (M‐H, Random, 95% CI) | 0.97 [0.37, 2.58] |
| 4.3 randomised Day 2 to 3 post OPU | 2 | 364 | Odds Ratio (M‐H, Random, 95% CI) | 2.17 [1.42, 3.33] |
| 4.4 day of randomisation unstated | 2 | 82 | Odds Ratio (M‐H, Random, 95% CI) | 1.68 [0.65, 4.38] |
| Outcome or subgroup title | No. of studies | No. of participants | Statistical method | Effect size |
| 1 clinical pregnancy rate per couple Show forest plot | 23 | 3241 | Peto Odds Ratio (Peto, Fixed, 95% CI) | 1.14 [0.99, 1.32] |
| Analysis 2.1  Comparison 2 Clinical pregnancy rate, Outcome 1 clinical pregnancy rate per couple. | ||||
| 2 clinical pregnancy rate per couple: grouped by number of embryos transferred Show forest plot | 23 | Odds Ratio (M‐H, Fixed, 95% CI) | Subtotals only | |
| Analysis 2.2  Comparison 2 Clinical pregnancy rate, Outcome 2 clinical pregnancy rate per couple: grouped by number of embryos transferred. | ||||
| 2.1 equal numbers of ET | 11 | 1854 | Odds Ratio (M‐H, Fixed, 95% CI) | 1.19 [0.99, 1.44] |
| 2.2 more cleavage stage than blastocyst embryos transfered | 12 | 1387 | Odds Ratio (M‐H, Fixed, 95% CI) | 1.07 [0.86, 1.33] |
| 2.3 Single embryo transfer | 3 | 478 | Odds Ratio (M‐H, Fixed, 95% CI) | 1.24 [0.84, 1.82] |
| 3 clinical pregnancy rate per couple: grouped by prognosis Show forest plot | 23 | 3241 | Odds Ratio (M‐H, Random, 95% CI) | 1.13 [0.92, 1.40] |
| Analysis 2.3  Comparison 2 Clinical pregnancy rate, Outcome 3 clinical pregnancy rate per couple: grouped by prognosis. | ||||
| 3.1 Good prognostic factors | 14 | 1756 | Odds Ratio (M‐H, Random, 95% CI) | 1.15 [0.83, 1.58] |
| 3.2 Poor prognostic factors | 2 | 77 | Odds Ratio (M‐H, Random, 95% CI) | 2.59 [0.75, 8.92] |
| 3.3 Unselected group | 7 | 1408 | Odds Ratio (M‐H, Random, 95% CI) | 1.01 [0.81, 1.25] |
| 4 clinical pregnancy rate per couple: grouped by day of randomisation Show forest plot | 23 | 3241 | Odds Ratio (M‐H, Fixed, 95% CI) | 1.14 [0.99, 1.32] |
| Analysis 2.4  Comparison 2 Clinical pregnancy rate, Outcome 4 clinical pregnancy rate per couple: grouped by day of randomisation. | ||||
| 4.1 Randomised start of cycle | 7 | 1371 | Odds Ratio (M‐H, Fixed, 95% CI) | 1.19 [0.95, 1.49] |
| 4.2 Randomised on day of OPU or day 1 | 8 | 892 | Odds Ratio (M‐H, Fixed, 95% CI) | 1.00 [0.76, 1.31] |
| 4.3 Randomised on day 2 to 3 | 4 | 537 | Odds Ratio (M‐H, Fixed, 95% CI) | 1.59 [1.13, 2.23] |
| 4.4 Day of randomisation unstated | 4 | 441 | Odds Ratio (M‐H, Fixed, 95% CI) | 0.84 [0.57, 1.25] |
| Outcome or subgroup title | No. of studies | No. of participants | Statistical method | Effect size |
| 1 cumulative pregnancy rate from fresh and frozen transfers Show forest plot | 4 | 527 | Peto Odds Ratio (Peto, Fixed, 95% CI) | 1.58 [1.11, 2.25] |
| Analysis 3.1  Comparison 3 Cumulative pregnancy rate, Outcome 1 cumulative pregnancy rate from fresh and frozen transfers. | ||||
| Outcome or subgroup title | No. of studies | No. of participants | Statistical method | Effect size |
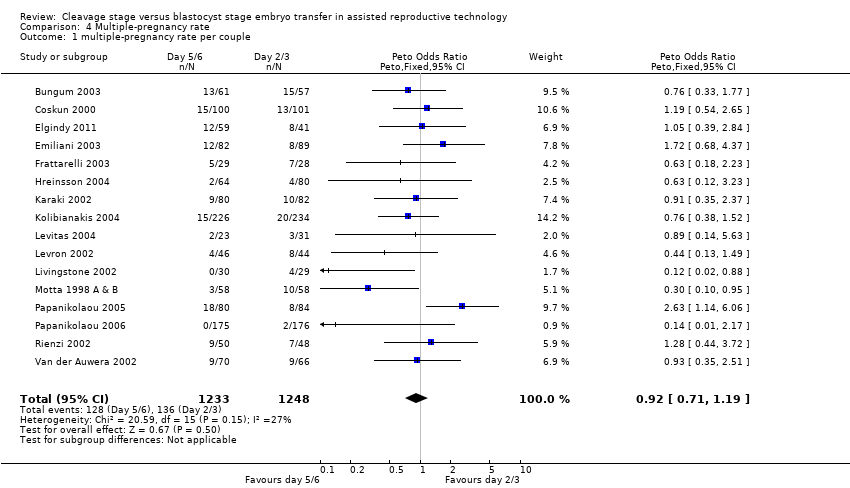
| 1 multiple‐pregnancy rate per couple Show forest plot | 16 | 2481 | Peto Odds Ratio (Peto, Fixed, 95% CI) | 0.92 [0.71, 1.19] |
| Analysis 4.1  Comparison 4 Multiple‐pregnancy rate, Outcome 1 multiple‐pregnancy rate per couple. | ||||
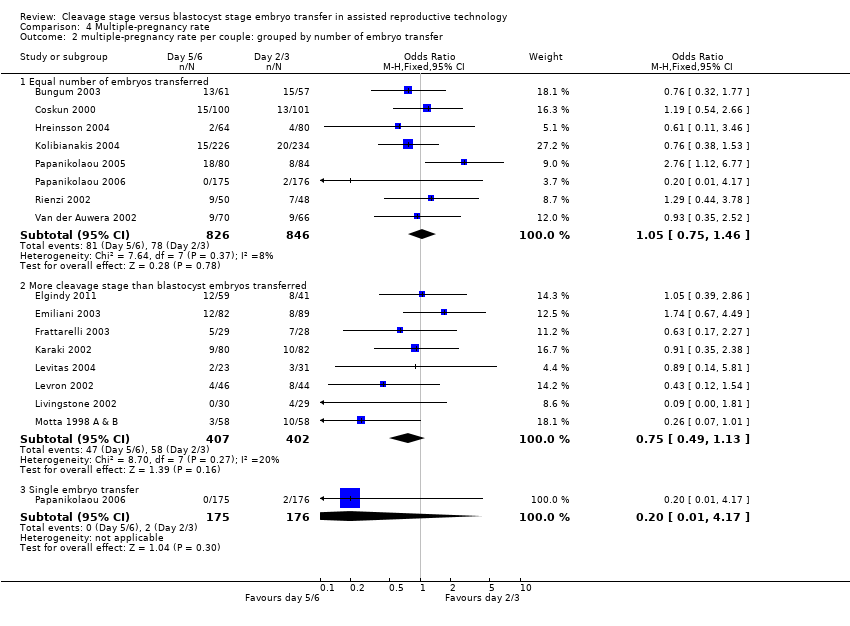
| 2 multiple‐pregnancy rate per couple: grouped by number of embryo transfer Show forest plot | 16 | Odds Ratio (M‐H, Fixed, 95% CI) | Subtotals only | |
| Analysis 4.2  Comparison 4 Multiple‐pregnancy rate, Outcome 2 multiple‐pregnancy rate per couple: grouped by number of embryo transfer. | ||||
| 2.1 Equal number of embryos transferred | 8 | 1672 | Odds Ratio (M‐H, Fixed, 95% CI) | 1.05 [0.75, 1.46] |
| 2.2 More cleavage stage than blastocyst embryos transferred | 8 | 809 | Odds Ratio (M‐H, Fixed, 95% CI) | 0.75 [0.49, 1.13] |
| 2.3 Single embryo transfer | 1 | 351 | Odds Ratio (M‐H, Fixed, 95% CI) | 0.20 [0.01, 4.17] |
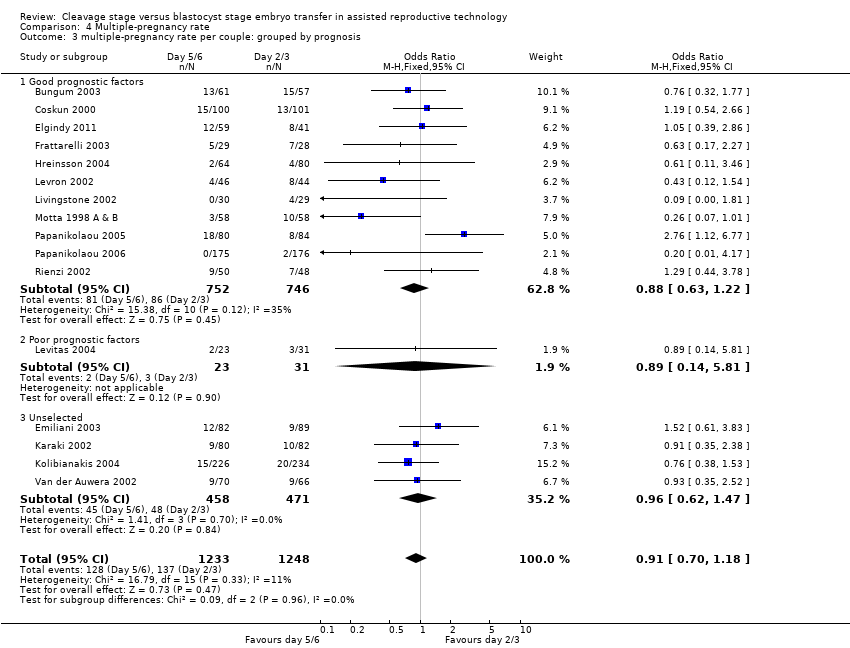
| 3 multiple‐pregnancy rate per couple: grouped by prognosis Show forest plot | 16 | 2481 | Odds Ratio (M‐H, Fixed, 95% CI) | 0.91 [0.70, 1.18] |
| Analysis 4.3  Comparison 4 Multiple‐pregnancy rate, Outcome 3 multiple‐pregnancy rate per couple: grouped by prognosis. | ||||
| 3.1 Good prognostic factors | 11 | 1498 | Odds Ratio (M‐H, Fixed, 95% CI) | 0.88 [0.63, 1.22] |
| 3.2 Poor prognostic factors | 1 | 54 | Odds Ratio (M‐H, Fixed, 95% CI) | 0.89 [0.14, 5.81] |
| 3.3 Unselected | 4 | 929 | Odds Ratio (M‐H, Fixed, 95% CI) | 0.96 [0.62, 1.47] |
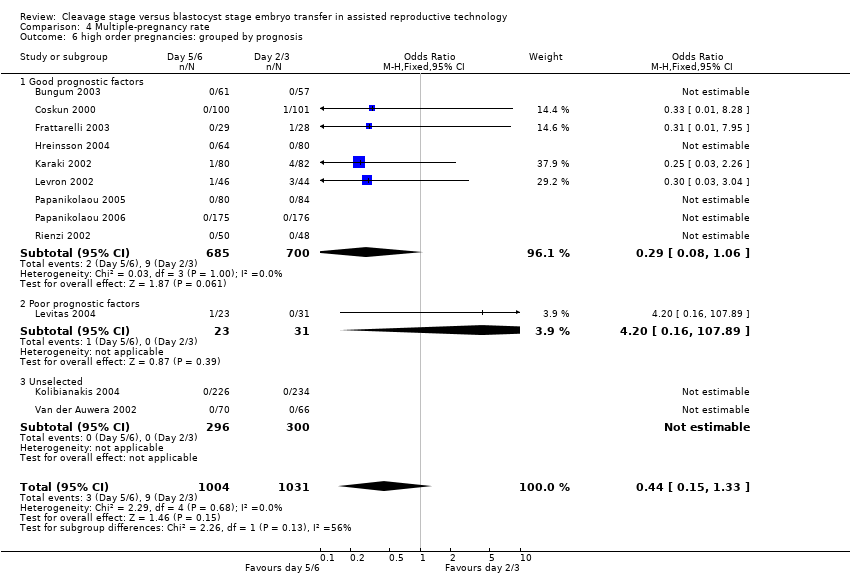
| 4 high order pregnancies (more than 2 gestational sacs) per couple Show forest plot | 12 | 2035 | Odds Ratio (M‐H, Fixed, 95% CI) | 0.44 [0.15, 1.33] |
| Analysis 4.4  Comparison 4 Multiple‐pregnancy rate, Outcome 4 high order pregnancies (more than 2 gestational sacs) per couple. | ||||
| 5 high order pregnancy: grouped by number of embryos transferred Show forest plot | 12 | 2035 | Odds Ratio (M‐H, Fixed, 95% CI) | 0.44 [0.15, 1.33] |
| Analysis 4.5  Comparison 4 Multiple‐pregnancy rate, Outcome 5 high order pregnancy: grouped by number of embryos transferred. | ||||
| 5.1 Equal number of embryos transferred | 8 | 1672 | Odds Ratio (M‐H, Fixed, 95% CI) | 0.33 [0.01, 8.28] |
| 5.2 More cleavage stage than blastocyst embryos transferred | 4 | 363 | Odds Ratio (M‐H, Fixed, 95% CI) | 0.46 [0.14, 1.49] |
| 6 high order pregnancies: grouped by prognosis Show forest plot | 12 | 2035 | Odds Ratio (M‐H, Fixed, 95% CI) | 0.44 [0.15, 1.33] |
| Analysis 4.6  Comparison 4 Multiple‐pregnancy rate, Outcome 6 high order pregnancies: grouped by prognosis. | ||||
| 6.1 Good prognostic factors | 9 | 1385 | Odds Ratio (M‐H, Fixed, 95% CI) | 0.29 [0.08, 1.06] |
| 6.2 Poor prognostic factors | 1 | 54 | Odds Ratio (M‐H, Fixed, 95% CI) | 4.2 [0.16, 107.89] |
| 6.3 Unselected | 2 | 596 | Odds Ratio (M‐H, Fixed, 95% CI) | 0.0 [0.0, 0.0] |
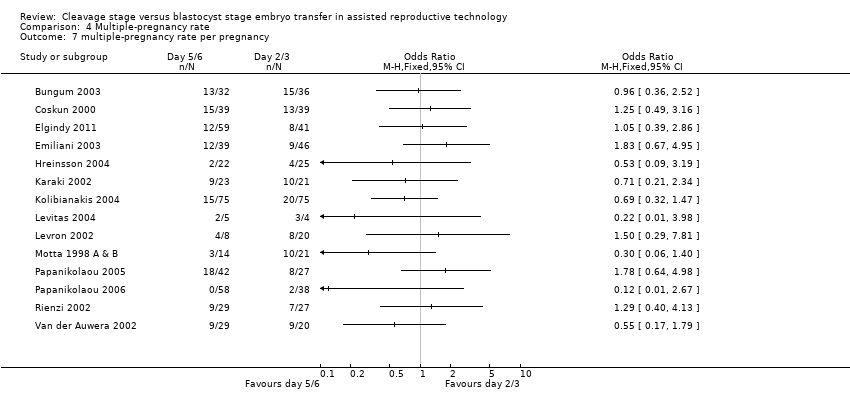
| 7 multiple‐pregnancy rate per pregnancy Show forest plot | 14 | Odds Ratio (M‐H, Fixed, 95% CI) | Totals not selected | |
| Analysis 4.7  Comparison 4 Multiple‐pregnancy rate, Outcome 7 multiple‐pregnancy rate per pregnancy. | ||||
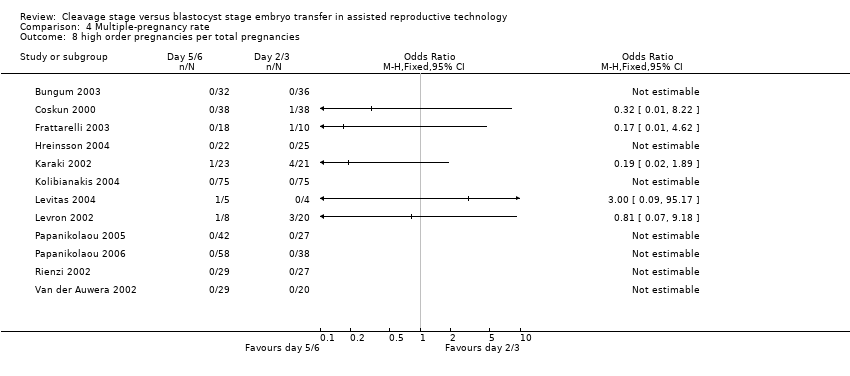
| 8 high order pregnancies per total pregnancies Show forest plot | 12 | Odds Ratio (M‐H, Fixed, 95% CI) | Totals not selected | |
| Analysis 4.8  Comparison 4 Multiple‐pregnancy rate, Outcome 8 high order pregnancies per total pregnancies. | ||||
| Outcome or subgroup title | No. of studies | No. of participants | Statistical method | Effect size |
| 1 miscarriage rate per couple Show forest plot | 14 | 2127 | Peto Odds Ratio (Peto, Fixed, 95% CI) | 1.14 [0.84, 1.55] |
| Analysis 5.1  Comparison 5 Miscarriage rate, Outcome 1 miscarriage rate per couple. | ||||
| 2 miscarriage rate per pregnancy Show forest plot | 14 | Odds Ratio (M‐H, Fixed, 95% CI) | Totals not selected | |
| Analysis 5.2  Comparison 5 Miscarriage rate, Outcome 2 miscarriage rate per pregnancy. | ||||
| Outcome or subgroup title | No. of studies | No. of participants | Statistical method | Effect size |
| 1 embryo freezing per couple Show forest plot | 11 | 1729 | Peto Odds Ratio (Peto, Fixed, 95% CI) | 2.88 [2.35, 3.51] |
| Analysis 6.1  Comparison 6 Embryo freezing rate, Outcome 1 embryo freezing per couple. | ||||
| 2 Embyro freezing per couple: grouped by number of embryos transferred Show forest plot | 11 | 1729 | Odds Ratio (M‐H, Random, 95% CI) | 4.06 [2.49, 6.60] |
| Analysis 6.2  Comparison 6 Embryo freezing rate, Outcome 2 Embyro freezing per couple: grouped by number of embryos transferred. | ||||
| 2.1 equal number of embryos transferred | 7 | 1118 | Odds Ratio (M‐H, Random, 95% CI) | 4.35 [2.11, 8.97] |
| 2.2 more cleavage stage than blastocyst embryos transferred | 4 | 611 | Odds Ratio (M‐H, Random, 95% CI) | 3.95 [2.09, 7.46] |
| 3 Embryo freezing per couple: grouped by prognostic factors Show forest plot | 10 | 1486 | Odds Ratio (M‐H, Random, 95% CI) | 4.17 [2.41, 7.21] |
| Analysis 6.3  Comparison 6 Embryo freezing rate, Outcome 3 Embryo freezing per couple: grouped by prognostic factors. | ||||
| 3.1 good prognostic factors | 6 | 612 | Odds Ratio (M‐H, Random, 95% CI) | 6.39 [3.12, 13.10] |
| 3.2 poor prognostic factors | 0 | 0 | Odds Ratio (M‐H, Random, 95% CI) | 0.0 [0.0, 0.0] |
| 3.3 unselected | 4 | 874 | Odds Ratio (M‐H, Random, 95% CI) | 2.60 [1.31, 5.16] |
| Outcome or subgroup title | No. of studies | No. of participants | Statistical method | Effect size |
| 1 Failure to transfer any embryos per couple Show forest plot | 16 | 2459 | Odds Ratio (M‐H, Fixed, 95% CI) | 0.35 [0.24, 0.51] |
| Analysis 7.1  Comparison 7 Failure to transfer embryos rate per couple, Outcome 1 Failure to transfer any embryos per couple. | ||||
| 2 Failure to transfer any embryos per couple: grouped by prognostic factors Show forest plot | 16 | 2459 | Odds Ratio (M‐H, Fixed, 95% CI) | 0.35 [0.24, 0.51] |
| Analysis 7.2  Comparison 7 Failure to transfer embryos rate per couple, Outcome 2 Failure to transfer any embryos per couple: grouped by prognostic factors. | ||||
| 2.1 good prognostic factors | 9 | 1315 | Odds Ratio (M‐H, Fixed, 95% CI) | 0.67 [0.35, 1.27] |
| 2.2 poor prognostic factors | 2 | 77 | Odds Ratio (M‐H, Fixed, 95% CI) | 0.20 [0.04, 1.08] |
| 2.3 unselected | 5 | 1067 | Odds Ratio (M‐H, Fixed, 95% CI) | 0.27 [0.17, 0.43] |
| 3 Failure to transfer any embryos per couple: grouped by number of embryos transferred Show forest plot | 16 | Odds Ratio (M‐H, Fixed, 95% CI) | Subtotals only | |
| Analysis 7.3  Comparison 7 Failure to transfer embryos rate per couple, Outcome 3 Failure to transfer any embryos per couple: grouped by number of embryos transferred. | ||||
| 3.1 equal number of embryos transferred | 7 | 1321 | Odds Ratio (M‐H, Fixed, 95% CI) | 0.37 [0.23, 0.61] |
| 3.2 more cleavage stage than blastocyst embryos tranferred | 8 | 787 | Odds Ratio (M‐H, Fixed, 95% CI) | 0.23 [0.11, 0.46] |
| 3.3 single embryo transfer | 1 | 351 | Odds Ratio (M‐H, Fixed, 95% CI) | 0.71 [0.28, 1.81] |

Risk of bias graph: review authors' judgements about each risk of bias item presented as percentages across all included studies.

Risk of bias summary: review authors' judgements about each risk of bias item for each included study.
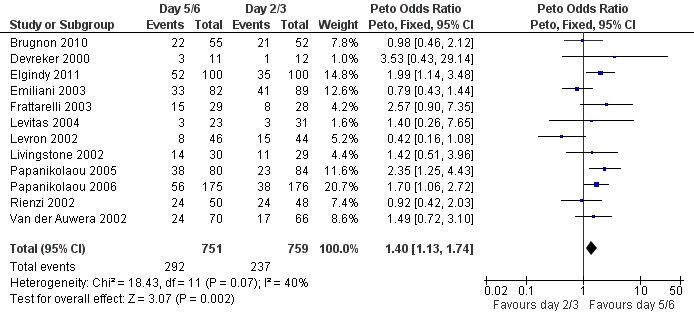
Forest plot of comparison: 1 Live birth rate, outcome: 1.1 Live birth per couple.

Forest plot of comparison: 2 Clinical pregnancy rate, outcome: 2.1 clinical pregnancy rate per couple.

Forest plot of comparison: 3 Cumulative pregnancy rate, outcome: 3.1 cumulative pregnancy rate from fresh and frozen transfers.
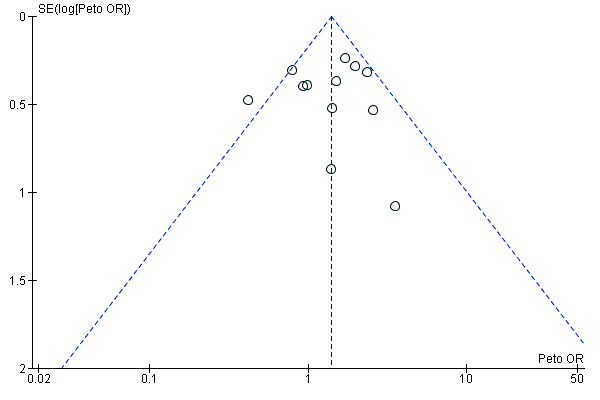
Funnel plot of comparison: 1 Live birth rate, outcome: 1.1 Live birth per couple.

Funnel plot of comparison: 2 Clinical pregnancy rate, outcome: 2.1 clinical pregnancy rate per couple.
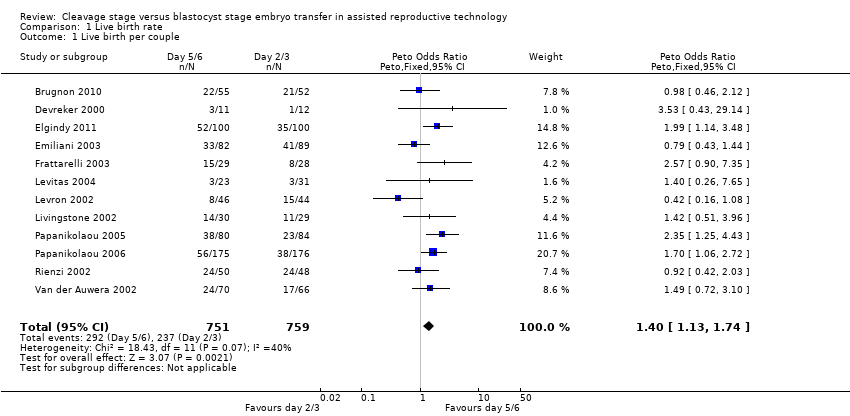
Comparison 1 Live birth rate, Outcome 1 Live birth per couple.

Comparison 1 Live birth rate, Outcome 2 Live birth per couple: grouped by number of embryos transferred.

Comparison 1 Live birth rate, Outcome 3 Live birth rate per couple: grouped by prognosis.

Comparison 1 Live birth rate, Outcome 4 Live birth rate: grouped by day of randomisation.

Comparison 2 Clinical pregnancy rate, Outcome 1 clinical pregnancy rate per couple.
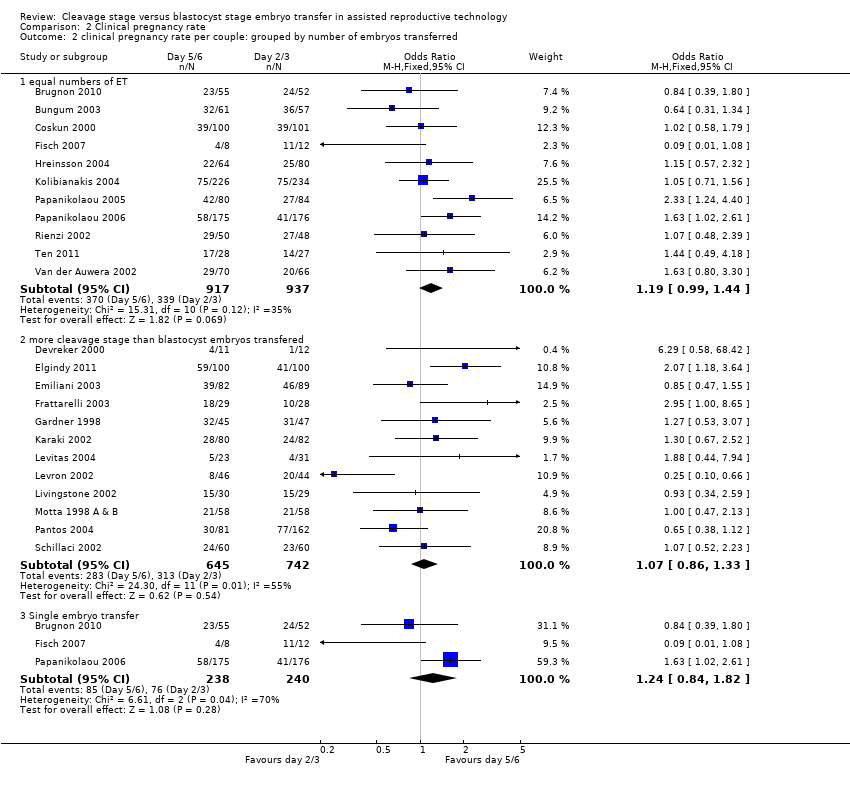
Comparison 2 Clinical pregnancy rate, Outcome 2 clinical pregnancy rate per couple: grouped by number of embryos transferred.

Comparison 2 Clinical pregnancy rate, Outcome 3 clinical pregnancy rate per couple: grouped by prognosis.

Comparison 2 Clinical pregnancy rate, Outcome 4 clinical pregnancy rate per couple: grouped by day of randomisation.

Comparison 3 Cumulative pregnancy rate, Outcome 1 cumulative pregnancy rate from fresh and frozen transfers.
Comparison 4 Multiple‐pregnancy rate, Outcome 1 multiple‐pregnancy rate per couple.
Comparison 4 Multiple‐pregnancy rate, Outcome 2 multiple‐pregnancy rate per couple: grouped by number of embryo transfer.
Comparison 4 Multiple‐pregnancy rate, Outcome 3 multiple‐pregnancy rate per couple: grouped by prognosis.

Comparison 4 Multiple‐pregnancy rate, Outcome 4 high order pregnancies (more than 2 gestational sacs) per couple.

Comparison 4 Multiple‐pregnancy rate, Outcome 5 high order pregnancy: grouped by number of embryos transferred.
Comparison 4 Multiple‐pregnancy rate, Outcome 6 high order pregnancies: grouped by prognosis.
Comparison 4 Multiple‐pregnancy rate, Outcome 7 multiple‐pregnancy rate per pregnancy.
Comparison 4 Multiple‐pregnancy rate, Outcome 8 high order pregnancies per total pregnancies.

Comparison 5 Miscarriage rate, Outcome 1 miscarriage rate per couple.

Comparison 5 Miscarriage rate, Outcome 2 miscarriage rate per pregnancy.

Comparison 6 Embryo freezing rate, Outcome 1 embryo freezing per couple.

Comparison 6 Embryo freezing rate, Outcome 2 Embyro freezing per couple: grouped by number of embryos transferred.

Comparison 6 Embryo freezing rate, Outcome 3 Embryo freezing per couple: grouped by prognostic factors.

Comparison 7 Failure to transfer embryos rate per couple, Outcome 1 Failure to transfer any embryos per couple.

Comparison 7 Failure to transfer embryos rate per couple, Outcome 2 Failure to transfer any embryos per couple: grouped by prognostic factors.

Comparison 7 Failure to transfer embryos rate per couple, Outcome 3 Failure to transfer any embryos per couple: grouped by number of embryos transferred.
| Trial | Culture Tech Day 2/3 | Culture Tech Day 5/6 |
| Brugnon 2010 | G series™ medium (Vitrolife, Sweden) | G series™ medium (Vitrolife, Sweden) |
| Bungum 2003 | Sequential G1 VItrolife | Sequential G1/G2 Vitrolife |
| Coskun 2000 | Sequential Medicult | Sequential G1/G2 Vitrolife |
| Devreker 2000 | NS | NS |
| Elgindy 2011 | NS | NS |
| Emiliani 2003 | In‐house sequential (based on G1/G2) | In‐house sequential (based on G1/G2) |
| Fisch 2007 | ||
| Frattarelli 2003 | Sequential NS | Sequential NS |
| Gardner 1998a | Single Hams F10 In‐house | Sequential G1/G2 In‐house |
| Hreinsson 2004 | Vitro life IVF | Sequential G1/G2 or CCM Vitrolife |
| Karaki 2002 | Medicult | Sequential G1/G2 Vitrolife |
| Kolibianakis 2004 | Sequential G1 Vitrolife | Sequential G1/G2 Vitrolife |
| Levitas 2004 | NS | Sequential ‐ G1/G2 Vitrolife |
| Levron 2002 | NS | NS |
| Livingstone 2002 | Sequential ‐ Sydney IVF Cook | Sequential ‐ Sydney IVF Cook |
| Motta 1998 | Sequential ‐ Irvines P1 | Sequential ‐ Irvines P1 then Blast media |
| Pantos 2004 | ||
| Papanikolaou 2005 | Sequential ‐ Vitrolife G1/G2 GII or GIII | Sequential ‐ Vitrolife G1/G2 GII or GIII |
| Papanikolaou 2006 | Assume Sequential ‐ Vitrolife G1/G2 | Assume Sequential ‐ Vitrolife G1/G2 |
| Rienzi 2002 | Sequential G1 Vitrolife | Sequential G1/G2 Vitrolife |
| Schillaci 2002 | NS | NS |
| Ten 2011 | NS | NS |
| Van der Auwera 2002 | Sequential both Cook and Vitrolife | Sequential both Cook and Vitrolife |
| Study | Blastocyst rate | Implantation D2/3 | Implantation D5/6 | Other |
| Brugnon 2010 | Not stated | 24/52 46.2% | 23/55 41.8% | |
| Bungum 2003 | 55.2% | 50/114 43.9% | 44/120 36.7% | 2/61 patients had only 1 blastocyst |
| Coskun 2000 | 28% | 50/235 21.3% | 52/218 23.9% | 77% patients had at least 1 blastocyst |
| Devreker 2000 | Not stated | 1/34 2.9% | 8/19 42.1% | |
| Elgindy 2011 | 97% | 71/197 36% | 53/280 19% | |
| Emiliani 2003 | 48% | 57/197 28.9% | 50/168 29.8% | |
| Fisch 2007 | Not stated | 11/12 92% | 4/8 50% | |
| Frattarelli 2003 | Not stated | 18/69 26.1% | 23/53 43.4% | |
| Gardner 1998 | 46.5% | 64/174 36.8% | 53/95 55.8% | 85% patients had at least 2 blastocysts |
| Hreinsson 2004 | 33% | 29/139 20.9% | 24/114 21.1% | 2 morula replace (one implanted). 60% preg rate when top quality blasts transferred |
| Karaki 2002 | 33% | 37/291 12.7% | 37/142 26.1% | 9/80 cancelled due to lack of blastocysts (unselected) |
| Kolibiankis 2004 | 50.7% | 96/234 41.0% | 94/226 41.6% | |
| Levitas 2004 | 43% | 4/56 7.1% | 10/24 4.2% | Day 5‐7 26% cancelled due to lack of blastocysts (poor prog) |
| Levron 2002 | 34.2% | 53/137 38.7% | 20/99 20.2% | 6.5% cancelled due to lack of blastocysts (good prog) |
| Livingstone 2002 | not stated | |||
| Motta 1998 | Not stated | 51/262 19.5% | 36/120 30.0% | 6/58 cycles cancelled D5 no blastocysts |
| Pantos 2004 | 44.6% | 15.8% | 15.8% | |
| Papanikolaou 2005 | Not stated | 35/170 20.6% | 59/158 37.3% | 4/158 women had only 1 blast transferred due to lack of availability and 1 had it on request. |
| Papanikolaou 2006 | Not stated | 38/156 24% | 58/149 38.9% | Number of patients with no embryos avail D3: 8 and D5: 11 |
| Rienzi 2002 | 44.8% | 34/96 35.4% | 38/100 38.0% | Good prognosis |
| Schillaci 2002 | 60.3% | 23/168 13.7% | 26/110 23.6% | Unselected population nil cancellations D5 |
| Ten 2011 | Not stated | 21/54 38.9% | 26/56 46.4% | Good prognosis |
| Van der Auwera | 44.7% | 31/106 29.2% | 41/90 45.6% | 27% cancellation D5 (unselected population) |
| Study ID | Day 2/3 | Day 5/6 |
| Brugnon 2010 | 1 | 1 |
| Bungum 2003 | 2.00 | 1.97 |
| Coskun 2000 | 2.3 | 2.2 |
| Devreker 2000 | 2.83 | 1.73 |
| Elgindy 2010 | 2.8 | 1.97 |
| Emiliani 2003 | 2.1 | 1.9 |
| Fisch 2007 | 1 | 1 |
| Frattarelli 2003 | 2.96 | 2.04 |
| Gardner 1998 | 3.7 | 2.2 |
| Hreinsson J | 1.8 | 1.9 |
| Karaki 2002 | 3.5 | 2.0 |
| Kolibiankis 2004 | 1.9 | 1.8 |
| Levitas 2004 | 3.4 | 1.9 |
| Levron 2002 | 3.1 | 2.3 |
| Livingstone | 2.0 | 1.0 |
| Motta 1998 | 4.6 | 2.3 |
| Pantos 2004 | 4 | 3.4 |
| Papanikolaou 2005 | 2 | 1.97 |
| Papanikolaou 2006 | 1 | 1 |
| Rienzi 2002 | 2.0 | 2.0 |
| Schillaci 2002 | 2.8 | 1.8 |
| Ten 2011 | 2 | 2 |
| Van der Auwera 2002 | 1.86 | 1.87 |
| Outcome or subgroup title | No. of studies | No. of participants | Statistical method | Effect size |
| 1 Live birth per couple Show forest plot | 12 | 1510 | Peto Odds Ratio (Peto, Fixed, 95% CI) | 1.40 [1.13, 1.74] |
| 2 Live birth per couple: grouped by number of embryos transferred Show forest plot | 12 | Peto Odds Ratio (Peto, Fixed, 95% CI) | Subtotals only | |
| 2.1 more cleavage stage than blastocyst embyros transferred | 6 | 483 | Peto Odds Ratio (Peto, Fixed, 95% CI) | 1.52 [1.03, 2.23] |
| 2.2 single embryo transfer | 2 | 458 | Peto Odds Ratio (Peto, Fixed, 95% CI) | 1.46 [0.98, 2.19] |
| 2.3 equal number of embryos transferred | 6 | 1027 | Peto Odds Ratio (Peto, Fixed, 95% CI) | 1.35 [1.04, 1.75] |
| 3 Live birth rate per couple: grouped by prognosis Show forest plot | 12 | 1510 | Odds Ratio (M‐H, Random, 95% CI) | 1.37 [1.01, 1.85] |
| 3.1 good prognostic factors | 8 | 1126 | Odds Ratio (M‐H, Random, 95% CI) | 1.43 [0.99, 2.07] |
| 3.2 poor prognostic factors | 2 | 77 | Odds Ratio (M‐H, Random, 95% CI) | 1.99 [0.49, 8.04] |
| 3.3 unselected group | 2 | 307 | Odds Ratio (M‐H, Random, 95% CI) | 1.05 [0.56, 1.97] |
| 4 Live birth rate: grouped by day of randomisation Show forest plot | 12 | 1510 | Odds Ratio (M‐H, Random, 95% CI) | 1.37 [1.01, 1.85] |
| 4.1 randomisation at start of cycle | 5 | 819 | Odds Ratio (M‐H, Random, 95% CI) | 1.25 [0.90, 1.73] |
| 4.2 randomised on day of OPU and day 1 after OPU | 3 | 245 | Odds Ratio (M‐H, Random, 95% CI) | 0.97 [0.37, 2.58] |
| 4.3 randomised Day 2 to 3 post OPU | 2 | 364 | Odds Ratio (M‐H, Random, 95% CI) | 2.17 [1.42, 3.33] |
| 4.4 day of randomisation unstated | 2 | 82 | Odds Ratio (M‐H, Random, 95% CI) | 1.68 [0.65, 4.38] |
| Outcome or subgroup title | No. of studies | No. of participants | Statistical method | Effect size |
| 1 clinical pregnancy rate per couple Show forest plot | 23 | 3241 | Peto Odds Ratio (Peto, Fixed, 95% CI) | 1.14 [0.99, 1.32] |
| 2 clinical pregnancy rate per couple: grouped by number of embryos transferred Show forest plot | 23 | Odds Ratio (M‐H, Fixed, 95% CI) | Subtotals only | |
| 2.1 equal numbers of ET | 11 | 1854 | Odds Ratio (M‐H, Fixed, 95% CI) | 1.19 [0.99, 1.44] |
| 2.2 more cleavage stage than blastocyst embryos transfered | 12 | 1387 | Odds Ratio (M‐H, Fixed, 95% CI) | 1.07 [0.86, 1.33] |
| 2.3 Single embryo transfer | 3 | 478 | Odds Ratio (M‐H, Fixed, 95% CI) | 1.24 [0.84, 1.82] |
| 3 clinical pregnancy rate per couple: grouped by prognosis Show forest plot | 23 | 3241 | Odds Ratio (M‐H, Random, 95% CI) | 1.13 [0.92, 1.40] |
| 3.1 Good prognostic factors | 14 | 1756 | Odds Ratio (M‐H, Random, 95% CI) | 1.15 [0.83, 1.58] |
| 3.2 Poor prognostic factors | 2 | 77 | Odds Ratio (M‐H, Random, 95% CI) | 2.59 [0.75, 8.92] |
| 3.3 Unselected group | 7 | 1408 | Odds Ratio (M‐H, Random, 95% CI) | 1.01 [0.81, 1.25] |
| 4 clinical pregnancy rate per couple: grouped by day of randomisation Show forest plot | 23 | 3241 | Odds Ratio (M‐H, Fixed, 95% CI) | 1.14 [0.99, 1.32] |
| 4.1 Randomised start of cycle | 7 | 1371 | Odds Ratio (M‐H, Fixed, 95% CI) | 1.19 [0.95, 1.49] |
| 4.2 Randomised on day of OPU or day 1 | 8 | 892 | Odds Ratio (M‐H, Fixed, 95% CI) | 1.00 [0.76, 1.31] |
| 4.3 Randomised on day 2 to 3 | 4 | 537 | Odds Ratio (M‐H, Fixed, 95% CI) | 1.59 [1.13, 2.23] |
| 4.4 Day of randomisation unstated | 4 | 441 | Odds Ratio (M‐H, Fixed, 95% CI) | 0.84 [0.57, 1.25] |
| Outcome or subgroup title | No. of studies | No. of participants | Statistical method | Effect size |
| 1 cumulative pregnancy rate from fresh and frozen transfers Show forest plot | 4 | 527 | Peto Odds Ratio (Peto, Fixed, 95% CI) | 1.58 [1.11, 2.25] |
| Outcome or subgroup title | No. of studies | No. of participants | Statistical method | Effect size |
| 1 multiple‐pregnancy rate per couple Show forest plot | 16 | 2481 | Peto Odds Ratio (Peto, Fixed, 95% CI) | 0.92 [0.71, 1.19] |
| 2 multiple‐pregnancy rate per couple: grouped by number of embryo transfer Show forest plot | 16 | Odds Ratio (M‐H, Fixed, 95% CI) | Subtotals only | |
| 2.1 Equal number of embryos transferred | 8 | 1672 | Odds Ratio (M‐H, Fixed, 95% CI) | 1.05 [0.75, 1.46] |
| 2.2 More cleavage stage than blastocyst embryos transferred | 8 | 809 | Odds Ratio (M‐H, Fixed, 95% CI) | 0.75 [0.49, 1.13] |
| 2.3 Single embryo transfer | 1 | 351 | Odds Ratio (M‐H, Fixed, 95% CI) | 0.20 [0.01, 4.17] |
| 3 multiple‐pregnancy rate per couple: grouped by prognosis Show forest plot | 16 | 2481 | Odds Ratio (M‐H, Fixed, 95% CI) | 0.91 [0.70, 1.18] |
| 3.1 Good prognostic factors | 11 | 1498 | Odds Ratio (M‐H, Fixed, 95% CI) | 0.88 [0.63, 1.22] |
| 3.2 Poor prognostic factors | 1 | 54 | Odds Ratio (M‐H, Fixed, 95% CI) | 0.89 [0.14, 5.81] |
| 3.3 Unselected | 4 | 929 | Odds Ratio (M‐H, Fixed, 95% CI) | 0.96 [0.62, 1.47] |
| 4 high order pregnancies (more than 2 gestational sacs) per couple Show forest plot | 12 | 2035 | Odds Ratio (M‐H, Fixed, 95% CI) | 0.44 [0.15, 1.33] |
| 5 high order pregnancy: grouped by number of embryos transferred Show forest plot | 12 | 2035 | Odds Ratio (M‐H, Fixed, 95% CI) | 0.44 [0.15, 1.33] |
| 5.1 Equal number of embryos transferred | 8 | 1672 | Odds Ratio (M‐H, Fixed, 95% CI) | 0.33 [0.01, 8.28] |
| 5.2 More cleavage stage than blastocyst embryos transferred | 4 | 363 | Odds Ratio (M‐H, Fixed, 95% CI) | 0.46 [0.14, 1.49] |
| 6 high order pregnancies: grouped by prognosis Show forest plot | 12 | 2035 | Odds Ratio (M‐H, Fixed, 95% CI) | 0.44 [0.15, 1.33] |
| 6.1 Good prognostic factors | 9 | 1385 | Odds Ratio (M‐H, Fixed, 95% CI) | 0.29 [0.08, 1.06] |
| 6.2 Poor prognostic factors | 1 | 54 | Odds Ratio (M‐H, Fixed, 95% CI) | 4.2 [0.16, 107.89] |
| 6.3 Unselected | 2 | 596 | Odds Ratio (M‐H, Fixed, 95% CI) | 0.0 [0.0, 0.0] |
| 7 multiple‐pregnancy rate per pregnancy Show forest plot | 14 | Odds Ratio (M‐H, Fixed, 95% CI) | Totals not selected | |
| 8 high order pregnancies per total pregnancies Show forest plot | 12 | Odds Ratio (M‐H, Fixed, 95% CI) | Totals not selected | |
| Outcome or subgroup title | No. of studies | No. of participants | Statistical method | Effect size |
| 1 miscarriage rate per couple Show forest plot | 14 | 2127 | Peto Odds Ratio (Peto, Fixed, 95% CI) | 1.14 [0.84, 1.55] |
| 2 miscarriage rate per pregnancy Show forest plot | 14 | Odds Ratio (M‐H, Fixed, 95% CI) | Totals not selected | |
| Outcome or subgroup title | No. of studies | No. of participants | Statistical method | Effect size |
| 1 embryo freezing per couple Show forest plot | 11 | 1729 | Peto Odds Ratio (Peto, Fixed, 95% CI) | 2.88 [2.35, 3.51] |
| 2 Embyro freezing per couple: grouped by number of embryos transferred Show forest plot | 11 | 1729 | Odds Ratio (M‐H, Random, 95% CI) | 4.06 [2.49, 6.60] |
| 2.1 equal number of embryos transferred | 7 | 1118 | Odds Ratio (M‐H, Random, 95% CI) | 4.35 [2.11, 8.97] |
| 2.2 more cleavage stage than blastocyst embryos transferred | 4 | 611 | Odds Ratio (M‐H, Random, 95% CI) | 3.95 [2.09, 7.46] |
| 3 Embryo freezing per couple: grouped by prognostic factors Show forest plot | 10 | 1486 | Odds Ratio (M‐H, Random, 95% CI) | 4.17 [2.41, 7.21] |
| 3.1 good prognostic factors | 6 | 612 | Odds Ratio (M‐H, Random, 95% CI) | 6.39 [3.12, 13.10] |
| 3.2 poor prognostic factors | 0 | 0 | Odds Ratio (M‐H, Random, 95% CI) | 0.0 [0.0, 0.0] |
| 3.3 unselected | 4 | 874 | Odds Ratio (M‐H, Random, 95% CI) | 2.60 [1.31, 5.16] |
| Outcome or subgroup title | No. of studies | No. of participants | Statistical method | Effect size |
| 1 Failure to transfer any embryos per couple Show forest plot | 16 | 2459 | Odds Ratio (M‐H, Fixed, 95% CI) | 0.35 [0.24, 0.51] |
| 2 Failure to transfer any embryos per couple: grouped by prognostic factors Show forest plot | 16 | 2459 | Odds Ratio (M‐H, Fixed, 95% CI) | 0.35 [0.24, 0.51] |
| 2.1 good prognostic factors | 9 | 1315 | Odds Ratio (M‐H, Fixed, 95% CI) | 0.67 [0.35, 1.27] |
| 2.2 poor prognostic factors | 2 | 77 | Odds Ratio (M‐H, Fixed, 95% CI) | 0.20 [0.04, 1.08] |
| 2.3 unselected | 5 | 1067 | Odds Ratio (M‐H, Fixed, 95% CI) | 0.27 [0.17, 0.43] |
| 3 Failure to transfer any embryos per couple: grouped by number of embryos transferred Show forest plot | 16 | Odds Ratio (M‐H, Fixed, 95% CI) | Subtotals only | |
| 3.1 equal number of embryos transferred | 7 | 1321 | Odds Ratio (M‐H, Fixed, 95% CI) | 0.37 [0.23, 0.61] |
| 3.2 more cleavage stage than blastocyst embryos tranferred | 8 | 787 | Odds Ratio (M‐H, Fixed, 95% CI) | 0.23 [0.11, 0.46] |
| 3.3 single embryo transfer | 1 | 351 | Odds Ratio (M‐H, Fixed, 95% CI) | 0.71 [0.28, 1.81] |