Tratamiento farmacológico para la incontinencia fecal en adultos
Información
- DOI:
- https://doi.org/10.1002/14651858.CD002116.pub2Copiar DOI

- Base de datos:
-
- Cochrane Database of Systematic Reviews
- Versión publicada:
-
- 11 junio 2013see what's new
- Tipo:
-
- Intervention
- Etapa:
-
- Review
- Grupo Editorial Cochrane:
-
Grupo Cochrane de Incontinencia
- Copyright:
-
- Copyright © 2013 The Cochrane Collaboration. Published by John Wiley & Sons, Ltd.
Cifras del artículo
Altmetric:
Citado por:
Autores
Contributions of authors
One review authors (M. Cheetham) wrote the initial protocol for the review. Three review authors (M. Cheetham, Mirian Brazzelli, and C. Norton) assessed the pertinence and quality of included studies. All review authors independently extracted data from trials reports, interpreted the results, and contributed towards writing the final review. For the first update, CG screened the abstracts identified from the updated search and added two new included trials. For 2013 update, Muhammad Imran Omar (MO) and Cameron Edwin Alexander (CA) screened all the abstracts and included three additional trials. MO and CA re‐assessed the risk of bias of all the included trials in accordance with the current methodology and contributed in the writing of the manuscript for this update.
Sources of support
Internal sources
-
No sources of support supplied
External sources
-
National Institute for Health Research (NIHR), UK.
The National Institute for Health Research (NIHR) is the largest single funder of the Cochrane Incontinence Group.
Declarations of interest
None known.
Acknowledgements
We thank all members of the Cochrane Incontinence Review Group in Aberdeen for their assistance with the review. The review authors would like to acknowledge the contributions of the previous review authors Mark J Cheetham, Miriam Brazzelli, Christine Norton, Cathryn MA Glazener and Jean C Hay‐Smith. The review authors are grateful to Euan Fisher and Mayret Castillo for translation and data extraction of one trial (Lumi 2009).
Version history
| Published | Title | Stage | Authors | Version |
| 2013 Jun 11 | Drug treatment for faecal incontinence in adults | Review | Muhammad Imran Omar, Cameron Edwin Alexander | |
| 2002 Jul 22 | Drug treatment for faecal incontinence in adults | Review | Mark J Cheetham, Miriam Brazzelli, Christine C Norton, Cathryn MA Glazener | |
Keywords
MeSH
Medical Subject Headings (MeSH) Keywords
- Antidiarrheals [therapeutic use];
- Diarrhea [drug therapy];
- Epinephrine [therapeutic use];
- Fecal Incontinence [*drug therapy];
- Gastrointestinal Agents [therapeutic use];
- Lactulose [therapeutic use];
- Randomized Controlled Trials as Topic;
- Valproic Acid [therapeutic use];
- Zinc Compounds [therapeutic use];
Medical Subject Headings Check Words
Adult; Humans;

PRISMA study flow diagram.

'Risk of bias' summary: review authors' judgements about each risk of bias item for each included study.
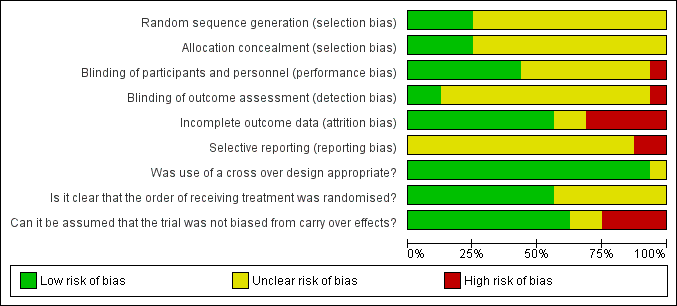
'Risk of bias' graph: review authors' judgements about each risk of bias item presented as percentages across all included studies.
| Study | Drug | Placebo | Significance |
| Loperamide versus placebo | |||
| Hallgren 1994 # | 3/28 during the day | 7/28 during the day | |
| Sun 1997 # | 4/11 in 24 hours | 8/11 in 24 hours | P < 0.05 |
| Diphenoxylate + atropine versus placebo | |||
| Harford 1980 # | 0/15 in 24 hours | 3/15 in 24 hours | |
| Phenylephrine gel versus placebo | |||
| Carapeti 2000b # | 8/12 | 12/12 | |
| Sodium valproate versus placebo | |||
| Kusunoki 1990 # | 3/17 | 10/17 | |
Comparison 1 DRUG VERSUS PLACEBO, Outcome 1 Number of people failing to achieve full continence.
| Study | Drug | Placebo |
| Loperamide versus placebo | ||
| Read 1982 # | Episodes of urgency: 7/26 Per cent unformed stool per week (mean, range): 40% (0%‐100%) | Episodes of urgency: 23/26 Per cent unformed stool per week (mean, range): 57% (0%‐100%) (P < 0.001) |
| Sun 1997 # | No improvement in stool consistency: 2/11 Per cent of days with unformed stools: 33% (loperamide oxide) | No improvement in stool consistency: 8/11 Per cent of days with unformed stools: 66% (P < 0.02) |
| Diphenoxylate + atropine versus placebo | ||
| Harford 1980 # | No improvement in stool weight and frequency: 3/15 | No improvement in stool weight and frequency: 3/15 |
| Phenylephrine gel versus placebo | ||
| Carapeti 2000a # | No subjective improvement: 30/36 | 34/36 |
| Carapeti 2000b # | No undefined 'improvement': 6/12 | 11/12 |
Comparison 1 DRUG VERSUS PLACEBO, Outcome 2 Number of people failing to improve incontinence.
| Study | Drug | Placebo |
| Loperamide versus placebo | ||
| Read 1982 # | Mean 0.6 | Mean 0.9 (range 0‐6) |
| Phenylephrine cream versus placebo | ||
| Lumi 2009 | Median 5.4 (range 0‐14) | Median 9 (range 0‐19) |
Comparison 1 DRUG VERSUS PLACEBO, Outcome 3 Number of faecal incontinence episodes.
| Study | Drug | Placebo | Significance |
| Loperamide versus placebo | |||
| Hallgren 1994 # | N 28 mean 4.24 (SD 1.86) | N 28 mean 6.43 (SD 1.99) | |
| Read 1982 # | N 26 mean 1.6 (range 1‐6.3) | N 26 mean 2.4 (range 0‐7.7) | P < 0.001 Wilcoxon's rank sum test for paired data |
| Sun 1997 # | N 11 mean 1.43 (SD 1) | N 11 mean 2 (SD 1) | P < 0.02 |
| Diphenoxylate + atropine versus placebo | |||
| Harford 1980 # | N 15 mean 2.6 (SD 2.71) | N 15 mean 4.9 (SD 3.1) | |
| Sodium valproate versus placebo | |||
| Kusunoki 1990 # | N 17 mean 5.98 (SD 2.97) | N 17 mean 9.65 (SD 3.59) | |
Comparison 1 DRUG VERSUS PLACEBO, Outcome 4 Frequency of defecation (per day).
| Study | Drug | Placebo | Significance |
| Loperamide versus placebo | |||
| Sun 1997 # | visual analogue incontinence | N 11 mean 43 (SD 37) | P = 0.12 |
| Phenylephrine gel versus placebo | |||
| Carapeti 2000a # | N 18 mean 12.5 (SD 3.4) | N 18 mean 12.6 (SD 4.2) | No significant difference |
| Carapeti 2000b # | N 12 mean 12.2 (SD 5.7) | N 12 mean 16.5 (SD 4.4) | |
| Park 2007 | Anal incontinence evaluated with Faecal Incontinence Severity Index (FISI) and reported as mean (SD) n = 17; Baseline: 32.5 (14.5); After: 32.3 (14.7) P = 0.940 | Anal incontinence evaluated with Faecal Incontinence Severity Index (FISI) and reported as mean (SD) n = 12; Baseline: 32.1 (11.2); After: 32.4 (14.4) P = 0.626 | |
| Zinc aluminium ointment versus placebo ointment | |||
| Pinedo 2012 | Wexner Faecal Incontinence Score reported before and after the treatment and reported as mean (SD) n = 24; Before: 16.6 (6‐20); After: 8.5 (0‐11) P = < 0.001 | Wexner Faecal Incontinence Score reported before and after the treatmentand reported as mean (SD) n = 20; Before: 16.7 (5‐18); After: 13.1 (5‐17) P = 0.02 | There was a significant difference in the final scores favouring the treatment group (P = 0.001) |
Comparison 1 DRUG VERSUS PLACEBO, Outcome 5 Faecal incontinence score.
| Study | Drug | Placebo | Significance |
| Loperamide versus placebo | |||
| Read 1982 # | N 26 mean 102 (range 0‐467) | N 26 mean 186 (range 0‐466) | P < 0.001 Wilcoxon's rank sum test for paired data |
| Sun 1997 # | N 11 mean 282 (SD 212) | N 11 mean 423 (SD 163) | P = 0.11 |
| Diphenoxylate + atropine versus placebo | |||
| Harford 1980 # | N 15 mean 256 (SD 333) | N 15 mean 460 (SD 581) | |
Comparison 1 DRUG VERSUS PLACEBO, Outcome 6 Stool weight (grammes in 24 hours).
| Study | Drug | Placebo |
| Loperamide versus placebo | ||
| Hallgren 1994 # | During the day: 1/28 | During the day: |
Comparison 1 DRUG VERSUS PLACEBO, Outcome 7 Number of people using pads.
| Study | Drug | Placebo |
| Loperamide versus placebo | ||
| Read 1982 # | 18/26 (constipation 11, diarrhoea 4, nausea and vomiting 3, abdominal pain 2) | 1/26 (abdominal pain) |
| Sun 1997 # | 6/11 (headache, nausea, dizzyness, abdominal pain, constipation) | 3/11 |
| Phenylephrine gel versus placebo | ||
| Carapeti 2000a # | 3/36 (mild dermatitis after phenylephrine gel application, which settled when drug stopped) | 0/36 |
| Carapeti 2000b # | 0/12 | 0/12 |
| Cheetham 2001 # | 2/10 (burning sensation after phenylephrine gel application, which settled within minutes) | 0/10 |
| Park 2007 | Dermatitis reaction: 5/17; B = 1/12 | Dermatitis reaction: 1/12 |
| Sodium valproate versus placebo | ||
| Kusunoki 1990 # | 8/17 (abdominal pain and nausea) | 0/17 |
| Zinc aluminium ointment versus placebo ointment | ||
| Pinedo 2012 | 0/24 | 0/20 |
Comparison 1 DRUG VERSUS PLACEBO, Outcome 8 Number of people with adverse effects.
| Study | Drug | Placebo |
| Sodium valproate versus placebo | ||
| Kusunoki 1990 # | 3/17 | 9/17 |
Comparison 1 DRUG VERSUS PLACEBO, Outcome 9 Number of people with perianal skin problems.
| Study | Drug | Placebo |
| Loperamide versus placebo | ||
| Hallgren 1994 # | N 28 mean 62 (SD 16) | versus |
| Sun 1997 # | N 11 mean 76 (SD 40) | N 11 mean 69 (SD 35) |
| Diphenoxylate + atropine versus placebo | ||
| Harford 1980 # | N 15 mean 41 (SD 23) | N 15 mean 39 (SD 19) |
| Phenylephrine gel versus placebo | ||
| Carapeti 2000a # | N 18 mean 65 (SD 21) | N 18 mean 54 (SD 21) |
| Carapeti 2000b # | N 12 mean 89 (SD 17) | N 12 mean 75 (SD 14) |
| Cheetham 2001 # | Statistically significant differences between phenylephrine gel (in concentrations of 30% and 40% only) | compared with placebo (P < 0.05) |
| Sodium valproate versus placebo | ||
| Kusunoki 1990 # | N 17 mean 63.6 (SD 12.4) | N 17 mean 42.5 (SD 8.9) |
Comparison 1 DRUG VERSUS PLACEBO, Outcome 10 Maximum resting anal pressure (mmHg).
| Study | Domain | Drug (n = 17); reported as mean (SD) | Placebo (n = 12); reported as mean (SD) |
| Phenylephrine gel versus placebo | |||
| Park 2007 | Resting pressure (mmHg) | Baseline: 30.0 (12.3); After: 27.3 (12.7) P = 0.362 | Baseline: 32.6 (14.2); After: 27.2 (15.0) P = 0.306 |
| Park 2007 | Squeezing pressure (mmHg) | Baseline: 143.3 (60.5); After: 160.4 (76.9) P = 0.083 | Baseline: 152.6 (86.5); After: 147.1 (76.5) P = 0.625 |
| Park 2007 | Sustained duration (s) | Baseline: 41.9 (24.5); After: 44.9 (48.3) P = 0.848 | Baseline: 39.6 (24.4); After: 32.8 (14.4) P = 0.187 |
| Park 2007 | Sphincter length (cm) | Baseline: 3.2 (0.9); After: 3.4 (0.8) P = 0.368 | Baseline: 3.5 (0.8); After: 3.4 (0.8) P = 0.743 |
| Park 2007 | High pressure zone (cm) | Baseline: 2.4 (2.1); After: 1.9 (0.5) P = 0.378 | Baseline: 2.1 (0.9); After: 2.3 (0.9) P = 0.556 |
Comparison 1 DRUG VERSUS PLACEBO, Outcome 11 Manometry.
| Study | Drug | Placebo |
| Loperamide versus placebo | ||
| Hallgren 1994 # | N 28 mean 223 (SD 82) | N 28 mean 219 (SD 93) |
| Sun 1997 # | N 11 mean 163 (SD 86) | N 11 mean 155 (SD 85) |
| Diphenoxylate + atropine versus placebo | ||
| Harford 1980 # | N 15 mean 94 (SD 68) | N 15 mean 96 (SD 68) |
Comparison 1 DRUG VERSUS PLACEBO, Outcome 12 Maximum anal squeeze pressure (mmHg).
| Study | Drug | Placebo |
| Diphenoxylate + atropine versus placebo | ||
| Harford 1980 # | N 15 mean 87 (SD 127) | N 15 mean 86 (SD 127) |
Comparison 1 DRUG VERSUS PLACEBO, Outcome 13 Duration of squeeze (seconds).
| Study | Drug | Placebo |
| Loperamide versus placebo | ||
| Hallgren 1994 # | N 28 mean 29.6 (SD 11.7) | N 28 mean 26.5 (SD 14.9) |
| Diphenoxylate + atropine versus placebo | ||
| Harford 1980 # | N 15 mean 12 (SD 12) | N 15 mean 31 (SD 62) |
Comparison 1 DRUG VERSUS PLACEBO, Outcome 14 Sensory threshold (cm water).
| Study | Drug | Placebo | Significance |
| Loperamide versus placebo | |||
| Sun 1997 # | N 11 mean 223 (SD 274) | versus | P = 0.07 |
| Diphenoxylate + atropine versus placebo | |||
| Harford 1980 # | N 15 mean 492 (SD 461) | N 15 mean 486 (SD 364) | |
Comparison 1 DRUG VERSUS PLACEBO, Outcome 15 Saline retention test (mL).
| Study | Drug | Placebo | Significance |
| Loperamide versus placebo | |||
| Sun 1997 # | N 11 mean 61 hours (SD 13) | N 11 mean 39 hours (SD 15) | Significantly prolonged (P < 0.001) in patients taking loperamide oxide |
Comparison 1 DRUG VERSUS PLACEBO, Outcome 16 Whole‐gut transit time.
| Study | Drug | Placebo | Significance |
| Ryan 1974 | 154 items during trial period | 332 items | P < 0.01 |
Comparison 1 DRUG VERSUS PLACEBO, Outcome 17 Number of soiled items (bedding and or clothing).
| Study | Drug | Placebo | Significance |
| Laxative (lactulose) versus placebo | |||
| Ryan 1974 | 283 days of help | 322 days of help | P < 0.05 during trial period |
Comparison 1 DRUG VERSUS PLACEBO, Outcome 18 Help required from nurses.
| Study | Domains | Drug (n = 17); reported as mean (SD) | Placebo (n = 12); reported as mean (SD) |
| Zinc aluminium ointment versus placebo ointment | |||
| Pinedo 2012 | Lifestyle | Baseline: 2.49 (1.06); After: 3.58 (1.18) P = < 0.001 | Baseline: 2.50 (1.01); After: 2.55 (1.03) P = 0.151 |
| Pinedo 2012 | Conduct | Baseline: 2.19 (1.02); After: 3.12 (1.16) P = < 0.001 | Baseline: 2.17 (0.91); After: 2.37 (1.13) P = 0.104 |
| Pinedo 2012 | Embarrassment | Baseline: 1.54 (0.82); After: 2.5 (1.32) P = < 0.001 | Baseline: 1.56 (0.74); After: 1.76 (0.84) P = 0.043 |
| Pinedo 2012 | Depression | Baseline: 2.51 (1.01); After: 3.48 (1.17) P = 0.001 | Baseline: 2.46 (1.02); After: 2.71 (1.13) P = 0.093 |
| Phenylephrine gel versus placebo | |||
| Park 2007 | Lifestyle | Baseline: 2.9 (0.8); After: 2.9 (1.0) P = 0.801 | Baseline: 2.7 (0.5); After: 3.0 (0.8) P = 0.269 |
| Park 2007 | Coping | Baseline: 2.5 (0.9); After: 2.8 (0.9) P= 0.110 | Baseline: 2.5 (0.5); After: 2.8 (0.5) P = 0.119 |
| Park 2007 | Depression | Baseline: 3.2 (0.7); After: 3.2 (0.8) P = 0.415 | Baseline: 3.1 (0.5); After: 3.2 (0.5) P = 0.554 |
| Park 2007 | Embarrassment | Baseline: 2.7 (0.7); After: 3.0 (0.7) P = 0.090 | Baseline: 2.7 (0.6); After: 2.6 (0.8) P = 0.855 |
Comparison 1 DRUG VERSUS PLACEBO, Outcome 19 Faecal Incontinence Quality of Life (FIQL) score.
| Study | Loperamide | Codeine | Diphenox. + atropine | Significance |
| Solid stool (%) | ||||
| Palmer 1980 # | 67.8% (SD 34) | 58.4% (SD 25.9) | 36.3% (SD 33.3) | Diphenoxylate was associated with a signficantly smaller percentage of solid stools than either loperamide or codeine (P < 0.01) |
| Number of people with faecal incontinence | ||||
| Palmer 1980 # | 2/25 | 3/25 | 6/25 | |
| Stool frequency | ||||
| Palmer 1980 # | N 15 mean 1.8 (SD 0.3) | N 15 mean 1.9 (SD 0.3) | N 15 mean 1.9 (SD 0.3) | |
| Number of people with urgency | ||||
| Palmer 1980 # | 3/16 | 4/17 | 9/17 | Diphenoxylate was significantly worse than loperamide or codenine, P < 0.05 |
| Adverse effects | ||||
| Palmer 1980 # | 22 in 10/25 patients | 29 in 12/25 patients | 39 in 12/25 patients | Significantly more adverse effects with diphenoxylate than loperamide, P < 0.05 |
| Adverse effects causing withdrawal | ||||
| Palmer 1980 # | 4/25 | 4/25 | 5/25 | |
Comparison 2 ONE DRUG VERSUS ANOTHER DRUG OR A COMBINATIONOF DRUGS, Outcome 1 Loperamide versus codeine versus diphenoxylate + atropine sulfate.
| Study | Lactulose | Lactul + supp + enema | Significance |
| Number of faecal incontinence episodes in 4 weeks | |||
| Chassagne 2000 | N 61 mean 24 (SD 11.5 ) | N 62 mean 24 (SD 10.8) | P = 0.9 |
| Number of soiled items (bedding and or clothing) in 4 weeks | |||
| Chassagne 2000 | N 61 mean 80 (SD 16.1) | N 62 mean 78 (SD 20.7) | P = 0.55 |
Comparison 2 ONE DRUG VERSUS ANOTHER DRUG OR A COMBINATIONOF DRUGS, Outcome 2 Osmotic laxative (lactulose) versus osmotic laxative + glycerine suppository + enema.
| Study | Data | Significance |
| Cohen 2001 # | Oral administration resulted in decreased stool frequency compared with suppository administration | P < 0.02 |
Comparison 2 ONE DRUG VERSUS ANOTHER DRUG OR A COMBINATIONOF DRUGS, Outcome 3 Oral versus suppository administration of loperamide.
| Study | Outcome information | Significance |
| Stool frequency | ||
| Fox 2005 # | No effect | |
| Stool consistency | ||
| Fox 2005 # | Trend for increased stool consistency from median (IQR) score 0.7 (0.5 to 0.9) with placebo to 0.4 (0.3 to 0.6) with 6 mg dose (0 = all hard, 1 = all liquid) | |
| Faecal incontinence | ||
| Fox 2005 # | Less faecal spotting and incontinence with loperamide vs placebo | P < 0.05 |
| Dose response for faecal incontinence | ||
| Fox 2005 # | Significant positive dose‐response relationship with increasing dose of loperamide (reduced FI with 2 mg dose, and almost no FI with 4 mg and 6 mg doses) | |
| Adverse effects | ||
| Fox 2005 # | Adverse effects: none (specifically no severe constipation with the highest doses) | |
Comparison 2 ONE DRUG VERSUS ANOTHER DRUG OR A COMBINATIONOF DRUGS, Outcome 4 Different doses of oral loperamide.
| Outcome or subgroup title | No. of studies | No. of participants | Statistical method | Effect size |
| 1 Number of people failing to achieve full continence Show forest plot | Other data | No numeric data | ||
| 1.1 Loperamide versus placebo | Other data | No numeric data | ||
| 1.2 Diphenoxylate + atropine versus placebo | Other data | No numeric data | ||
| 1.3 Phenylephrine gel versus placebo | Other data | No numeric data | ||
| 1.4 Sodium valproate versus placebo | Other data | No numeric data | ||
| 2 Number of people failing to improve incontinence Show forest plot | Other data | No numeric data | ||
| 2.1 Loperamide versus placebo | Other data | No numeric data | ||
| 2.2 Diphenoxylate + atropine versus placebo | Other data | No numeric data | ||
| 2.3 Phenylephrine gel versus placebo | Other data | No numeric data | ||
| 3 Number of faecal incontinence episodes Show forest plot | Other data | No numeric data | ||
| 3.1 Loperamide versus placebo | Other data | No numeric data | ||
| 3.2 Phenylephrine cream versus placebo | Other data | No numeric data | ||
| 4 Frequency of defecation (per day) Show forest plot | Other data | No numeric data | ||
| 4.1 Loperamide versus placebo | Other data | No numeric data | ||
| 4.2 Diphenoxylate + atropine versus placebo | Other data | No numeric data | ||
| 4.3 Sodium valproate versus placebo | Other data | No numeric data | ||
| 5 Faecal incontinence score Show forest plot | Other data | No numeric data | ||
| 5.1 Loperamide versus placebo | Other data | No numeric data | ||
| 5.2 Phenylephrine gel versus placebo | Other data | No numeric data | ||
| 5.3 Zinc aluminium ointment versus placebo ointment | Other data | No numeric data | ||
| 6 Stool weight (grammes in 24 hours) Show forest plot | Other data | No numeric data | ||
| 6.1 Loperamide versus placebo | Other data | No numeric data | ||
| 6.2 Diphenoxylate + atropine versus placebo | Other data | No numeric data | ||
| 7 Number of people using pads Show forest plot | Other data | No numeric data | ||
| 7.1 Loperamide versus placebo | Other data | No numeric data | ||
| 8 Number of people with adverse effects Show forest plot | Other data | No numeric data | ||
| 8.1 Loperamide versus placebo | Other data | No numeric data | ||
| 8.2 Phenylephrine gel versus placebo | Other data | No numeric data | ||
| 8.3 Sodium valproate versus placebo | Other data | No numeric data | ||
| 8.4 Zinc aluminium ointment versus placebo ointment | Other data | No numeric data | ||
| 9 Number of people with perianal skin problems Show forest plot | Other data | No numeric data | ||
| 9.1 Sodium valproate versus placebo | Other data | No numeric data | ||
| 10 Maximum resting anal pressure (mmHg) Show forest plot | Other data | No numeric data | ||
| 10.1 Loperamide versus placebo | Other data | No numeric data | ||
| 10.2 Diphenoxylate + atropine versus placebo | Other data | No numeric data | ||
| 10.3 Phenylephrine gel versus placebo | Other data | No numeric data | ||
| 10.4 Sodium valproate versus placebo | Other data | No numeric data | ||
| 11 Manometry Show forest plot | Other data | No numeric data | ||
| 11.1 Phenylephrine gel versus placebo | Other data | No numeric data | ||
| 12 Maximum anal squeeze pressure (mmHg) Show forest plot | Other data | No numeric data | ||
| 12.1 Loperamide versus placebo | Other data | No numeric data | ||
| 12.2 Diphenoxylate + atropine versus placebo | Other data | No numeric data | ||
| 13 Duration of squeeze (seconds) Show forest plot | Other data | No numeric data | ||
| 13.1 Diphenoxylate + atropine versus placebo | Other data | No numeric data | ||
| 14 Sensory threshold (cm water) Show forest plot | Other data | No numeric data | ||
| 14.1 Loperamide versus placebo | Other data | No numeric data | ||
| 14.2 Diphenoxylate + atropine versus placebo | Other data | No numeric data | ||
| 15 Saline retention test (mL) Show forest plot | Other data | No numeric data | ||
| 15.1 Loperamide versus placebo | Other data | No numeric data | ||
| 15.2 Diphenoxylate + atropine versus placebo | Other data | No numeric data | ||
| 16 Whole‐gut transit time Show forest plot | Other data | No numeric data | ||
| 16.1 Loperamide versus placebo | Other data | No numeric data | ||
| 17 Number of soiled items (bedding and or clothing) Show forest plot | Other data | No numeric data | ||
| 18 Help required from nurses Show forest plot | Other data | No numeric data | ||
| 18.1 Laxative (lactulose) versus placebo | Other data | No numeric data | ||
| 19 Faecal Incontinence Quality of Life (FIQL) score Show forest plot | Other data | No numeric data | ||
| 19.1 Zinc aluminium ointment versus placebo ointment | Other data | No numeric data | ||
| 19.2 Phenylephrine gel versus placebo | Other data | No numeric data | ||
| Outcome or subgroup title | No. of studies | No. of participants | Statistical method | Effect size |
| 1 Loperamide versus codeine versus diphenoxylate + atropine sulfate Show forest plot | Other data | No numeric data | ||
| 1.1 Solid stool (%) | Other data | No numeric data | ||
| 1.2 Number of people with faecal incontinence | Other data | No numeric data | ||
| 1.3 Stool frequency | Other data | No numeric data | ||
| 1.4 Number of people with urgency | Other data | No numeric data | ||
| 1.5 Adverse effects | Other data | No numeric data | ||
| 1.6 Adverse effects causing withdrawal | Other data | No numeric data | ||
| 2 Osmotic laxative (lactulose) versus osmotic laxative + glycerine suppository + enema Show forest plot | Other data | No numeric data | ||
| 2.1 Number of faecal incontinence episodes in 4 weeks | Other data | No numeric data | ||
| 2.2 Number of soiled items (bedding and or clothing) in 4 weeks | Other data | No numeric data | ||
| 3 Oral versus suppository administration of loperamide Show forest plot | Other data | No numeric data | ||
| 4 Different doses of oral loperamide Show forest plot | Other data | No numeric data | ||
| 4.1 Stool frequency | Other data | No numeric data | ||
| 4.2 Stool consistency | Other data | No numeric data | ||
| 4.3 Faecal incontinence | Other data | No numeric data | ||
| 4.4 Dose response for faecal incontinence | Other data | No numeric data | ||
| 4.5 Adverse effects | Other data | No numeric data | ||