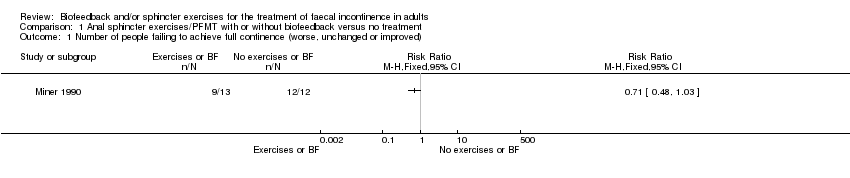
| 1 Number of people failing to achieve full continence (worse, unchanged or improved) Show forest plot | 1 | | Risk Ratio (M‐H, Fixed, 95% CI) | Totals not selected |
|
| 1.1 Exercises +BF+ ES vs ES alone | 1 | | Risk Ratio (M‐H, Fixed, 95% CI) | 0.0 [0.0, 0.0] |
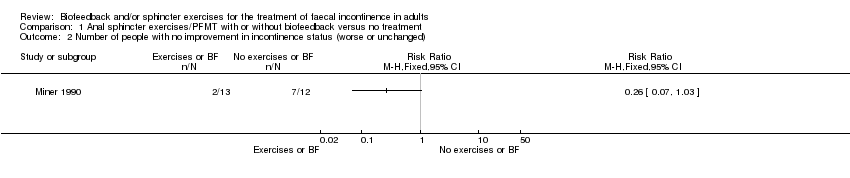
| 2 Number of people with no improvement in incontinence status (worse or unchanged) | 0 | 0 | Risk Ratio (M‐H, Fixed, 95% CI) | 0.0 [0.0, 0.0] |
| 3 Satisfaction with the treatment | 0 | 0 | Risk Ratio (M‐H, Fixed, 95% CI) | 0.0 [0.0, 0.0] |
| 4 Number of incontinence episodes per week Show forest plot | 1 | | Mean Difference (IV, Fixed, 95% CI) | Totals not selected |
|
| 4.1 Exercises + drugs vs SNS | 1 | | Mean Difference (IV, Fixed, 95% CI) | 0.0 [0.0, 0.0] |
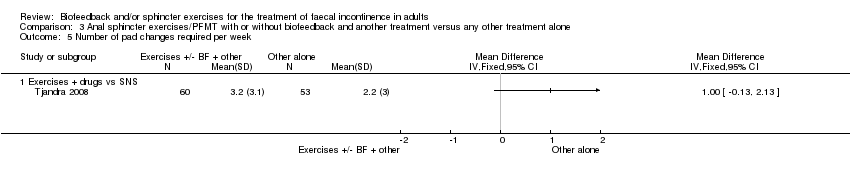
| 5 Number of pad changes required per week Show forest plot | 1 | | Mean Difference (IV, Fixed, 95% CI) | Totals not selected |
|
| 5.1 Exercises + drugs vs SNS | 1 | | Mean Difference (IV, Fixed, 95% CI) | 0.0 [0.0, 0.0] |
| 6 Incontinence score Show forest plot | 3 | | Mean Difference (IV, Fixed, 95% CI) | Totals not selected |
|
| 6.1 Exercises + BF + surgery vs surgery alone | 1 | | Mean Difference (IV, Fixed, 95% CI) | 0.0 [0.0, 0.0] |
| 6.2 Exercises + drugs vs SNS | 1 | | Mean Difference (IV, Fixed, 95% CI) | 0.0 [0.0, 0.0] |
| 6.3 Exercises + BF + ES vs ES alone | 1 | | Mean Difference (IV, Fixed, 95% CI) | 0.0 [0.0, 0.0] |
| 7 Number of people with adverse effects | 0 | 0 | Risk Ratio (M‐H, Fixed, 95% CI) | 0.0 [0.0, 0.0] |
| 8 Sensory threshold (rectal balloon distension ‐ ml) | 0 | 0 | Mean Difference (IV, Fixed, 95% CI) | 0.0 [0.0, 0.0] |
| 9 Manometric resting pressure | 0 | | Mean Difference (IV, Fixed, 95% CI) | Totals not selected |
| 9.1 Exercises + BF + ES vs ES alone | 0 | | Mean Difference (IV, Fixed, 95% CI) | 0.0 [0.0, 0.0] |
| 10 Manometric squeeze pressure (cm of water) | 0 | | Mean Difference (IV, Fixed, 95% CI) | Totals not selected |
| 10.1 Exercises + BF + ES vs ES alone | 0 | | Mean Difference (IV, Fixed, 95% CI) | 0.0 [0.0, 0.0] |
| 11 Manometric squeeze increment (cm of water) | 0 | 0 | Mean Difference (IV, Fixed, 95% CI) | 0.0 [0.0, 0.0] |
| 12 Duration of squeeze (seconds) | 0 | 0 | Mean Difference (IV, Fixed, 95% CI) | 0.0 [0.0, 0.0] |
| 13 Vector symmetry index | 0 | 0 | Mean Difference (IV, Fixed, 95% CI) | 0.0 [0.0, 0.0] |
| 14 Saline retention test (ml) | 0 | 0 | Mean Difference (IV, Fixed, 95% CI) | 0.0 [0.0, 0.0] |
| 15 General health measures Show forest plot | 1 | | Mean Difference (IV, Fixed, 95% CI) | Totals not selected |
|
| 15.1 Exercises + drugs vs SNS | 1 | | Mean Difference (IV, Fixed, 95% CI) | 0.0 [0.0, 0.0] |
| 16 Condition specific quality of life measures Show forest plot | 1 | | Mean Difference (IV, Fixed, 95% CI) | Totals not selected |
|
| 16.1 Exercises + drugs vs SNS | 1 | | Mean Difference (IV, Fixed, 95% CI) | 0.0 [0.0, 0.0] |
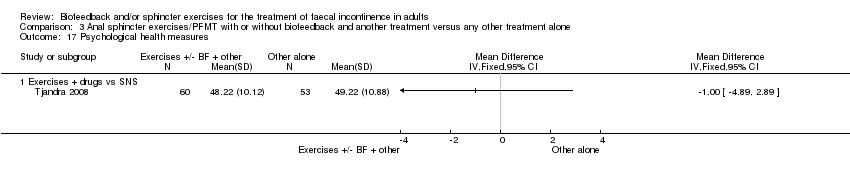
| 17 Psychological health measures Show forest plot | 1 | | Mean Difference (IV, Fixed, 95% CI) | Totals not selected |
|
| 17.1 Exercises + drugs vs SNS | 1 | | Mean Difference (IV, Fixed, 95% CI) | 0.0 [0.0, 0.0] |
| 18 Activities of daily living measures | 0 | 0 | Mean Difference (IV, Fixed, 95% CI) | 0.0 [0.0, 0.0] |
| 19 Satisfaction with treatment (VAS) Show forest plot | 1 | | Mean Difference (IV, Fixed, 95% CI) | Totals not selected |
|
| 19.1 Exercises + BF + surgery vs surgery alone | 1 | | Mean Difference (IV, Fixed, 95% CI) | 0.0 [0.0, 0.0] |
| 20 Manometric pressures (medians) Show forest plot | | | Other data | No numeric data |
|
| 20.1 Exercises + BF + education vs exercises + education | | | Other data | No numeric data |