Profesional penjagaan primer menyediakan penjagaan yang tidak mendesak di jabatan kecemasan hospital
Referencias
References to studies included in this review
References to studies excluded from this review
Additional references
References to other published versions of this review
Characteristics of studies
Characteristics of included studies [ordered by study ID]
Ir a:
| Methods | Design: non‐randomised trial Timeline: 1 June 1989 to 31 May 1990 (not bank holidays or first 2 weeks of August, February) Duration: 1 year Triage: patients categorised by trained nurses based on perceived need for care as either 'primary care' or 'accident and emergency' Data collection: Data on process and outcome variables (doctor's use of radiology, haematology, chemical pathology and microbiology investigations, items prescribed), referral and discharge decisions were obtained from hospital records and consultation record forms. Patient satisfaction and health status were assessed through a simple questionnaire (administered by phone or through post) to assess (1) self reported recovery in 7 to 10 days subsequent to attending ED and (2) health‐seeking behaviour during this period, including re‐attendance at ED or attendance at own GP surgery. | |
| Participants | Intervention group: N = 8 GPs (11 GPs applied, 6 were appointed, 2 left during study and were replaced) Control group: N = 31 EPs (27 senior house officers, 3 registrars, and 1 senior registrar) Provider characteristics: none reported Patients: new ED attendees with 'primary care' suitable problems Total number of patients: N = 4641; intervention group: n = 1702 patients seen by GPs; control group: n = 2939 patients seen by EPs Patient characteristics: Sex: 47.4% female Age: 41.7% 17 to 30 years Duration of complaints: 62.2% problems > 24 hours; 20.8% had previously seen a GP Most common diagnoses: injury and poisoning (44.4%), musculoskeletal diseases (13.7%), non‐specific symptoms and signs (7.0%) Patient characteristics for control and intervention groups not available. Setting: Hospital: one, King’s College Hospital Country: United Kingdom Hospital characteristics (1990 figures): Beds: n/a Teaching hospital, inner city, "multiethnic, socially deprived" Yearly attendance: 70,000 Yearly re‐attendance: n/a | |
| Interventions | Intervention: sessional GPs providing care for non‐urgent patients in the ED Control: regularly scheduled EPs providing care for non‐urgent patients in the ED Patients referred by GPs were excluded. Study took place from 1 June 1989 until 31 May 1990 (48 weeks total within 12 months, as bank holidays and the first two weeks of August and February when senior house officers change employment were excluded). Primary care sessions were established within the ED from 10‐1300 h, 14‐1700 h, and 18‐2100 h each day, except weekends when evening sessions were not available (see Figure 2). 1 physician (either a GP or an EP) was allocated to staff each primary care session according to a weekly rota. All patients triaged as 'primary care suitable' during a particular session were seen by the same physician (a GP or an EP). Medical staff knew patients’ triage status, but patients were unaware of their triage status or the type of physician (GP or EP) they were seeing. Both GPs and EPs were encouraged to use a designated consultation room for primary care sessions and were required to complete a consultation record form for each patient seen. Physicians were unaware how this data would be analysed. Each week, a random number table was used to select 2 to 3 daytime and 1 evening weekday sessions and 1 daytime weekend session for inclusion in the study (see Figure 2). Hence 8 to 10 sessions, which included a mix of GP and EP assignments, were selected for inclusion each week; this was done for a total of 48 weeks. Physicians were unaware of which sessions were included in the study and what outcomes were being measured. A total of 419 primary care sessions (215 GP‐ and 204 EP‐staffed sessions) were selected by stratified random sampling for inclusion in the study. Primary care sessions staffed by an EP formed the control group. The study authors noted that there was occasional cross‐over where the allocated physician did not treat primary care patients. This loss of randomisation occurred in both GP‐ and EP‐staffed sessions when the primary care session workload was excessive (to prevent unacceptable wait times) or when EPs were called away to manage urgent patients or to supervise junior physicians in the ED. The frequency and extent with which cross‐over occurred was not reported. To remedy this loss of randomisation, the study authors regrouped patients according to the type of doctor seen and used log‐linear modelling to adjust for confounding factors in their analysis. | |
| Outcomes |
| |
| Notes | Funding: Study authors funded by Lambeth Inner City Partnership and the King's Fund; SETRHA Primary Care Development provided additional funding for conducting the study. | |
| Risk of bias | ||
| Bias | Authors' judgement | Support for judgement |
| Random sequence generation (selection bias) | High risk | Quote: "General practitioners and accident and emergency medical staff were considered as two groups, and each group was allocated two or three weekday sessions running from 1000 to 1300 and 1400 to 1700, one weekday evening session from 1800 to 2100, and one weekend daytime session for each week during the study period... ...weekly rosters stipulated a named doctor with responsibility for primary care patients for every three hour session" and "a random sample of sessions stratified by time of day and day of week was determined by using a table of random numbers. ...Hence, 8‐10 sessions were sampled each week for a total of 48 weeks. The sample of sessions allocated to accident and emergency staff was the same as those described in the accompanying paper." See P.1, Col.2, Para.4. Comment: Primary care sessions selected for inclusion in study were randomly selected using a random number table, however allocation of physicians to selected sessions was not random, but depended on physician availability and scheduling. Also, since nurses performing triage knew if a GP or an EP was seeing the 'non‐urgent' cases, this could affect what type of patients the physician in charge of providing care for the 'non‐urgent' patient group actually saw (i.e. more emergency‐type patients if an EP, and less so if a GP). |
| Allocation concealment (selection bias) | High risk | Quote: "Patients were unaware of their triage status or the grade and specialty of their doctor". See P.1, Col.5, Para.5 Comment: While patients were unaware of whether they were in the intervention (GP) or control (A&E staff) groups, this did not provide adequate allocation concealment; the type of physician providing care for each primary care session was open and not concealed. Importantly, triage nurses were not blinded to the grade and speciality of the physician in charge for providing care for 'non‐urgent' patients, which could have affected the triage and therefore also what type of patients the physician actually saw (i.e. more emergency‐type patients if an EP, and less so if a GP). |
| Incomplete outcome data (attrition bias) | Low risk | Quote: "Not all records were complete" See P.2, Col.2, Para.2 Comment: Unclear whether missing data was predominantly from control or intervention group, or approximately equal across groups. Given binary outcomes and large samples, proportion of missing data probably less than effect size and low risk of bias. |
| Selective reporting (reporting bias) | Low risk | All outcomes mentioned in methods section were reported. |
| Other bias | High risk | Quote: "General practitioners worked sessions of only three hours in accident and emergency, compared with senior house officers' and registrars' shifts of up to 11 hours. Duration of shift may affect attitudes to patient care and influence the threshold of initiating referral or investigation." See P.4, Col.2, Para.1 Comments: General practitioners and EPs did not work equal numbers of hours in ED; this imbalance in experience and numbers of patients seen between providers could bias results. |
| Baseline outcome measures similar | Unclear risk | No baseline measure of outcome reported. |
| Baseline (provider) characteristics similar | Unclear risk | Quote: in recruiting GPs, "preference was given, firstly to those who had recently completed training (that is, general practitioners registered for similar numbers of years to the accident and emergency doctors) and, secondly, to those with flexible hours of availability". See P.1, Col.2, Para.3 Comment: This does not tell us what the actual provider characteristics were, only what was aimed for in the recruitment process. Also, no data are presented. |
| Baseline (patient) characteristics similar | High risk | Quote: "Two variables ‐ age and an injury related diagnosis ‐ were found to vary significantly with type of doctor seen. In addition, other variables (such as diagnosis of a mental disorder or a disease of the skin) varied significantly but had small effect sizes." See P.3, Col.2, Para.4, and Table VI. |
| Knowledge of allocated intervention adequate (Process variables) | Low risk | Unclear if outcomes were assessed blindly, but process variables (laboratory and X‐ray investigations, prescriptions, referrals, admissions) were objective. Referrals were defined in the primary author's PhD thesis as outpatient, on‐call team and hospital admissions were all counted as referrals. |
| Knowledge of allocated interventions adequate (Patient satisfaction, health status) | Unclear risk | Questionnaires were administered by standardised telephone interview or post within 7 to 10 days of patients' index visit: "We interviewed the patients again 7‐10 days later by telephone (or sent them a postal questionnaire if they lacked a telephone) about their satisfaction with their assessment and treatment in the department, the extent of their recovery, and the health care they required after attending the department. Responses to questions of satisfaction were recorded on five point Likert scales, ranging from very satisfied to very dissatisfied." See P.1, Col.2, Para.3 (Dale 1996). Comment: Self reported data and unvalidated questionnaire (as per Dale thesis, no validated questionnaires were available at time of study). Unclear if interviewer was blinded |
| Blinding of participants and personnel (performance bias) | Low risk | Quote: "Neither the general practitioners nor the accident and emergency doctors or nurses were informed about the study objectives or whether any particular session was part of the study sample." See P.1, Col.2, Para.4 "Patients were unaware of their triage status or the grade and speciality of their doctor." See P.427, Col.2, Para.5 Comments: All personnel (GPs, EPs, and nurses) were blinded to the study objectives and whether any particular session was part of the study sample, and the patients were unaware which type of doctor they were seen by. |
| Blinding of outcome assessment (detection bias) (Process variables) | Low risk | Quote: "All doctors...were asked to complete a consultation record form for each patient seen...Doctors remained blind to how data from these forms would be analysed." See P.2, Col.1, Para.3 Comments: Outcomes were objective, and physicians were unaware of what data were being collected for the study. It is unclear if researchers knew which physician saw patients. |
| Blinding of outcome assessment (detection bias) (Patient satisfaction, health status). | Unclear risk | Unclear if outcome assessors for patient satisfaction and health status were blinded |
| Adequately protected against contamination | High risk | Quote: "Although the intention was that all primary care patients would be treated by the allocated doctor, this did not always occur. Firstly, at times when the primary care workload was excessive, other doctors were directed by the nurse performing triage to treat primary care patients to prevent unacceptably long waiting periods from occurring; secondly, registrars in particular were often interrupted from completing primary care sessions by departmental circumstances (such as responding to patients with urgent or life threatening needs or providing advice or supervision to senior house officers). Hence patients were sometimes attended by a non‐allocated doctor, both during sessions originally allocated to a general practitioner and during those allocated to another member of accident and emergency staff." See P.2, Col.1, Para.2 "Since this breakdown of randomisation was not always clearly documented, data for all recorded primary care consultations occurring during the selected sessions were included in the sample, and data on patients were regrouped according to the type of doctor actually seen. The loss of randomisation was allowed for by including confounding factors in the analysis of the data." See P.2, Col.1, Para.2 |
| Methods | Design: non‐randomised trial Time: March 1996 to September 1996 Duration: 7 months Triage: patients categorised by receptionists with no formal training into "urgent" and "non‐urgent" Data collection: Process data were collected from a review of written patient records. | |
| Participants | Intervention group: N = 3 GPs Control group: N = 8 EPs (1 consultant, 2 registrars, 5 senior house officers) Provider characteristics: none reported Patients: all "non‐urgent" and non‐ambulance patients attending the ED; ambulance patients were excluded Total number of patients: N = 1878; intervention group: n = 771 patients seen by GPs; control group: n = 1107 patients seen by EPs Patient characteristics: data no longer available Setting: Hospital: one, James Connolly Memorial Hospital Country: Ireland Hospital characteristics (1996 figures): Beds: 336, small district hospital, urban/rural mix Yearly attendance: 25,047 Yearly re‐attendance: 8213 | |
| Interventions | Intervention: sessional GPs providing care for non‐urgent patients in the ED Control: regularly scheduled EPs providing care for non‐urgent patients in the ED (when GP present at the ED) Patients referred by GPs included. Conducted March to September 1996 (7 months). This study was designed by the same author‐group as Murphy 1996. 3 GPs were hired by the hospital to work on a sessional basis. The frequency and duration of GP sessions in the ED were not reported. As in the Murphy 1996 study, non‐urgent patients were allocated to either a GP or an EP in alternating (but not random or consecutive) order according to time of registration. Triage status did not factor into the order in which patients were seen, as only two triage categories were used: "urgent" and "non‐urgent". As in Murphy 1996, the control group comprised non‐urgent patients seen by EPs when a GP was on‐site. | |
| Outcomes |
| |
| Notes | Funding: not reported | |
| Risk of bias | ||
| Bias | Authors' judgement | Support for judgement |
| Random sequence generation (selection bias) | High risk | Quote: Allocation of patients "to either GP or A&E staff was the same as our previous study (Murphy 1996) and was performed according to time of registration." See P.1, Col.2, Para.5. Comment: Sequence generation was non‐random; patients were seen in temporal order, and allocation to provider was not necessarily consecutive, depending on the length of previous consultations. |
| Allocation concealment (selection bias) | High risk | Quote: "An unstructured receptionist‐based triage system divides all non‐ambulance patients into two categories: 'urgent' and 'non‐urgent'." See P.1, Col.2, Para.3. Comment: Patient allocation occurred as individuals entered the study (by attending the ED). It is unclear how physician allocation to primary care sessions was performed. It is not specified whether nurses performing triage were blinded; nurses' knowledge of whether a GP or an EP was working could have affected triage and the type of patients that physician working in primary care sessions saw (i.e. more emergency‐type patients if an EP, and less so if a GP). |
| Incomplete outcome data (attrition bias) | Unclear risk | Not specified in the paper |
| Selective reporting (reporting bias) | High risk | All outcomes mentioned in the text were reported in the results, however the study was designed and carried out by same author‐group as Murphy 1996, and fewer outcomes are reported without explanation. |
| Other bias | Unclear risk | It is probable that GPs and EPs did not work equal numbers of hours in the ED; this imbalance between providers in experience and numbers of patients seen could bias the results. |
| Baseline outcome measures similar | Unclear risk | No baseline measure of outcome reported. |
| Baseline (provider) characteristics similar | Unclear risk | No provider characteristics reported. |
| Baseline (patient) characteristics similar | Unclear risk | Quote: "There were no differences in age, sex, socio‐economic status, registration with a GP or type of presenting complaint between patients seen by a GP or usual A&E staff." See P.1, Col.2, Para.6. Comment: No data on patient characteristics were reported, hence we cannot corroborate that the patient groups seen by GPs or EPs were comparable in terms of duration of complaints, diagnoses, etc. |
| Knowledge of allocated intervention adequate (Process variables) | Low risk | The outcomes are objective. |
| Knowledge of allocated interventions adequate (Patient satisfaction, health status) | Unclear risk | Not specified in the paper |
| Blinding of participants and personnel (performance bias) | Unclear risk | Not specified in the paper |
| Blinding of outcome assessment (detection bias) (Process variables) | Unclear risk | Unclear if outcomes were assessed blindly, but process variables (laboratory and X‐ray investigations, prescriptions, admissions) were objective. A definition of what constituted referrals in the study was not provided; if only some types of referrals (e.g. to on‐call physicians) were counted, this would not objectively account for the total referrals made (e.g. to non‐physician health professionals) by both intervention and control groups. |
| Blinding of outcome assessment (detection bias) (Patient satisfaction, health status). | Unclear risk | Not specified in the paper |
| Adequately protected against contamination | High risk | Quote: "Study enrolment only occurred when both GPs and usual A&E staff were on duty together." See P.1, Col.2, Para.5. Comments: General practitioners and EPs worked simultaneously in primary care sessions, and overlap and contamination between groups was possible. |
| Methods | Design: pragmatic randomised trial Time: first participant enrolled February 2014 Duration: not described Triage: participants triaged by trained nurses using the Australasian Triage Scale Data collection: baseline data collected from all consenting participants during enrolment. Pain score reduction reported by the participant, all other outcomes collected from the ED patient information system and electronic health record. | |
| Participants | Intervention group: N = 9 emergency NPs Control group: N = 17 emergency medicine registrars Years of postgraduate training (minimum): 3 years Patients: all patients presenting to the ED with "pain" and allocated to the "fast‐track" zone Total number of patients: intervention: 130; control: 128 Patient characteristics: Sex: intervention: 47% female; control: 39% female Age (median): intervention: 33 years; control: 30 years Pain score (median): intervention: 5; control: 5 Setting: Hospital: one, adult tertiary ED Country: Australia ED characteristics (2013 figures): Major urban teaching hospital Yearly attendance: 65,000 | |
| Interventions | Intervention: People presenting with pain, who were triaged to fast‐track area (Australasian Triage Scale 2 to 5), were randomly assigned to receive either standard ED medical care or emergency NP care. Control: Care was provided by medical officers with assistance from registered nurses, if required. | |
| Outcomes | Primary outcomes: pain score reduction and time to analgesia Secondary outcomes: waiting time, number of patients who did not wait, length of stay in ED, re‐presentations with 48 hours Integrity of the intervention measured through clinicians' use of evidence‐based guidelines for management of knee, ankle, and burns injury. (Outcomes as per the published protocol.) | |
| Notes | Funding: National Health and Medical Research Council postgraduate scholarship through Queensland University of Technology, Australia (principal investigator) | |
| Risk of bias | ||
| Bias | Authors' judgement | Support for judgement |
| Random sequence generation (selection bias) | Low risk | "Randomization was performed with an allocation sequence of four and generated by computer random number generator and then transcribed into opaque sequentially numbered sealed envelopes" (p.775) |
| Allocation concealment (selection bias) | Unclear risk | "Each envelope contained a card with the allocation group recorded and treatment pack. Allocation adhered strictly to the generated sequence and was maintained. Both participants and treating staff were aware of treatment allocation." (p.775) |
| Incomplete outcome data (attrition bias) | Low risk | No participants lost to follow‐up; 2 participants allocated to intervention excluded from analysis as consent forms not signed (0.02%). |
| Selective reporting (reporting bias) | Low risk | All outcomes specified in the protocol published (primary and secondary outcomes reported separately). |
| Other bias | Low risk | No other risk detected. |
| Baseline outcome measures similar | Low risk | Clinical research assistants used an examination cubicle to recruit and consent patients and collect baseline demographic information. |
| Baseline (provider) characteristics similar | Unclear risk | Not described |
| Baseline (patient) characteristics similar | Low risk | Little or no differences between groups (Table 1) |
| Knowledge of allocated intervention adequate (Process variables) | Low risk | Most outcomes are objective. |
| Knowledge of allocated interventions adequate (Patient satisfaction, health status) | Low risk | Not applicable, not outcomes for this study |
| Blinding of participants and personnel (performance bias) | Unclear risk | Not enough information to ascertain risk of bias |
| Blinding of outcome assessment (detection bias) (Process variables) | Low risk | Primary investigators were blinded to treatment allocation for data analyses. Most outcomes were objective. |
| Blinding of outcome assessment (detection bias) (Patient satisfaction, health status). | Low risk | Not applicable, not outcomes for this study |
| Adequately protected against contamination | Unclear risk | Not enough information to ascertain risk of bias. Both medical officers and NPs worked in fast‐track area at overlapping times. |
| Methods | Design: non‐randomised study Time: August 1993 to October 1994 Duration: 15 months Triage: Patients triaged by trained nurses based on physiological criteria as (1) life‐threatening, (2) urgent, (3) semi‐urgent, or (4) delay acceptable. Data collection: Process information (investigations, referrals, prescriptions, etc.) was collected from hospital records. The numbers of patients re‐attending the ED within 1 month of the index visit was determined using the hospital's mainframe computer. Patient satisfaction was assessed immediately by a blinded interviewer using the consultation satisfaction questionnaire. Health status was determined 1 month after the initial consultation by means of a simple questionnaire (4 questions) completed by telephone or letter. Marginal (materials and disposables) and total (marginal plus all staff) costs were determined in conjunction with the hospital's finance department and X‐ray and laboratory staff. Costs were calculated for the following: full blood counts; measurements of blood urea and plasma electrolyte concentrations, plasma glucose concentration, and serum amylase activity; sequential multiple analysis with computer (SMAC); and chest, limb, skull, spine, and abdominal radiographs. Based on the hospital admission profile, an estimate of the average cost per admission was also obtained. | |
| Participants | Intervention group: N = 5 GPs Age (median): 32 years Years since registration (median): 7 years Control group: N = 13 EPs (1 consultant, 2 registrars, 10 senior house officers) Age (median): 26 years Patients: new ED attendees triaged as "semi‐urgent" or "delay acceptable" Total number of patients: N = 4684; intervention group: n = 2303 patients seen by GPs; control group: n = 2381 patients seen by EPs Patient characteristics: Sex: 41.4% female Age: median 28 to 34 years Years since registration (median): 6 months Duration of complaints: 44% problems > 24 hours; 92.6% registered with GPs (unclear how many saw GP prior to attending) Most common diagnoses: musculoskeletal (50.9%), skin complaints (19.0%), and neurological (8.8%) Setting: Hospital: one, St James' Hospital Country: Ireland Hospital characteristics (1992 figures): Beds: 490, catchment 219,300 people Major teaching hospital Yearly attendance: 40,159 Yearly re‐attendance: 7589 | |
| Interventions | Intervention: sessional GPs providing care for non‐urgent patients at hospital ED Control: regularly scheduled EPs providing care for non‐urgent patients when GP present in department Patients referred by GPs (20%) were excluded. The study took place between August 1993 and October 1994 (15 months). 3 GPs were hired to work two 4‐hour shifts each week alongside EPs. During these primary care shifts, non‐urgent patients were allocated to either the GP or EP according to registration time. The control group comprised non‐urgent patients seen by EPs when a GP was on‐site. The allocation of patients was predictable but not necessarily consecutive, as the order in which patients were allocated depended on the length of consultations. In addition to temporal ordering, patients were also ordered by triage category: triage category 3 patients were seen prior to category 4. The GPs and EPs in this study had access to all of the same ED facilities, and patients were unaware what type of physician was treating them. | |
| Outcomes |
| |
| Notes | Funding: Department of Health through the General Practice Unit of the Eastern Health Board | |
| Risk of bias | ||
| Bias | Authors' judgement | Support for judgement |
| Random sequence generation (selection bias) | High risk | Quote: "Randomisation of patients to the general practitioner or accident and emergency staff depended on time of registration. Once patients were registered their charts were divided according to triage category on to four separate shelves and then placed in line by strict temporal order. Doctors took the first chart on the triage 3 shelf and continued doing so until the shelf was empty. They then moved to the triage 4 shelf." See P.2, Col.1, Para.3 Comment: Sequence generation was non‐random; patients were seen in temporal order, and allocation to provider was not necessarily consecutive, depending on the length of previous consultations. Although a research nurse was employed to ensure adherence to the temporal order, this open allocation method could be problematic if the triage information recorded on chart influences physician's choice to accept or reject a patient (by waiting for the other physician to take the top chart). For example, GPs investigated fewer semi‐urgent (triage 3) and more delay‐acceptable (triage 4) patients than EPs. See P.3, Table 1:
|
| Allocation concealment (selection bias) | Unclear risk | Quote: "General practitioners...were dressed similarly to the usual staff and patients were unaware that they were being seen by a general practitioner" See P.2, Col.1, Para.2‐3 Comment: Patient allocation occurred as individuals entered the study (by attending the ED) and was carried out by a study researcher and enforced by the triage nursing team. It is unclear whether the same person conducted both steps of the randomisation process. Physicians were not blinded to the triage category of the patients being seen, however patients were probably unaware of the type of physician treating them. It is unclear how physician allocation to primary care sessions was performed. |
| Incomplete outcome data (attrition bias) | Low risk | Quote: "The hospital's computer could not locate 83 (2%) of the 4684 patients enrolled in the study. Thirty three had been seen by the general practitioners and fifty by the usual accident and emergency staff." See P.4, Col.2, Para.4 Comment: There were similar numbers of missing records across the 2 groups, and a relatively small portion of data was missing, hence probably low risk of bias. |
| Selective reporting (reporting bias) | Low risk | All outcomes mentioned in the text were reported in the results. |
| Other bias | Unclear risk | Quote: Each GP "worked two four hour sessions a week, managing non‐emergency patients". See P.2, Col.1, Para.2. General practitioners and EPs did not work equal numbers of hours in the ED; this imbalance between providers in experience and numbers of patients seen could bias the results. |
| Baseline outcome measures similar | Unclear risk | No baseline measure of outcome reported. |
| Baseline (provider) characteristics similar | High risk | The median age and time since registration were not equal between GPs and EPs. The median age of the 5 GPs employed during the project was 32 years, compared with 26 years for EPs. Similarly, the median time since full registration was 7 years for GPs and 6 months for EPs. See P.3, Col.2, Para.3 This difference in experience between the groups could bias the study outcomes. |
| Baseline (patient) characteristics similar | High risk | Quote: "There were significant differences (in presenting complaints)....between (triage 3) patients seen by the general practitioners and those seen by the usual accident and emergency staff". See P.4, Table 3. "There were no differences between triage 4 patients seen by general practitioners and those seen by the usual accident and emergency staff". See P.3, Col.2, Para.5 Comment: High risk of bias because patient diagnoses in control and intervention groups were not equal. |
| Knowledge of allocated intervention adequate (Process variables) | Low risk | Unclear if outcomes were assessed blindly, but process variables (laboratory and X‐ray investigations, prescriptions, referrals, admissions) were objective. (Referrals were "when a second doctor was formally requested to review a patient and did so". P.2, Col.2, Para.2) |
| Knowledge of allocated interventions adequate (Patient satisfaction, health status) | Unclear risk | Quote: "Patient satisfaction was assessed immediately by a blinded interviewer using the consultation satisfaction questionnaire." See P.2, Col.2, Para.4 "Health status was determined after one month by means of a simple questionnaire completed by telephone or letter". Patient satisfaction was assessed blindly. Unclear if health status was assessed blindly. See P.2, Col.2, Para.4 Comment: Self reported data, and unclear if questionnaires were validated or if health status was assessed blindly. |
| Blinding of participants and personnel (performance bias) | Unclear risk | Quote: "General practitioners...had access to the same facilities as the usual medical staff. They were dressed similarly to the usual staff and patients were unaware that they were being seen by a general practitioner". Comment: Patients were unaware of which type of physician they were seeing. It is unclear whether medical practitioners were aware of the study objectives. Knowledge of study objectives may have affected performance (e.g. consciously choosing to order fewer investigations or make more referrals to the community rather than to a second doctor). |
| Blinding of outcome assessment (detection bias) (Process variables) | Unclear risk | It is unclear if outcomes were assessed blindly, but most process measures were objective items such as the number of investigations ordered, prescriptions given, and admissions made. Referrals were only counted in the study if "a second doctor was formally requested to review a patient and did so" (See P.2, Col.2, Para.1). Hence any referrals to community or non‐physician healthcare providers (e.g. community nurses, social workers, mental health professionals) were excluded, and detection bias could have been introduced if physicians were aware of the study definition or outcome; we therefore judged the risk of bias as unclear. |
| Blinding of outcome assessment (detection bias) (Patient satisfaction, health status). | Unclear risk | Quotes: "Patient satisfaction was assessed immediately by a blinded interviewer using the consultation satisfaction questionnaire." See P.2, Col.2, Para.4 "Health status was determined after one month by means of a simple questionnaire completed by telephone or letter". See P.2, Col.2, Para.4 Comment: Satisfaction assessment was blinded, but it is unclear if health status assessments were blinded. |
| Adequately protected against contamination | Unclear risk | Unclear. General practitioners and EPs worked simultaneously in primary care sessions, and overlap and contamination between groups was possible. See P.2, Col.2, Para.2, 4‐6 |
A&E: accident & emergency department; ECG: electrocardiogram; ED: emergency department; EPs: emergency physicians; GPs: general practitioners; NPs: nurse practitioners
Characteristics of excluded studies [ordered by study ID]
Ir a:
| Study | Reason for exclusion |
| Uncontrolled before‐after study | |
| Uncontrolled before‐after study | |
| No effectiveness data; satisfaction is the only outcome | |
| Ineligible intervention: GPs were located in out‐of‐hospital co‐operatives rather than ED | |
| Ineligible intervention: establishment of a fast‐track unit staffed by emergency staff | |
| Ineligible study design | |
| Non‐randomised study comparing period with GP to period without GP (no pre‐intervention data) | |
| Uncontrolled before‐after study | |
| Nurse practitioners had additional training for specific minor illnesses. | |
| Ineligible professional group (pharmacists) | |
| Compares physician assistants and GPs | |
| Ineligible intervention | |
| Ineligible professional group (emergency care practitioner) | |
| No effectiveness data; satisfaction is the only outcome | |
| Ineligible intervention: nurses who already worked in ED, not PC | |
| Ineligible study design | |
| Ineligible intervention: addition of a "broad‐scope" NP to the ED team, but no comparison with care provided by a PC professional | |
| Uncontrolled before‐after study | |
| Compares NPs to GPs, no EPs | |
| Compares ENPs and EPs, no PC professionals |
ED: emergency department; ENP: emergency nurse practitioner; EP: emergency physician; GP: general practitioner; NP: nurse practitioner; PC: primary care
Data and analyses
| Outcome or subgroup title | No. of studies | No. of participants | Statistical method | Effect size |
| 1 Admission to hospital Show forest plot | 3 | Risk Ratio (M‐H, Random, 95% CI) | Totals not selected | |
| Analysis 1.1  Comparison 1 Comparions of general practitioners versus emergency physicians, Outcome 1 Admission to hospital. | ||||
| 2 Diagnostic tests: all investigations Show forest plot | 2 | Risk Ratio (M‐H, Random, 95% CI) | Totals not selected | |
| Analysis 1.2  Comparison 1 Comparions of general practitioners versus emergency physicians, Outcome 2 Diagnostic tests: all investigations. | ||||
| 3 Diagnostic tests: laboratory investigations Show forest plot | 3 | Risk Ratio (M‐H, Random, 95% CI) | Totals not selected | |
| Analysis 1.3  Comparison 1 Comparions of general practitioners versus emergency physicians, Outcome 3 Diagnostic tests: laboratory investigations. | ||||
| 4 Diagnostic tests: imaging results Show forest plot | 3 | Risk Ratio (M‐H, Random, 95% CI) | Totals not selected | |
| Analysis 1.4 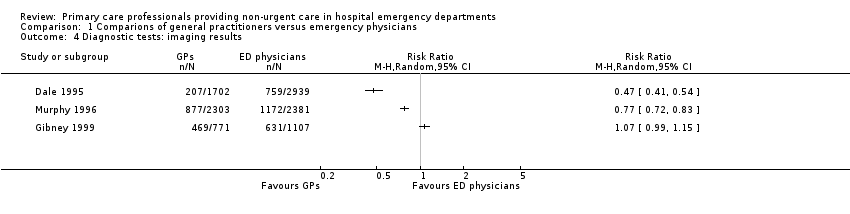 Comparison 1 Comparions of general practitioners versus emergency physicians, Outcome 4 Diagnostic tests: imaging results. | ||||
| 5 Treatments given: any prescription Show forest plot | 3 | Risk Ratio (M‐H, Random, 95% CI) | Totals not selected | |
| Analysis 1.5  Comparison 1 Comparions of general practitioners versus emergency physicians, Outcome 5 Treatments given: any prescription. | ||||
| 6 Consultations or referrals to hospital‐based specialists Show forest plot | 3 | Risk Ratio (M‐H, Random, 95% CI) | Totals not selected | |
| Analysis 1.6  Comparison 1 Comparions of general practitioners versus emergency physicians, Outcome 6 Consultations or referrals to hospital‐based specialists. | ||||
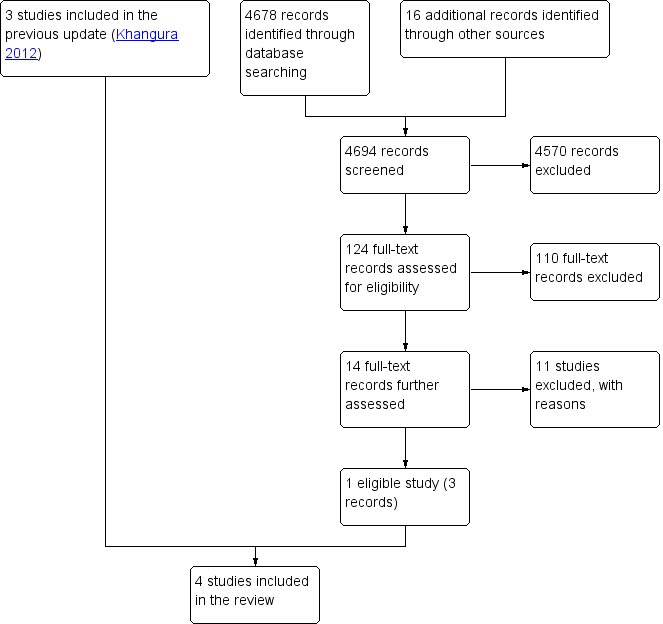
Study flow diagram.

Risk of bias graph: review authors' judgements about each risk of bias item presented as percentages across all included studies.

Risk of bias summary: review authors' judgements about each risk of bias item for each included study.
Forest plot of comparison: 1 Comparisons of general practitioners versus emergency physicians, outcome: 1.1 Admissions.

Forest plot of comparison: 1 Comparisons of general practitioners versus emergency physicians, outcome: 1.2 All investigations.

Forest plot of comparison: 1 Comparisons of general practitioners versus emergency physicians, outcome: 1.3 Laboratory investigations.
Forest plot of comparison: 1 Comparisons of general practitioners versus emergency physicians, outcome: 1.4 Imaging results.

Forest plot of comparison: 1 Comparisons of general practitioners versus emergency physicians, outcome: 1.5 Any prescription.

Forest plot of comparison: 1 Comparisons of general practitioners versus emergency physicians, outcome: 1.6 Referrals.

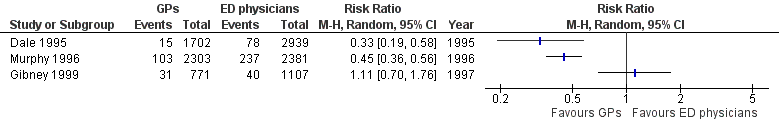
Comparison 1 Comparions of general practitioners versus emergency physicians, Outcome 1 Admission to hospital.
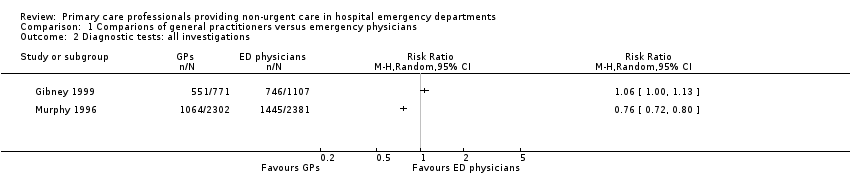
Comparison 1 Comparions of general practitioners versus emergency physicians, Outcome 2 Diagnostic tests: all investigations.

Comparison 1 Comparions of general practitioners versus emergency physicians, Outcome 3 Diagnostic tests: laboratory investigations.

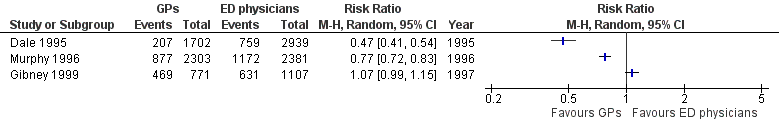
Comparison 1 Comparions of general practitioners versus emergency physicians, Outcome 4 Diagnostic tests: imaging results.

Comparison 1 Comparions of general practitioners versus emergency physicians, Outcome 5 Treatments given: any prescription.
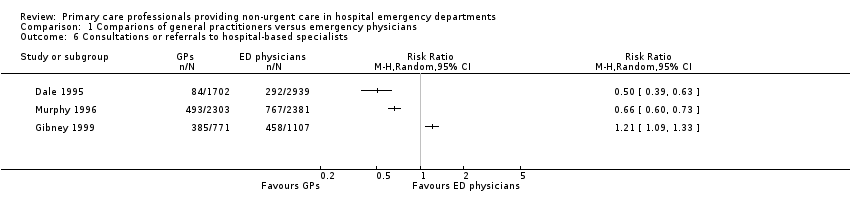
Comparison 1 Comparions of general practitioners versus emergency physicians, Outcome 6 Consultations or referrals to hospital‐based specialists.
| Primary care professionals compared with ordinary emergency department physicians for patients with minor injuries and illnesses who attend hospital emergency departments | ||||
| Patient or population: patients with minor injuries and illnesses Settings: hospital emergency departments (Ireland, UK, Australia) Intervention: primary care professionals Comparison: ordinary emergency department physicians | ||||
| Outcomes | Relative effect | No. of participants | Certainty of the evidence | Comments |
| Time from arrival to clinical assessment and treatment | MD 2.1 minutes (95% CI ‐4.9 to 9.2) | 260 (1 study) | ⊕⊝⊝⊝1,2 very low | Expressed in minutes Follow‐up not reported. |
| Total length of ED stay | MD ‐3.2 minutes (95% CI ‐20.2 to 13.8) | 260 (1 study) | ⊕⊝⊝⊝1,2 very low | Expressed in minutes Follow‐up not reported. |
| Admission to hospital | RR ranged from 0.33 to 1.11 | 11,203 | ⊕⊝⊝⊝ | Percentage of patients admitted to hospital from ED |
| Diagnostic tests | RR ranged from 0.35 to 0.96 (laboratory investigations) RR ranged from 0.47 to 1.07 (imaging results) | 11,203 | ⊕⊝⊝⊝ | Percentage of patients for whom any blood investigation or imaging results were ordered |
| Treatments given | RR ranged from 0.95 to 1.45 (any prescription) | 11,203 | ⊕⊝⊝⊝ | Percentage of patients given medication or prescription |
| Consultations or referrals to hospital‐based specialists | RR ranged from 0.5 to 1.21 | 11,203 | ⊕⊝⊝⊝ | Percentage of patients referred to consultants In Dale 1995, patients referred to on‐call teams were excluded. |
| Costs | Cost reduction associated with the intervention ranged from GBP 60,876 to IEP 95,125. | 9325 (2 studies) | ⊕⊝⊝⊝4,6 | Cost in GBP excludes hospital admissions; it is unclear whether cost in IEP includes or excludes hospital admissions. |
| Adverse events | ‐ | ‐ | ‐ | We did not find any study reporting on adverse events. |
| CI: confidence interval; ED: emergency department; MD: mean difference; RR: risk ratio GRADE Working Group grades of evidence | ||||
| 1We downgraded the evidence due to indirectness. | ||||
| (N = 4641) | (N = 4684) | (N = 1878) | |
| Laboratory investigations ordered | RR 0.22, 95% CI 0.14 to 0.33 | RR 0.35, 95% CI 0.29 to 0.42 | RR 0.96, 95% CI 0.76 to 1.2 |
| X‐rays ordered | RR 0.47, 95% CI 0.41 to 0.54 | RR 0.77, 95% CI 0.72 to 0.83 | RR 1.07, 95% CI 0.99 to 1.15 |
| Admissions | RR 0.33, 95% CI 0.19 to 0.58 | RR 0.45, 95% CI 0.36 to 0.56 | RR 1.11, 95% CI 0.70 to 1.76 |
| Referrals to specialists | RR 0.50, 95% CI 0.39 to 0.63 | RR 0.66, 95% CI 0.60 to 0.73 | RR 1.21, 95% CI 1.09 to 1.33 |
| Prescriptions | RR 0.95, 95% CI 0.88 to 1.03 | RR 1.45, 95% CI 1.35 to 1.56 | RR 1.12, 95% CI 1.01 to 1.23 |
| CI: confidence interval; RR: risk ratio | |||
| Outcome or subgroup title | No. of studies | No. of participants | Statistical method | Effect size |
| 1 Admission to hospital Show forest plot | 3 | Risk Ratio (M‐H, Random, 95% CI) | Totals not selected | |
| 2 Diagnostic tests: all investigations Show forest plot | 2 | Risk Ratio (M‐H, Random, 95% CI) | Totals not selected | |
| 3 Diagnostic tests: laboratory investigations Show forest plot | 3 | Risk Ratio (M‐H, Random, 95% CI) | Totals not selected | |
| 4 Diagnostic tests: imaging results Show forest plot | 3 | Risk Ratio (M‐H, Random, 95% CI) | Totals not selected | |
| 5 Treatments given: any prescription Show forest plot | 3 | Risk Ratio (M‐H, Random, 95% CI) | Totals not selected | |
| 6 Consultations or referrals to hospital‐based specialists Show forest plot | 3 | Risk Ratio (M‐H, Random, 95% CI) | Totals not selected | |