Infusión intravenosa de midazolam para sedar a niños en la unidad de cuidados intensivos neonatales
Appendices
Appendix 1. Standard search method
PubMed: ((infant, newborn[MeSH] OR newborn OR neonate OR neonatal OR premature OR low birth weight OR VLBW OR LBW or infan* or neonat*) AND (randomized controlled trial [pt] OR controlled clinical trial [pt] OR Clinical Trial[ptyp] OR randomized [tiab] OR placebo [tiab] OR clinical trials as topic [mesh: noexp] OR randomly [tiab] OR trial [ti]) NOT (animals [mh] NOT humans [mh]))
Embase: (infant, newborn or newborn or neonate or neonatal or premature or very low birth weight or low birth weight or VLBW or LBW or Newborn or infan* or neonat*) AND (human not animal) AND (randomized controlled trial or controlled clinical trial or randomized or placebo or clinical trials as topic or randomly or trial or clinical trial)
CINAHL: (infant, newborn OR newborn OR neonate OR neonatal OR premature OR low birth weight OR VLBW OR LBW or Newborn or infan* or neonat*) AND (randomized controlled trial OR controlled clinical trial OR randomized OR placebo OR clinical trials as topic OR randomly OR trial OR PT clinical trial)
Cochrane Library: (infant or newborn or neonate or neonatal or premature or very low birth weight or low birth weight or VLBW or LBW)
Appendix 2. Risk of bias tool
The following issues were evaluated and entered into the risk of bias table.
1. Sequence generation (checking for possible selection bias). Was the allocation sequence adequately generated?
For each included study, we categorised the method used to generate the allocation sequence as:
-
low risk (any truly random process, e.g. random number table; computer random number generator);
-
high risk (any non‐random process, e.g. odd or even date of birth; hospital or clinic record number); or
-
unclear risk.
2. Allocation concealment (checking for possible selection bias). Was allocation adequately concealed?
For each included study, we categorised the method used to conceal the allocation sequence as:
-
low risk (e.g. telephone or central randomisation; consecutively numbered sealed opaque envelopes);
-
high risk (open random allocation; unsealed or non‐opaque envelopes, alternation; date of birth); or
-
unclear risk.
3. Blinding (checking for possible performance bias). Was knowledge of the allocated intervention adequately prevented during the study? At study entry? At the time of outcome assessment?
For each included study, we categorised the method used to blind study participants and personnel from knowledge of which intervention a participant received. Blinding was assessed separately for different outcomes or classes of outcomes. We categorised the methods as:
-
low risk, high risk or unclear risk for participants;
-
low risk, high risk or unclear risk for personnel; and
-
low risk, high risk or unclear risk for outcome assessors.
4. Incomplete outcome data (checking for possible attrition bias through withdrawals, drop‐outs, protocol deviations). Were incomplete outcome data adequately addressed?
For each included study and for each outcome, we described the completeness of data including attrition and exclusions from the analysis. We noted whether attrition and exclusions were reported, numbers included in the analysis at each stage (compared with the total number of randomised participants), reasons for attrition or exclusion where reported and whether missing data were balanced across groups or were related to outcomes. When sufficient information was reported or supplied by trial authors, we reincluded missing data in the analyses. We categorised the methods as:
-
low risk (< 20% missing data);
-
high risk (≥ 20% missing data); or
-
unclear risk.
5. Selective reporting bias. Are reports of the study free of suggestion of selective outcome reporting?
For each included study, we described how we investigated the possibility of selective outcome reporting bias and what we found. We assessed the methods as:
-
low risk (when it is clear that all of the study’s prespecified outcomes and all expected outcomes of interest to the review have been reported);
-
high risk (when not all of the study’s prespecified outcomes have been reported; when one or more reported primary outcomes that were not prespecified outcomes of interest are reported incompletely and so cannot be used; when study fails to include results of a key outcome that would have been expected to have been reported); or
-
unclear risk.
6. Other sources of bias. Was the study apparently free of other problems that could put it at high risk of bias?
For each included study, we described any important concerns that we had about other possible sources of bias (e.g. whether a potential source of bias was related to the specific study design, whether the trial was stopped early owing to some data‐dependent process). We assessed whether each study was free of other problems that could put it at risk of bias as:
-
low risk;
-
high risk; or
-
unclear risk.
If needed, we planned to explore the impact of the level of bias by undertaking sensitivity analyses.
Appendix 3. Quality of the evidence assessment
In cases where we considered the risk of bias arising from inadequate concealment of allocation, randomised assignment, complete follow‐up or blinded outcome assessment to reduce our confidence in the effect estimates, we downgraded the quality of evidence accordingly. We evaluated consistency via similarity of point estimates, extent of overlap of confidence intervals and statistical criteria including measurement of heterogeneity (I²). We downgraded the quality of evidence when large and unexplained inconsistency was present across study results (i.e. some studies suggest important benefit and others no effect or harm without a clinical explanation). We assessed precision according to the 95% confidence interval (CI) around the pooled estimation. When trials were conducted in populations other than the target population, we downgraded the quality of evidence because of indirectness.

Study flow diagram: review update.

Risk of bias graph: review authors' judgements about each risk of bias item presented as percentages across all included studies.
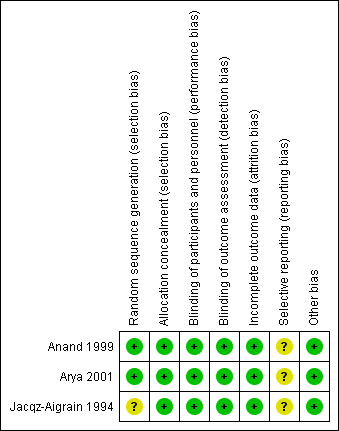
Risk of bias summary: review authors' judgements about each risk of bias item for each included study.

Forest plot of comparison: 1 Midazolam versus placebo, outcome: 1.6 Length of NICU stay (days).

Forest plot of comparison: 1 Midazolam versus placebo, outcome: 1.9 PIPP score during drug infusion.
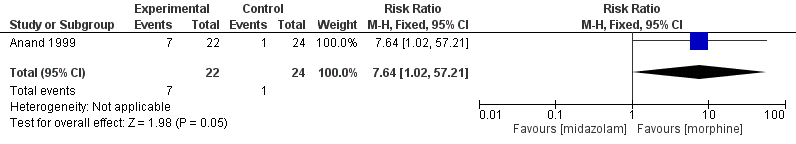
Forest plot of comparison: 2 Midazolam versus morphine, outcome: 2.2 Poor neurological outcome up to 28 days' postnatal age.
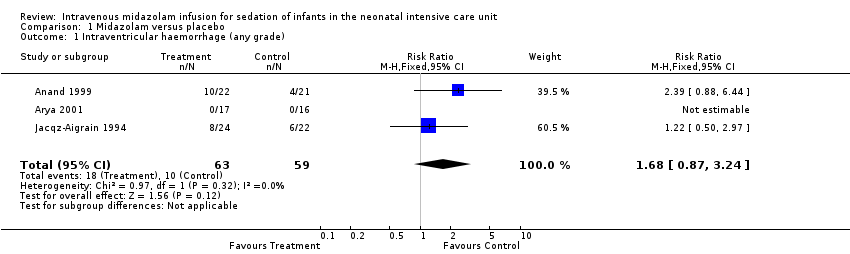
Comparison 1 Midazolam versus placebo, Outcome 1 Intraventricular haemorrhage (any grade).
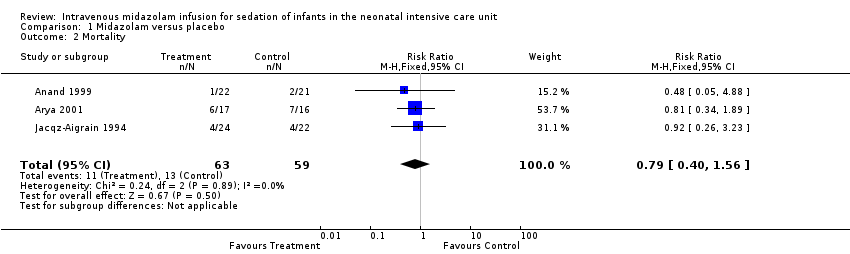
Comparison 1 Midazolam versus placebo, Outcome 2 Mortality.

Comparison 1 Midazolam versus placebo, Outcome 3 Days of ventilation.
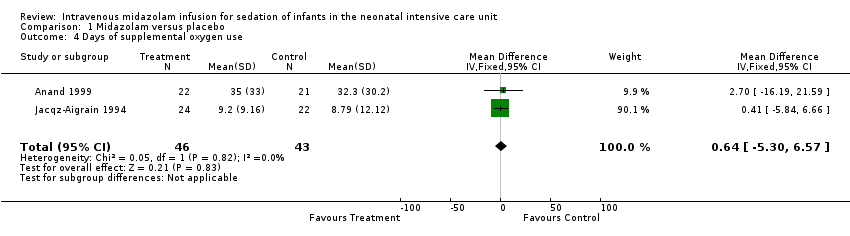
Comparison 1 Midazolam versus placebo, Outcome 4 Days of supplemental oxygen use.
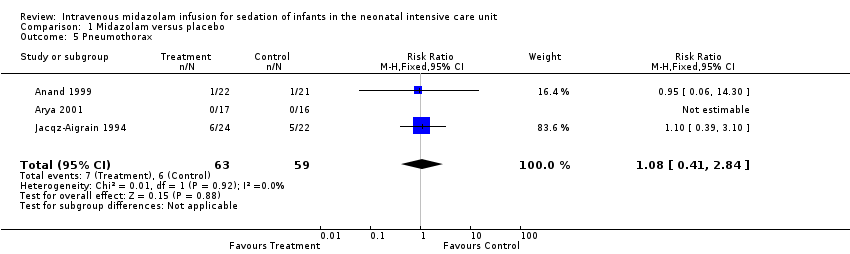
Comparison 1 Midazolam versus placebo, Outcome 5 Pneumothorax.

Comparison 1 Midazolam versus placebo, Outcome 6 Length of NICU stay (days).
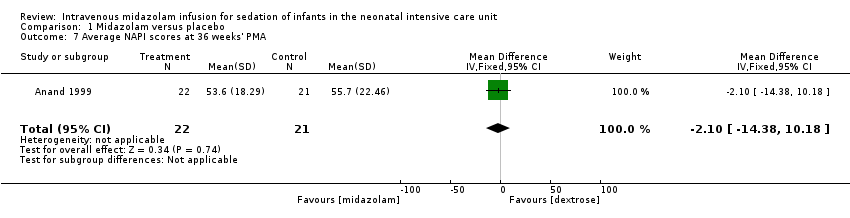
Comparison 1 Midazolam versus placebo, Outcome 7 Average NAPI scores at 36 weeks' PMA.
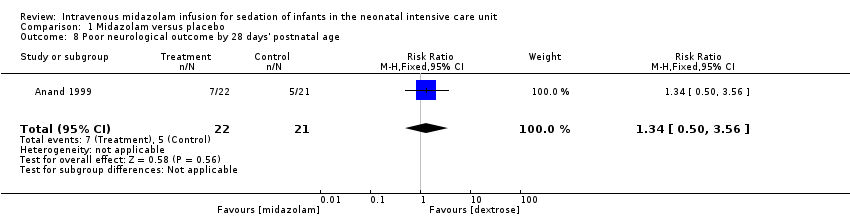
Comparison 1 Midazolam versus placebo, Outcome 8 Poor neurological outcome by 28 days' postnatal age.

Comparison 1 Midazolam versus placebo, Outcome 9 PIPP score during drug infusion.

Comparison 2 Midazolam versus morphine, Outcome 1 PIPP score during drug infusion.

Comparison 2 Midazolam versus morphine, Outcome 2 Poor neurological outcome up to 28 days' postnatal age.
| Midazolam infusion compared with placebo for sedation in neonates | ||||||
| Patient or population: neonates requiring intubation and ventilation Setting: neonatal intensive care unit Intervention: midazolam infusion Comparison: placebo infusion | ||||||
| Outcomes | Illustrative comparative risks* (95% CI) | Relative effect | Number of participants | Quality of the evidence | Comments | |
| Assumed risk | Corresponding risk | |||||
| Placebo | Midazolam | |||||
| Mortality during hospital stay | High‐risk population | RR 0.79 (0.40 to 1.56) | 122 | ⊕⊕⊕⊝ | Risk of bias for these 3 studies was low. We noted no heterogeneity in the results (I2 = 0%). Precision for the point estimate was low, so we downgraded the quality of the evidence 1 step. The 3 studies were conducted in the target population of newborn infants. | |
| 220 per 1000 | 165 per 1000 | |||||
| Length of NICU stay (days) | Mean length of NICU stay ranged across control groups from 9 to 37.5 days. | WMD of NICU stay for intervention groups was 5.4 days longer. | WMD 5.4 days (0.4 to 10.5) | 89 | ⊕⊕⊕⊝ | Risk of bias for these 2 studies was low. We noted no heterogeneity in the results (I2 = 0%). Precision for the point estimate was low, so we downgraded the quality of the evidence 1 step. The 2 studies were conducted in the target population of newborn infants. |
| PIPP score during drug infusion Range of scale 0‐21 for infants | Mean PIPP score in the control group was 12.7. | Mean PIPP score in the intervention group was lower at 8.9. | MD ‐3.80 | 43 | ⊕⊕⊕⊝ | Risk of bias for this study was low. As we identified only 1 study, tests for heterogeneity were not applicable. Precision for the point estimate was low, so we downgraded the quality of the evidence 1 step. This study was conducted in the target population of newborn infants. |
| Poor neurological outcome by 28 days' postnatal age | High‐risk population | RR 1.34 | 43 | ⊕⊕⊕⊝ | Risk of bias for this study was low. As we identified only 1 study, tests for heterogeneity were not applicable. Precision for the point estimate was low, so we downgraded the quality of the evidence 1 step. This study was conducted in the target population of newborn infants. | |
| 230 per 1000 | 310 per 1000 | |||||
| *The basis for the assumed risk (e.g. median control group risk across studies) is provided in footnotes. The corresponding risk (and its 95% confidence interval) is based on assumed risk in the comparison group and the relative effect of the intervention (and its 95% CI). | ||||||
| GRADE Working Group grades of evidence. | ||||||
| Midazolam infusion compared with morphine infusion for sedation in neonates | ||||||
| Patient or population: neonates requiring intubation and ventilation Setting: neonatal intensive care unit Intervention: midazolam infusion Comparison: morphine infusion | ||||||
| Outcomes | Illustrative comparative risks* (95% CI) | Relative effect | Number of participants | Quality of the evidence | Comments | |
| Assumed risk | Corresponding risk | |||||
| Morphine | Midazolam | |||||
| PIPP score during drug infusion Range of scale 0‐21 for infants | Mean PIPP score in the control group was 7.9. | Mean PIPP score in the intervention group was 8.9. | MD 1.00 | 46 | ⊕⊕⊕⊝ | Risk of bias for this study was low. As we identified only 1 study, tests for heterogeneity were not applicable. Precision for the point estimate was low, so we downgraded the quality of the evidence 1 step. This study was conducted in the target population of newborn infants. |
| Poor neurological outcome by 28 days' postnatal age | High‐risk population | RR 7.64 | 46 | ⊕⊕⊕⊝ | Risk of bias for this study was low. As we identified only 1 study, tests for heterogeneity were not applicable. Precision for the point estimate was low, so we downgraded the quality of the evidence 1 step. This study was conducted in the target population of newborn infants. | |
| 318 per 1000 | 41 per 1000 | |||||
| *The basis for the assumed risk (e.g. median control group risk across studies) is provided in footnotes. The corresponding risk (and its 95% confidence interval) is based on assumed risk in the comparison group and the relative effect of the intervention (and its 95% CI). | ||||||
| GRADE Working Group grades of evidence. | ||||||
| Study reference for included trial | Name of score used | Reference for the score | Age of infants/children subjected to the score | Score validated in newborns? |
| COMFORT Scale | Ambuel 1992 ‐ 37 participants (age newborn to 204 months (mean 37.1; SD 52.7)) Marx 1994 ‐ children (age 0 to 102 months (mean age > 1 year) | No | ||
| Sedation score | Barrier 1989 ‐ 23 infants (age 1 to 7 months) | No | ||
| Behaviour score | Craig 1984 ‐ 30 children (age 2 to 24 months) Barrier 1989; Robieux 1991 ‐ 41 infants and toddlers (age 3 to 36 months) | No |
| Outcome or subgroup title | No. of studies | No. of participants | Statistical method | Effect size |
| 1 Intraventricular haemorrhage (any grade) Show forest plot | 3 | 122 | Risk Ratio (M‐H, Fixed, 95% CI) | 1.68 [0.87, 3.24] |
| 2 Mortality Show forest plot | 3 | 122 | Risk Ratio (M‐H, Fixed, 95% CI) | 0.79 [0.40, 1.56] |
| 3 Days of ventilation Show forest plot | 2 | 89 | Mean Difference (IV, Fixed, 95% CI) | 3.60 [‐0.25, 7.44] |
| 4 Days of supplemental oxygen use Show forest plot | 2 | 89 | Mean Difference (IV, Fixed, 95% CI) | 0.64 [‐5.30, 6.57] |
| 5 Pneumothorax Show forest plot | 3 | 122 | Risk Ratio (M‐H, Fixed, 95% CI) | 1.08 [0.41, 2.84] |
| 6 Length of NICU stay (days) Show forest plot | 2 | 89 | Mean Difference (IV, Fixed, 95% CI) | 5.44 [0.40, 10.49] |
| 7 Average NAPI scores at 36 weeks' PMA Show forest plot | 1 | 43 | Mean Difference (IV, Fixed, 95% CI) | ‐2.10 [‐14.38, 10.18] |
| 8 Poor neurological outcome by 28 days' postnatal age Show forest plot | 1 | 43 | Risk Ratio (M‐H, Fixed, 95% CI) | 1.34 [0.50, 3.56] |
| 9 PIPP score during drug infusion Show forest plot | 1 | 43 | Mean Difference (IV, Fixed, 95% CI) | ‐3.80 [‐5.93, ‐1.67] |
| Outcome or subgroup title | No. of studies | No. of participants | Statistical method | Effect size |
| 1 PIPP score during drug infusion Show forest plot | 1 | 46 | Mean Difference (IV, Fixed, 95% CI) | 1.0 [‐0.66, 2.66] |
| 2 Poor neurological outcome up to 28 days' postnatal age Show forest plot | 1 | 46 | Risk Ratio (M‐H, Fixed, 95% CI) | 7.64 [1.02, 57.21] |