Scolaris Content Display Scolaris Content Display

Flow diagram of literature search
Figuras y tablas -
Figure 1

Flow diagram of literature search

Methodological quality graph: review authors' judgements about each methodological quality item presented as percentages across all included studies.
Figuras y tablas -
Figure 2

Methodological quality graph: review authors' judgements about each methodological quality item presented as percentages across all included studies.

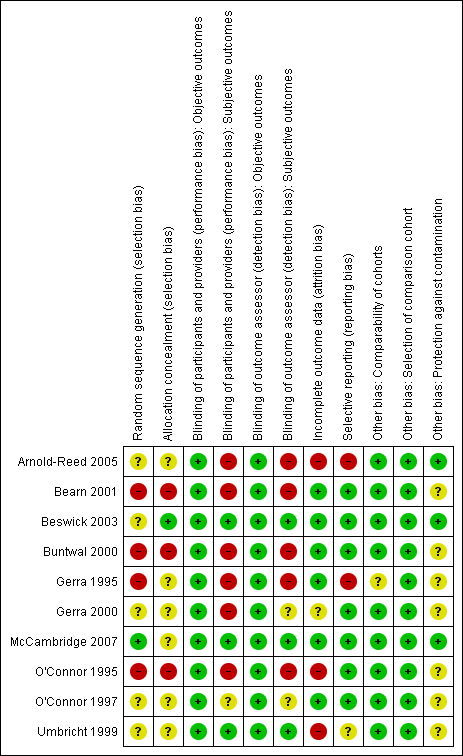
Methodological quality summary: review authors' judgements about each methodological quality item for each included study.
Figuras y tablas -
Figure 3

Methodological quality summary: review authors' judgements about each methodological quality item for each included study.

Comparison 1 Antagonist‐adrenergic combination versus adrenergic agonist, Outcome 1 Peak withdrawal severity.
Figuras y tablas -
Analysis 1.1

Comparison 1 Antagonist‐adrenergic combination versus adrenergic agonist, Outcome 1 Peak withdrawal severity.

Comparison 1 Antagonist‐adrenergic combination versus adrenergic agonist, Outcome 2 Overall withdrawal severity.
Figuras y tablas -
Analysis 1.2

Comparison 1 Antagonist‐adrenergic combination versus adrenergic agonist, Outcome 2 Overall withdrawal severity.

Comparison 1 Antagonist‐adrenergic combination versus adrenergic agonist, Outcome 3 Completion rate.
Figuras y tablas -
Analysis 1.3

Comparison 1 Antagonist‐adrenergic combination versus adrenergic agonist, Outcome 3 Completion rate.

Summary of findings for the main comparison. Antagonist‐adrenergic combination compared to adrenergic agonist for opioid withdrawal

Antagonist‐adrenergic combination compared to adrenergic agonist for opioid withdrawal

Patient or population: opioid dependent adults
Setting: inpatient or outpatient
Intervention: antagonist‐adrenergic combination
Comparison: adrenergic agonist

Outcomes

Impact

№ of participants
(studies)

Quality of the evidence
(GRADE)

Peak withdrawal severity ‐ Naltrexone

In 1 study peak withdrawal severity was similar for the 2 types of intervention. In the other study peak withdrawal was more severe in the group receiving antagonist‐adrenergic combination.

184
(2 RCTs)

⊕⊝⊝⊝
Very lowa,b,c

Peak withdrawal severity ‐ Naloxone

This comparison reported by only 1 study, which found more severe withdrawal with naloxone‐clonidine combination.

91
(1 RCT)

⊕⊝⊝⊝
Very lowa,c

Overall withdrawal severity ‐ Naltrexone

No difference in overall withdrawal severity for 2 studies; in 1 study overall severity significantly less for antagonist‐adrenergic combination.

256
(3 observational studies)

⊕⊝⊝⊝
Very lowb,c,d

Overall withdrawal severity ‐ Naloxone

This comparison reported by only 1 study, which found less severe overall withdrawal with naloxone‐lofexidine combination.

49
(1 observational study)

⊕⊝⊝⊝
Very lowa c

Completion rate ‐ Naltrexone

Completion rate with adrenergic agonist only ranged from 42% to 94%. Completion rate with antagonist‐adrenergic agonist combination ranged from 73% to 95%

330
(4 RCTs)

⊕⊝⊝⊝
Very lowb,c,d,e

Completion rate ‐ Naloxone

Completion rate with adrenergic agonist only ranged from 28% to 94%. Completion rate with antagonist‐adrenergic agonist combination ranged from 73% to 98%

463
(6 RCTs)

⊕⊝⊝⊝
Very lowb,c,e,f

*The risk in the intervention group (and its 95% confidence interval) is based on the assumed risk in the comparison group and the relative effect of the intervention (and its 95% CI).
CI: confidence interval; RR: risk ratio; OR: odds ratio

GRADE Working Group grades of evidence
High quality: we are very confident that the true effect lies close to that of the estimate of the effect
Moderate quality: we are moderately confident in the effect estimate: The true effect is likely to be close to the estimate of the effect, but there is a possibility that it is substantially different
Low quality: our confidence in the effect estimate is limited: The true effect may be substantially different from the estimate of the effect
Very low quality: we have very little confidence in the effect estimate: The true effect is likely to be substantially different from the estimate of effect

aOne study at high risk of bias.
bUnexplained inconsistency in results.
cSmall studies.
dTwo studies not randomised.
eStudies at high risk of bias.
fOne study not randomised.

Figuras y tablas -
Summary of findings for the main comparison. Antagonist‐adrenergic combination compared to adrenergic agonist for opioid withdrawal
Comparison 1. Antagonist‐adrenergic combination versus adrenergic agonist

Outcome or subgroup title

No. of studies

No. of participants

Statistical method

Effect size

1 Peak withdrawal severity Show forest plot

2

Std. Mean Difference (IV, Random, 95% CI)

Totals not selected

1.1 Naltrexone

2

Std. Mean Difference (IV, Random, 95% CI)

0.0 [0.0, 0.0]

1.2 Naloxone

1

Std. Mean Difference (IV, Random, 95% CI)

0.0 [0.0, 0.0]

2 Overall withdrawal severity Show forest plot

4

Std. Mean Difference (IV, Random, 95% CI)

Totals not selected

2.1 Naltrexone

3

Std. Mean Difference (IV, Random, 95% CI)

0.0 [0.0, 0.0]

2.2 Naloxone

1

Std. Mean Difference (IV, Random, 95% CI)

0.0 [0.0, 0.0]

3 Completion rate Show forest plot

9

Risk Ratio (M‐H, Random, 95% CI)

Totals not selected

3.1 Naltrexone

4

Risk Ratio (M‐H, Random, 95% CI)

0.0 [0.0, 0.0]

3.2 Naloxone

6

Risk Ratio (M‐H, Random, 95% CI)

0.0 [0.0, 0.0]

Figuras y tablas -
Comparison 1. Antagonist‐adrenergic combination versus adrenergic agonist