| 1 CLD at 36 weeks PMA Show forest plot | 5 | 429 | Risk Ratio (M‐H, Fixed, 95% CI) | 0.97 [0.62, 1.52] |
|
| 2 CLD at 28 days of age Show forest plot | 5 | 429 | Risk Difference (M‐H, Random, 95% CI) | 0.03 [‐0.08, 0.14] |
|
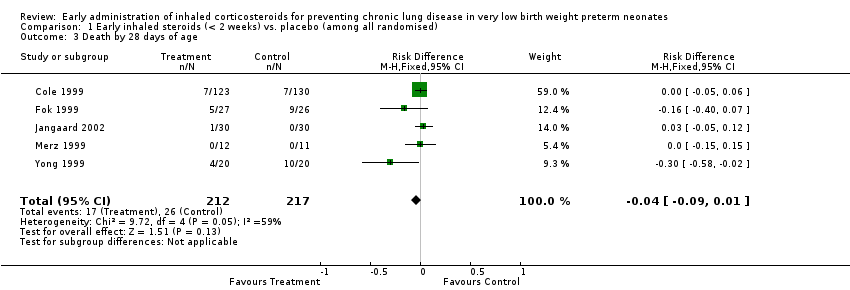
| 3 Death by 28 days of age Show forest plot | 5 | 429 | Risk Difference (M‐H, Fixed, 95% CI) | ‐0.04 [‐0.09, 0.01] |
|
| 4 Death by 36 weeks PMA Show forest plot | 6 | 1285 | Risk Difference (M‐H, Fixed, 95% CI) | 0.01 [‐0.03, 0.05] |
|
| 5 Death by or CLD at 28 days of age Show forest plot | 5 | 429 | Risk Difference (M‐H, Fixed, 95% CI) | ‐0.02 [‐0.11, 0.07] |
|
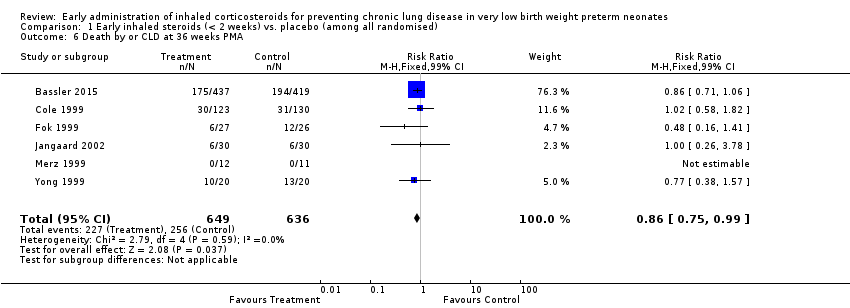
| 6 Death by or CLD at 36 weeks PMA Show forest plot | 6 | 1285 | Risk Ratio (M‐H, Fixed, 99% CI) | 0.86 [0.75, 0.99] |
|
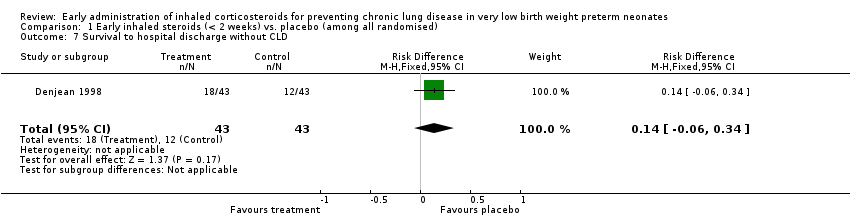
| 7 Survival to hospital discharge without CLD Show forest plot | 1 | 86 | Risk Difference (M‐H, Fixed, 95% CI) | 0.14 [‐0.06, 0.34] |
|
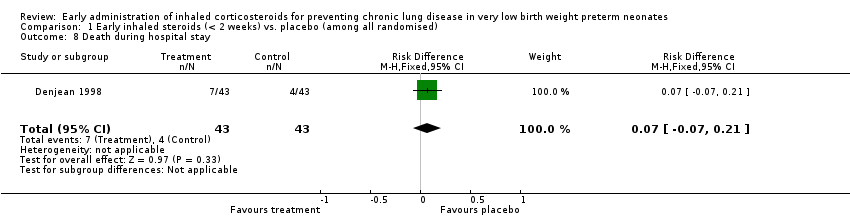
| 8 Death during hospital stay Show forest plot | 1 | 86 | Risk Difference (M‐H, Fixed, 95% CI) | 0.07 [‐0.07, 0.21] |
|
| 9 Culture proven infection during hospital stay Show forest plot | 6 | 1121 | Risk Difference (M‐H, Fixed, 95% CI) | 0.05 [‐0.00, 0.11] |
|
| 9.1 Positive blood or CSF culture | 2 | 896 | Risk Difference (M‐H, Fixed, 95% CI) | 0.05 [‐0.01, 0.11] |
| 9.2 Positive blood culture | 4 | 225 | Risk Difference (M‐H, Fixed, 95% CI) | 0.05 [‐0.06, 0.16] |
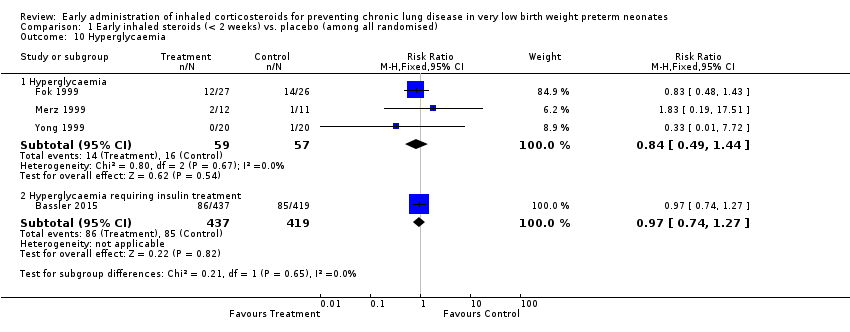
| 10 Hyperglycaemia Show forest plot | 4 | | Risk Ratio (M‐H, Fixed, 95% CI) | Subtotals only |
|
| 10.1 Hyperglycaemia | 3 | 116 | Risk Ratio (M‐H, Fixed, 95% CI) | 0.84 [0.49, 1.44] |
| 10.2 Hyperglycaemia requiring insulin treatment | 1 | 856 | Risk Ratio (M‐H, Fixed, 95% CI) | 0.97 [0.74, 1.27] |
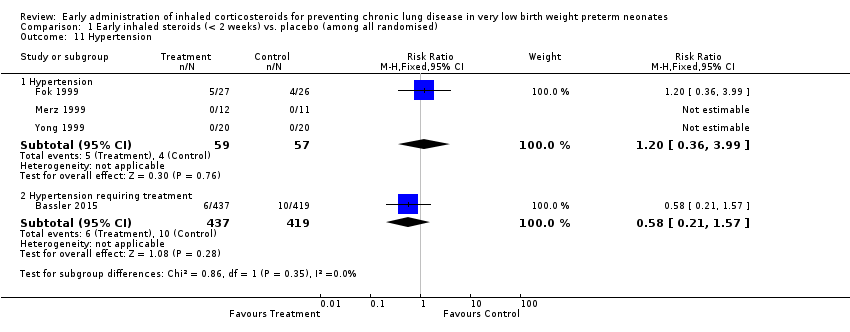
| 11 Hypertension Show forest plot | 4 | | Risk Ratio (M‐H, Fixed, 95% CI) | Subtotals only |
|
| 11.1 Hypertension | 3 | 116 | Risk Ratio (M‐H, Fixed, 95% CI) | 1.20 [0.36, 3.99] |
| 11.2 Hypertension requiring treatment | 1 | 856 | Risk Ratio (M‐H, Fixed, 95% CI) | 0.58 [0.21, 1.57] |
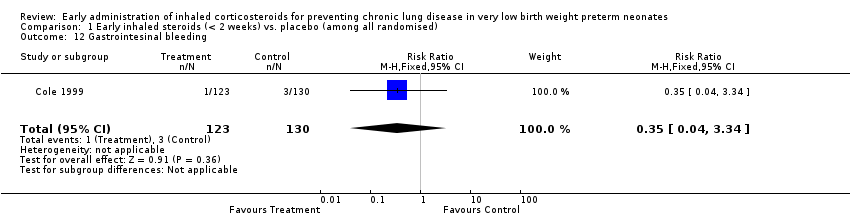
| 12 Gastrointesinal bleeding Show forest plot | 1 | 253 | Risk Ratio (M‐H, Fixed, 95% CI) | 0.35 [0.04, 3.34] |
|
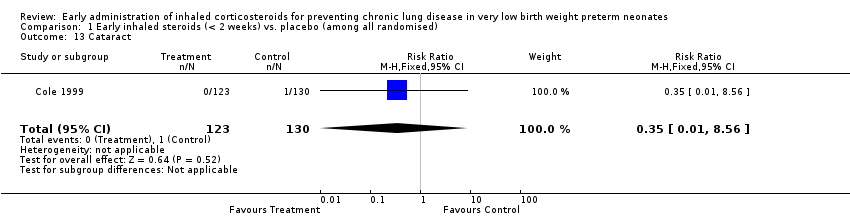
| 13 Cataract Show forest plot | 1 | 253 | Risk Ratio (M‐H, Fixed, 95% CI) | 0.35 [0.01, 8.56] |
|
| 14 Intraventricular haemorrhage Show forest plot | 2 | 306 | Risk Ratio (M‐H, Fixed, 95% CI) | 1.04 [0.77, 1.41] |
|
| 15 Periventricular leukomalacia Show forest plot | 2 | 306 | Risk Ratio (M‐H, Fixed, 95% CI) | 1.43 [0.59, 3.46] |
|
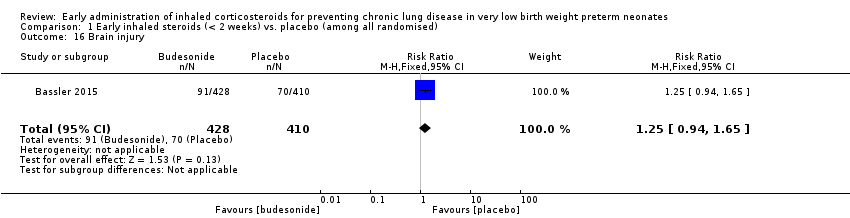
| 16 Brain injury Show forest plot | 1 | 838 | Risk Ratio (M‐H, Fixed, 95% CI) | 1.25 [0.94, 1.65] |
|
| 17 Necrotizing enterocolitis Show forest plot | 3 | 1162 | Risk Ratio (M‐H, Fixed, 95% CI) | 0.92 [0.68, 1.24] |
|
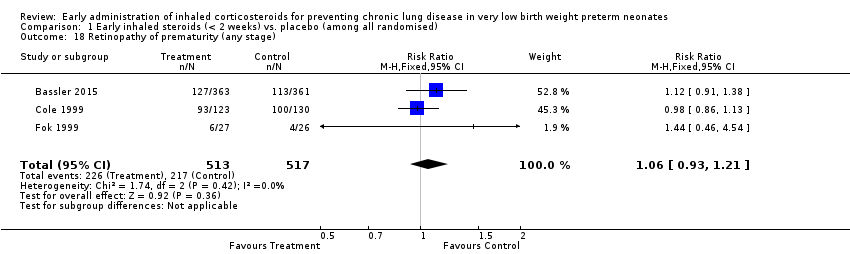
| 18 Retinopathy of prematurity (any stage) Show forest plot | 3 | 1030 | Risk Ratio (M‐H, Fixed, 95% CI) | 1.06 [0.93, 1.21] |
|
| 19 Patent ductus arteriosus Show forest plot | 1 | 53 | Risk Ratio (M‐H, Fixed, 95% CI) | 0.82 [0.57, 1.17] |
|
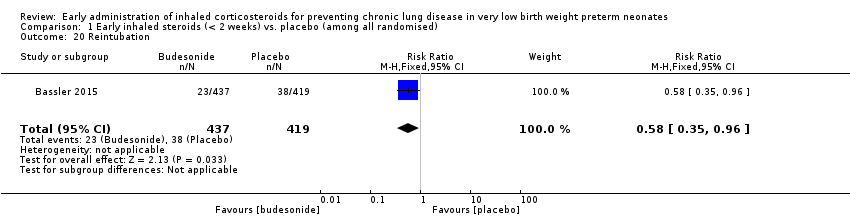
| 20 Reintubation Show forest plot | 1 | 856 | Risk Ratio (M‐H, Fixed, 95% CI) | 0.58 [0.35, 0.96] |
|
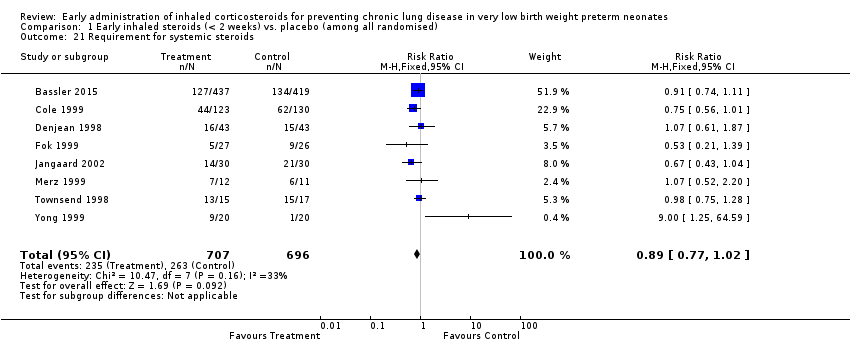
| 21 Requirement for systemic steroids Show forest plot | 8 | 1403 | Risk Ratio (M‐H, Fixed, 95% CI) | 0.89 [0.77, 1.02] |
|
| 22 Failure to extubate within 14 days Show forest plot | 5 | 193 | Risk Ratio (M‐H, Fixed, 95% CI) | 0.97 [0.76, 1.24] |
|
| 23 Death or oxygen dependency at discharge Show forest plot | 1 | 211 | Risk Ratio (M‐H, Fixed, 95% CI) | 0.63 [0.35, 1.15] |
|
| 24 Death or severe BPD Show forest plot | 1 | 211 | Risk Ratio (M‐H, Fixed, 95% CI) | 0.93 [0.70, 1.25] |
|
| 25 Death or grade 3 or 4 IVH Show forest plot | 1 | 211 | Risk Ratio (M‐H, Fixed, 95% CI) | 1.05 [0.65, 1.68] |
|
| 26 Death or PVL Show forest plot | 1 | 211 | Risk Ratio (M‐H, Fixed, 95% CI) | 0.89 [0.41, 1.93] |
|
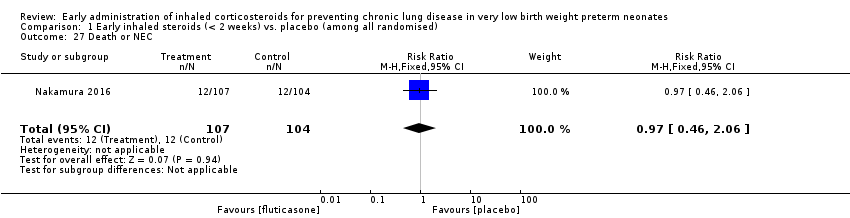
| 27 Death or NEC Show forest plot | 1 | 211 | Risk Ratio (M‐H, Fixed, 95% CI) | 0.97 [0.46, 2.06] |
|
| 28 Death or sepsis Show forest plot | 1 | 211 | Risk Ratio (M‐H, Fixed, 95% CI) | 0.79 [0.44, 1.40] |
|
| 29 Death or ROP (stage not stated) Show forest plot | 1 | 211 | Risk Ratio (M‐H, Fixed, 95% CI) | 1.05 [0.79, 1.40] |
|
| 30 Death or neurodevelopmental impairment at 18 months PMA Show forest plot | 1 | 187 | Risk Ratio (M‐H, Fixed, 95% CI) | 1.09 [0.70, 1.70] |
|
| 31 Death or neurodevelopmental impairment at 3 years of age Show forest plot | 1 | 179 | Risk Ratio (M‐H, Fixed, 95% CI) | 1.03 [0.68, 1.56] |
|
| 32 Death or cerebral palsy at 3 years of age Show forest plot | 1 | 190 | Risk Ratio (M‐H, Fixed, 95% CI) | 1.12 [0.64, 1.96] |
|