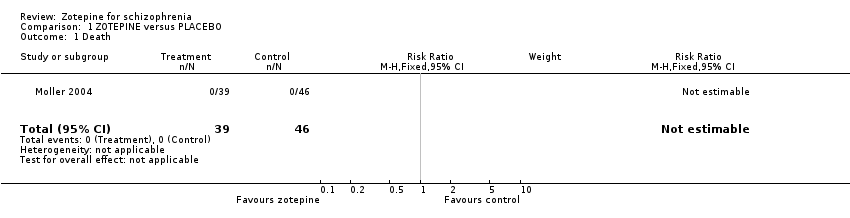
| 1 Death Show forest plot | 1 | 85 | Risk Ratio (M‐H, Fixed, 95% CI) | 0.0 [0.0, 0.0] |
|
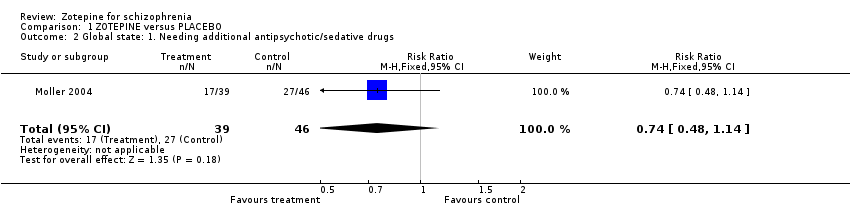
| 2 Global state: 1. Needing additional antipsychotic/sedative drugs Show forest plot | 1 | 85 | Risk Ratio (M‐H, Fixed, 95% CI) | 0.74 [0.48, 1.14] |
|
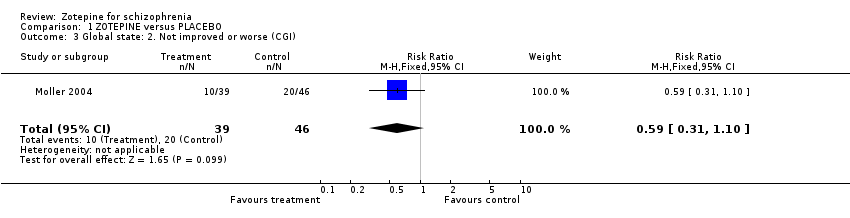
| 3 Global state: 2. Not improved or worse (CGI) Show forest plot | 1 | 85 | Risk Ratio (M‐H, Fixed, 95% CI) | 0.59 [0.31, 1.10] |
|
| 4 Global state: 3. Average endpoint score (CGI, higher scores=poor) at 8 weeks Show forest plot | 1 | 106 | Mean Difference (IV, Fixed, 95% CI) | ‐1.0 [‐1.50, ‐0.50] |
|
| 5 Global state: 4. Hospitalisation Show forest plot | 1 | 85 | Risk Ratio (M‐H, Fixed, 95% CI) | 0.39 [0.02, 9.35] |
|
| 6 Mental state: 1. No important clinical response ‐ by 4‐12 weeks (20% reduction in BPRS from baseline) Show forest plot | 1 | 106 | Risk Ratio (M‐H, Fixed, 95% CI) | 0.44 [0.27, 0.72] |
|
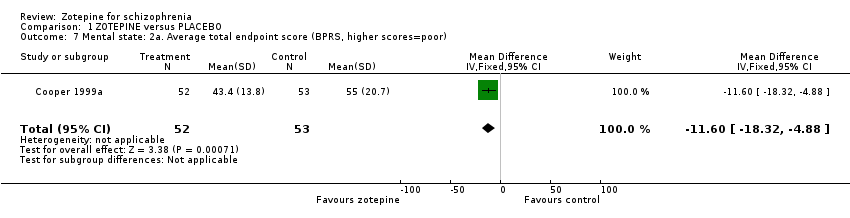
| 7 Mental state: 2a. Average total endpoint score (BPRS, higher scores=poor) Show forest plot | 1 | 105 | Mean Difference (IV, Fixed, 95% CI) | ‐11.60 [‐18.32, ‐4.88] |
|
| 8 Mental state: 2b. Average total change scores by 8 weeks (PANSS, higher scores=poor, LOCF) Show forest plot | 1 | 79 | Mean Difference (IV, Fixed, 95% CI) | ‐4.9 [‐12.36, 2.56] |
|
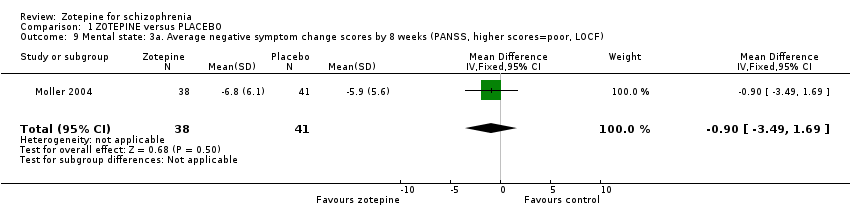
| 9 Mental state: 3a. Average negative symptom change scores by 8 weeks (PANSS, higher scores=poor, LOCF) Show forest plot | 1 | 79 | Mean Difference (IV, Fixed, 95% CI) | ‐0.90 [‐3.49, 1.69] |
|
| 10 Mental state: 3b. Average negative symptom endpoint score (SANS, higher scores=poor) Show forest plot | 1 | 105 | Mean Difference (IV, Fixed, 95% CI) | ‐12.5 [‐22.68, ‐2.32] |
|
| 11 Mental state: 4. Average positive symptom change scores by 8 weeks (PANSS, higher scores=poor, LOCF) Show forest plot | 1 | 79 | Mean Difference (IV, Fixed, 95% CI) | ‐1.0 [‐2.63, 0.63] |
|
| 12 Mental state: 5. Average general psychopathology change scores by 8 weeks (PANSS, higher scores=poor, LOCF) Show forest plot | 1 | 79 | Mean Difference (IV, Fixed, 95% CI) | ‐3.1 [‐7.15, 0.95] |
|
| 13 Mental state: 6. Average depression change score (MADRS, higher scores=poor, LOCF) Show forest plot | 1 | 79 | Mean Difference (IV, Fixed, 95% CI) | ‐3.0 [‐5.72, ‐0.28] |
|
| 14 Behaviour: Specific behaviour changes Show forest plot | 1 | | Risk Ratio (M‐H, Fixed, 95% CI) | Subtotals only |
|
| 14.1 agitation | 1 | 106 | Risk Ratio (M‐H, Fixed, 95% CI) | 0.74 [0.48, 1.14] |
| 14.2 hostility | 1 | 106 | Risk Ratio (M‐H, Fixed, 95% CI) | 0.74 [0.48, 1.14] |
| 14.3 nervousness | 1 | 106 | Risk Ratio (M‐H, Fixed, 95% CI) | 0.79 [0.52, 1.18] |
| 15 Leaving the study early Show forest plot | 3 | | Risk Ratio (M‐H, Fixed, 95% CI) | Subtotals only |
|
| 15.1 any reason by 8‐26 weeks | 3 | 312 | Risk Ratio (M‐H, Fixed, 95% CI) | 0.78 [0.63, 0.96] |
| 15.2 due to lack of efficacy by 8‐26 weeks | 3 | 312 | Risk Ratio (M‐H, Fixed, 95% CI) | 0.37 [0.19, 0.73] |
| 15.3 due to adverse events by 8 weeks | 1 | 85 | Risk Ratio (M‐H, Fixed, 95% CI) | 0.59 [0.11, 3.05] |
| 16 Adverse events: 1. Any adverse event Show forest plot | 2 | 191 | Risk Ratio (M‐H, Random, 95% CI) | 1.38 [0.76, 2.52] |
|
| 17 Adverse events: 2. Cardiovascular problems ‐ pulse rate Show forest plot | 1 | 106 | Mean Difference (IV, Fixed, 95% CI) | 1.90 [‐1.91, 5.71] |
|
| 18 Adverse events: 3. Gastrointestinal problems ‐ constipation Show forest plot | 1 | 106 | Risk Ratio (M‐H, Fixed, 95% CI) | 0.81 [0.52, 1.24] |
|
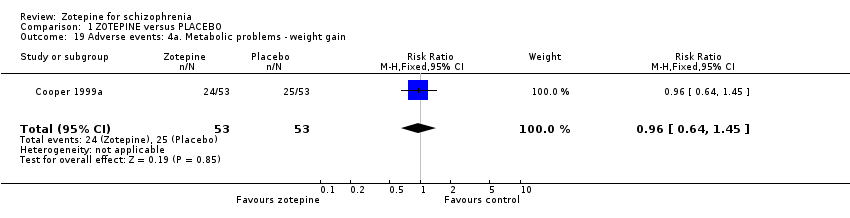
| 19 Adverse events: 4a. Metabolic problems ‐ weight gain Show forest plot | 1 | 106 | Risk Ratio (M‐H, Fixed, 95% CI) | 0.96 [0.64, 1.45] |
|
| 20 Adverse events: 4b. Metabolic problems ‐ weight change Show forest plot | 1 | 106 | Mean Difference (IV, Fixed, 95% CI) | 1.70 [‐3.54, 6.94] |
|
| 21 Adverse events: 5a. Movement disorders ‐ specific problems Show forest plot | 1 | | Risk Ratio (M‐H, Fixed, 95% CI) | Subtotals only |
|
| 21.1 akathisia | 1 | 106 | Risk Ratio (M‐H, Fixed, 95% CI) | 0.74 [0.48, 1.14] |
| 21.2 dyskinesia | 1 | 106 | Risk Ratio (M‐H, Fixed, 95% CI) | 0.8 [0.55, 1.17] |
| 21.3 needing additional anticholinergic medication | 1 | 106 | Risk Ratio (M‐H, Fixed, 95% CI) | 0.82 [0.55, 1.22] |
| 22 Adverse events: 5b. Movement disorders ‐ dyskinesia (AIMS, higher scores=poor, skewed data) Show forest plot | | | Other data | No numeric data |
|
| 23 Adverse events: 5c. Movement disorders ‐ parkinsonism (Simpson‐Angus Scale, reduction=good, skewed data) Show forest plot | | | Other data | No numeric data |
|
| 24 Adverse events: 5d. Movement disorders ‐ change scores by 8 wks (Simpson‐Angus Scale, reduction=good, LOCF) Show forest plot | 1 | 79 | Mean Difference (IV, Fixed, 95% CI) | ‐0.03 [‐0.12, 0.06] |
|
| 25 Adverse events: 5e. Movement disorders ‐change score by 8 wks(Tardive Dyskinesia Rating Scale, reduction=good) Show forest plot | 1 | 79 | Mean Difference (IV, Fixed, 95% CI) | ‐1.2 [‐2.87, 0.47] |
|
| 26 Adverse events: 6. Sleep problems Show forest plot | 1 | | Risk Ratio (M‐H, Fixed, 95% CI) | Subtotals only |
|
| 26.2 insomnia | 1 | 106 | Risk Ratio (M‐H, Fixed, 95% CI) | 0.68 [0.45, 1.01] |
| 26.5 somnolence | 1 | 106 | Risk Ratio (M‐H, Fixed, 95% CI) | 1.48 [1.06, 2.07] |
| 27 Adverse events: 7. Others Show forest plot | 1 | | Risk Ratio (M‐H, Fixed, 95% CI) | Subtotals only |
|
| 27.1 asthenia | 1 | 106 | Risk Ratio (M‐H, Fixed, 95% CI) | 0.89 [0.60, 1.32] |
| 27.2 liver function abnormalities | 1 | 106 | Risk Ratio (M‐H, Fixed, 95% CI) | 0.85 [0.56, 1.29] |
| 27.3 pain | 1 | 106 | Risk Ratio (M‐H, Fixed, 95% CI) | 0.92 [0.62, 1.38] |
| 27.4 saliva increase | 1 | 106 | Risk Ratio (M‐H, Fixed, 95% CI) | 0.88 [0.57, 1.35] |
| 28 Quality of life: Average change score by 8 weeks (SF‐36, high score=better) Show forest plot | 1 | | Mean Difference (IV, Fixed, 95% CI) | Subtotals only |
|
| 28.1 physical functioning | 1 | 72 | Mean Difference (IV, Fixed, 95% CI) | 6.90 [‐1.93, 15.73] |
| 28.2 physical role functions | 1 | 72 | Mean Difference (IV, Fixed, 95% CI) | 20.6 [2.65, 38.55] |
| 28.3 physical pain | 1 | 72 | Mean Difference (IV, Fixed, 95% CI) | 8.1 [‐6.20, 22.40] |
| 28.4 perception of general health status | 1 | 72 | Mean Difference (IV, Fixed, 95% CI) | 4.40 [‐2.75, 11.55] |
| 28.5 vitality | 1 | 72 | Mean Difference (IV, Fixed, 95% CI) | ‐2.5 [‐10.79, 5.79] |
| 28.6 social functioning | 1 | 72 | Mean Difference (IV, Fixed, 95% CI) | ‐8.5 [‐18.02, 1.02] |
| 28.7 emotional role function | 1 | 72 | Mean Difference (IV, Fixed, 95% CI) | 15.10 [‐1.96, 32.16] |
| 28.8 psychological well being | 1 | 72 | Mean Difference (IV, Fixed, 95% CI) | 4.3 [‐1.28, 9.88] |
| 28.9 physical component scale | 1 | 72 | Mean Difference (IV, Fixed, 95% CI) | 3.60 [‐0.07, 7.27] |